REVIEW 3 major objections 5 minor 96 references
Three dimensional magnetic reconnection mediated with plasmoids and the resulted multi-thermal emissions in the cool atmosphere of the Sun
T0 review · 3 major / 5 minor · reviewed 2026-08-15 · deepseek-v4-flash
Pith's one-line read Plasmoid-mediated reconnection produces Ellerman bombs and UV bursts from the same current sheet.
desk verdict A plausible first 3D RMHD look at plasmoid-mediated reconnection in the quiet lower atmosphere, but the plasmoid identification has no convergence backing. read the letter →
The pith
A machine-rendered reading of the paper's core claim, the machinery that carries it, and where it could break.
The reading
What carries the argument
The load-bearing mechanism is the plasmoid instability operating in three-dimensional current sheets: a thin, elongated reconnection layer becomes unstable and fragments into plasmoids, which in three dimensions are small twisted magnetic flux ropes ejected by bidirectional outflows. This instability converts a single smooth current sheet into a turbulent, multi-thermal structure where hot and cool plasma alternate in space. The supporting machinery is the simulation's radiation treatment and spectral synthesis, using radiative transfer for H-alpha and optically thin emission for Si IV, which allow the plasma state to be compared with observed Ellerman bomb and UV burst diagnostics.
What would settle it
Repeat the simulation at significantly higher resolution or with a physical resistivity model and check whether plasmoids, their sizes, and the 20,000 to 90,000 K heating converge; if they do not, the central claim fails. Observationally, a well-resolved event where H-alpha wing and Si IV brightenings are never co-spatial or co-temporal, despite adequate resolution, would contradict the predicted coexistence.
Extended reading notes
Core claim
The central claim is that in the cool lower solar atmosphere, magnetic reconnection is routinely mediated by the plasmoid instability, and that this turbulence is what produces the coexistence of Ellerman bombs and UV bursts. In a three-dimensional RMHD simulation driven by flux emergence, reconnection forms thin, elongated current sheets in which plasmoid-like structures develop, becoming many small twisted magnetic flux ropes expelled along the sheet. The reconnection region becomes multi-thermal: hot plasma exceeding 20,000 K, with peaks near 90,000 K, and cool plasma below 10,000 K interleave in space. Synthetic H-alpha and Si IV observations made from the simulation show the characteristic signatures of EBs and UV bursts arising from the same current sheet, with cool EB plasma located above hot plasma at heights greater than 2 Mm and hot UV-burst plasma reaching down to about 0.7 Mm. The authors state this is the first time plasmoid instability has been shown to appear in most small-scale reconnection events relating to EBs and UV bursts in a three-dimensional RMHD simulation with radiation.
Load-bearing premise
The simulation grid spacing of roughly 15 to 23 km is fine enough that the plasmoids and the associated heating are real physics rather than numerical artifacts, even though the reconnection rate and heating depend on the code's numerical dissipation.
Editorial extensions
If this is right
- Ellerman bombs and UV bursts can be two emission signatures of a single reconnection event, so joint observations in the two passbands should frequently find them co-located and synchronized.
- Cool EB-like plasma can sit above hot UV-emitting plasma, so height alone does not separate the two phenomena; the 2 Mm and 0.7 Mm altitudes bracket the same current sheet.
- UV bursts can occur in the lower chromosphere when reconnection fields are strong enough, not only at transition-region heights.
- Twisted magnetic flux ropes ejected by the reconnection carry magnetic twist upward and may contribute to coupling the lower atmosphere to the corona.
- Most small-scale reconnection in the simulated lower atmosphere is plasmoid-mediated, implying turbulent reconnection is a common heating channel there.
Reading between the lines
- If the plasmoid instability is as widespread as the simulation suggests, some observed 'two-component' events may be projection effects of a single multi-thermal sheet, which could be tested by comparing line-of-sight velocities with the predicted bidirectional outflows.
- The same plasmoid-mediated mechanism may apply to other small-scale brightenings and to events whose magnetic topology resembles flare-like configurations at smaller scales.
- Because the effective resistivity in the simulation is numerical, a resolution study is the natural next test: current-sheet aspect ratios and plasmoid sizes should follow a power law if the instability is physical.
- The simulation's limited coronal plasma above 8 Mm could alter how much reconnection-generated material is transported upward; extending the domain may change the high-altitude signatures.
Signed reviews
Editorial analysis
A structured set of objections, weighed in public.
Referee Report
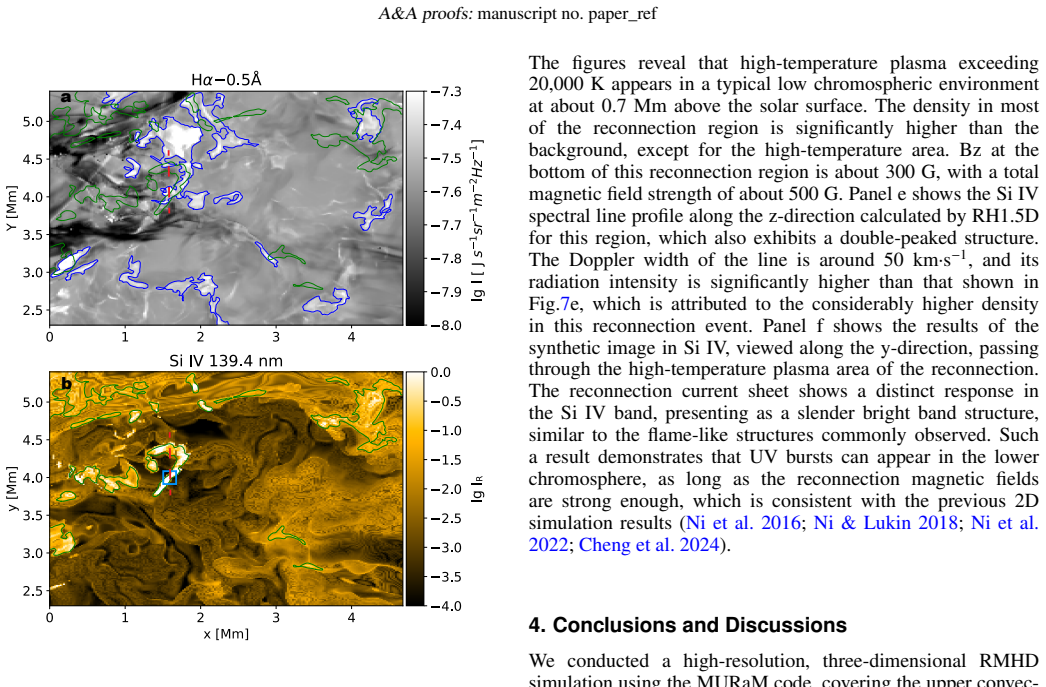
Summary. The paper reports a 3D radiation-MHD simulation of magnetic flux emergence in the solar lower atmosphere using the MURaM code, with a domain extending from the upper convection zone to 8 Mm in the atmosphere. A flat magnetic flux sheet inserted in the convection zone produces repeated small-scale magnetic reconnection events; the authors focus on one region of interest (ROI) and identify thin elongated current sheets with plasmoid-like structures and twisted flux ropes, with hot (>20,000 K) and cool (<10,000 K) plasma coexisting in a fragmented pattern. Using RH1.5D for Halpha and Si IV profiles and optically thin synthesis for Si IV 139.4 nm and EUI 17.4 nm images, they find wing-enhanced Halpha signatures characteristic of Ellerman bombs and double-peaked Si IV profiles characteristic of UV bursts, sometimes at the same reconnection region. They also report a cool EB-like blob above hot plasma at heights >2 Mm and another event with hot UV-burst plasma at about 0.7 Mm. They conclude that 3D turbulent reconnection mediated by the plasmoid instability can explain temporally and spatially connected EBs and UV bursts and the multi-thermal emission structure.
Significance. If the results hold, this is a notable step: it is, to my knowledge, the first 3D RMHD simulation that identifies plasmoid-mediated reconnection in the cool lower atmosphere of the Sun in the context of EBs and UV bursts, extending earlier 2D/2.5D models (Ni et al. 2021; Cheng et al. 2024) to a more realistic 3D geometry. The use of a well-tested code (MURaM), the standard RH1.5D radiative transfer code, optically thin CHIANTI-based synthesis, and explicit comparison with observational Halpha and Si IV line characteristics are clear strengths. The predicted coexistence and height inversion of cool and hot plasmas provide a falsifiable observational diagnostic. However, the case-study nature and the lack of resolution verification limit the strength of the general conclusions.
major comments (3)
- [Section 2 and Figs. 2-4] The central claim that plasmoid-mediated reconnection produces the multi-thermal structure rests on the physical reality of the small-scale filamentation, but the paper offers no quantitative resolution verification. The grid spacing is 23.4 km in x and 15.63 km in y and z, MURaM's magnetic diffusion is numerical hyperdiffusion, and Section 2 itself notes the resolution is much lower than in the previous 2D AMR runs. Without a resolution study, a measured current-sheet width, a local Lundquist-number estimate, or a plasmoid size distribution, the blob-like isosurfaces in Figs. 2-4 could plausibly be grid-scale numerical dissipation artifacts rather than a converged tearing-mode cascade. Since the height inversion and the co-spatial EB/UV emission claims follow directly from this filamentation, please add either a convergence test at an intermediate resolution or a quantitative demonstration that the plasmoid sizes are well above the grid scale and that the heating is not governed by the numerical dissipation.
- [Section 3.1 and Section 4 (conclusions)] The text states that 'plasmoid instability appears in most of these reconnection events' and that 'most small-scale reconnection lead to the formation of twisted magnetic flux ropes,' but only one event (the ROI) is analyzed in detail, and a second event is shown in Section 3.3. No event census, selection criterion, or statistical measure is provided to support 'most.' Please either quantify the fraction of events showing plasmoids and flux ropes with clear selection criteria, or weaken the claim to a case study, because the general conclusion as written exceeds the presented evidence.
- [Section 3.3 and Fig. 8] The claim that cool EB-like plasma is located above hot plasma at heights greater than 2 Mm is based on a single cool blob and a single synthesized Halpha profile. The wing enhancement in Fig. 8b is shown after subtracting a nearby background profile, but no analysis is given of how sensitive this result is to the size or location of the background region, nor is the statistical significance of the enhancement estimated. Since this height inversion is one of the paper's headline results, please provide a quantitative characterization of the blob (temperature, density, line-center optical depth, and background-subtraction sensitivity) or show the same behavior in additional events.
minor comments (5)
- [Abstract and Section 1] The abstract and Section 1 contain typos such as 'comaprison' and 'Figsures'; the manuscript would benefit from a careful proofread.
- [Figs. 2, 3, 4] The color bars and axis labels in these figures appear garbled in the version I reviewed, with repeated tick values and duplicated labels; please check the figure production pipeline and provide clean, readable color scales.
- [Section 3.2] The text refers to the code as 'RH1.5' in the first sentence of Section 3.2 but as 'RH1.5D' elsewhere; please use the acronym consistently.
- [References] The Cheng et al. (2024) references appear in two forms (arXiv:2402.07175 and ApJ 966, L29); please unify the citation entries.
- [Section 4] The limitation concerning depletion of coronal material near the upper boundary is acknowledged, but the paper should state whether any of the analyzed events (e.g., the current sheet extending to about 6 Mm in Fig. 3) are affected by this boundary-induced deficit.
Circularity Check
No significant circularity: the central results are outputs of a new 3D RMHD simulation and forward-modeled radiative diagnostics, with self-citations used for context and comparison rather than as load-bearing proof.
full rationale
The paper's central claims are generated by a new 3D radiation-MHD simulation in MURaM and post-processed with RH1.5D and optically thin synthesis. No parameter of the simulation is fitted to the EB or UV-burst observations against which the synthetic H-alpha and Si IV signatures are compared; the synthetic observables are produced from the simulated atmosphere, not defined in terms of the target observations. The self-citations (Ni et al. 2021; Cheng et al. 2024) appear as prior context, resolution comparisons, and consistency checks, but the identification of plasmoid-like structures rests on the 3D simulation's own magnetic-field topology, temperature, density, and current-density distributions, not on an imported theorem or on the cited papers' conclusions. The statement that the 3D results 'further validat[e] the model we previously proposed' is an explicit acknowledgment of continuity, not a reduction of the new evidence to that model. The resolution limitation acknowledged in Section 2 is a correctness or verification concern (whether the 15 km grid captures a genuine tearing-mode cascade), but it is not a circularity: inadequate resolution would weaken the physical claim, not make the conclusion an input to the calculation. No equation, diagnostic, or statistical procedure reduces by construction to a fitted parameter or to a self-citation, so no specific circular step can be exhibited.
Assumptions & free parameters
free parameters (3)
- Initial magnetic flux sheet peak strength =
2200 G
- Simulation domain height =
8 Mm above surface
- Grid resolution =
23.4 km (x), 15.63 km (y, z)
assumptions (5)
- domain assumption The MURaM code's numerical dissipation, with settings identical to Przybylski et al. (2022), accurately models the effective resistivity and viscosity in the lower atmosphere.
- domain assumption The LTE radiative cooling model for the photosphere and lower chromosphere and the optically thin cooling model for the upper atmosphere are adequate for the temperatures and densities in the reconnection region.
- domain assumption The RH1.5D column-by-column approximation and the optically thin approximation for Si IV and EUI images are adequate for the synthetic observables.
- domain assumption The initial convecting atmosphere and the flux sheet insertion produce a realistic distribution of emerging magnetic field in the lower atmosphere.
- standard math The standard MHD equations with the Uppsala equation of state provide a valid description of the plasma in the lower solar atmosphere.
Cite this review
Pith. "Pith review of Three dimensional magnetic reconnection mediated with plasmoids and the resulted multi-thermal emissions in the cool atmosphere of the Sun." pith.science (2026). https://pith.science/paper/LGU6T6VP
@misc{pith2026250811013,
  author       = {Pith},
  title        = {Pith review of: Three dimensional magnetic reconnection mediated with plasmoids and the resulted multi-thermal emissions in the cool atmosphere of the Sun},
  year         = {2026},
  howpublished = {\url{https://pith.science/paper/LGU6T6VP}},
  note         = {Machine review of arXiv:2508.11013}
}
read the original abstract
Flux emergence is ubiquitous in the Sun's lower atmosphere, where the emerging magnetic flux can reconnect with the pre-existing magnetic field. We investigate plasmoid formation and the resulting multi-thermal emissions during three-dimensional magnetic reconnection in the lower solar atmosphere. We performed 3D radiation magnetohydrodynamic simulations using the MURaM code, which incorporates solar convection and radiative transfer. A flat magnetic flux sheet was introduced into the convection zone to trigger flux emergence. For comparison with previous observations, we used the RH1.5D code to synthesize H{\alpha} and Si IV spectral line profiles, and generated ultraviolet images using the optically thin approximation. The simulations show that flux emergence occurs as the imposed flux tube crosses the photosphere. In the lower solar atmosphere, magnetic reconnection forms thin, elongated current sheets, and plasmoid-like structures develop, producing numerous small twisted magnetic flux ropes that are expelled toward both ends of the reconnection region. This process results in the coexistence of hot plasma exceeding 20,000 K and cooler plasma below 10,000 K. Synthetic images and spectral line profiles through the reconnection region exhibit features characteristic of Ellerman bombs (EBs) and UV bursts. Cooler plasma associated with EBs can be found above hot plasma at altitudes exceeding 2 Mm above the solar surface, while hot plasma associated with UV bursts can extend downward into the lower chromosphere, reaching approximately 0.7 Mm above the surface. These results indicate that turbulent reconnection mediated by plasmoid instability can occur in small-scale events such as EBs and UV bursts, and that the coexistence of hot and cool plasma in such reconnection processes can account for UV bursts that are temporally and spatially connected to EBs.
Figures


Figures from the paper (6 more)




Reference graph
Works this paper leans on
-
[1]
Abbett, W. P. & Fisher, G. H.\ 2012, , 277, 3. doi:10.1007/s11207-011-9817-3
-
[2]
Archontis, V. & Hood, A. W.\ 2009, , 508, 1469. doi:10.1051/0004-6361/200912455
-
[3]
Avrett, E. H. & Loeser, R.\ 2008, , 175, 229. doi:10.1086/523671
doi:10.1086/523671 2008
-
[4]
& Heinzel, P.\ 2014, , 567, A110
Berlicki, A. & Heinzel, P.\ 2014, , 567, A110. doi:10.1051/0004-6361/201323244
-
[5]
Carlsson, M. & Stein, R. F.\ 2002, , 572, 626. doi:10.1086/340293
doi:10.1086/340293 2002
-
[6]
& Leenaarts, J.\ 2012, , 539, A39
Carlsson, M. & Leenaarts, J.\ 2012, , 539, A39. doi:10.1051/0004-6361/201118366
-
[7]
Chen, Y., Tian, H., Zhu, X., et al.\ 2019, Science in China E: Technological Sciences, 62, 1555. doi:10.1007/s11431-018-9471-6
-
[8]
Chen, Y., Tian, H., Peter, H., et al.\ 2019, , 875, L30. doi:10.3847/2041-8213/ab18a4
Show all 96 references
-
[9]
doi:10.1051/0004-6361/202140638
Chen, Y., Przybylski, D., Peter, H., et al.\ 2021, , 656, L7. doi:10.1051/0004-6361/202140638
2021 doi
-
[10]
doi:10.1088/1674-4527/21/9/229
Cheng, G.-C., Ni, L., Chen, Y.-J., et al.\ 2021, Research in Astronomy and Astrophysics, 21, 229. doi:10.1088/1674-4527/21/9/229
2021 doi
- [11]
-
[12]
doi:10.3847/2041-8213/ad4027
Cheng, G., Ni, L., Tang, Z., et al.\ 2024, , 966, L29. doi:10.3847/2041-8213/ad4027
2024 doi
-
[13]
Cheung, M. C. M. & Isobe, H.\ 2014, Living Reviews in Solar Physics, 11, 3. doi:10.12942/lrsp-2014-3
2014 doi
-
[14]
P., Peter, H., Solanki, S
Chitta, L. P., Peter, H., Solanki, S. K., et al.\ 2017, , 229, 4. doi:10.3847/1538-4365/229/1/4
2017 doi
-
[15]
P., Peter, H., Young, P
Chitta, L. P., Peter, H., Young, P. R., et al.\ 2017, , 605, A49. doi:10.1051/0004-6361/201730830
2017 doi
-
[16]
doi:10.1002/asna.201211738
Collados, M., L \'o pez, R., P \'a ez, E., et al.\ 2012, Astronomische Nachrichten, 333, 872. doi:10.1002/asna.201211738
2012 doi
-
[17]
doi:10.1051/0004-6361/201730403
Danilovic, S.\ 2017, , 601, A122. doi:10.1051/0004-6361/201730403
2017 doi
-
[18]
M., Lemen, J
De Pontieu, B., Title, A. M., Lemen, J. R., et al.\ 2014, , 289, 2733. doi:10.1007/s11207-014-0485-y
2014 doi
-
[19]
P., Landi, E., Mason, H
Dere, K. P., Landi, E., Mason, H. E., et al.\ 1997, , 125, 149. doi:10.1051/aas:1997368
1997 doi
- [20]
-
[21]
H., Xu, Z., et al.\ 2006, , 643, 1325
Fang, C., Tang, Y. H., Xu, Z., et al.\ 2006, , 643, 1325. doi:10.1086/501342
2006 doi
-
[22]
doi:10.1088/1674-4527/17/4/31
Fang, C., Hao, Q., Ding, M.-D., et al.\ 2017, Research in Astronomy and Astrophysics, 17, 031. doi:10.1088/1674-4527/17/4/31
2017 doi
-
[23]
K., Rust, D
Georgoulis, M. K., Rust, D. M., Bernasconi, P. N., et al.\ 2002, , 575, 506. doi:10.1086/341195
2002 doi
-
[24]
V., Carlsson, M., Hansteen, V
Gudiksen, B. V., Carlsson, M., Hansteen, V. H., et al.\ 2011, , 531, A154. doi:10.1051/0004-6361/201116520
2011 doi
-
[25]
H., Archontis, V., Pereira, T
Hansteen, V. H., Archontis, V., Pereira, T. M. D., et al.\ 2017, , 839, 22. doi:10.3847/1538-4357/aa6844
2017 doi
-
[26]
doi:10.1051/0004-6361/201935376
Hansteen, V., Ortiz, A., Archontis, V., et al.\ 2019, , 626, A33. doi:10.1051/0004-6361/201935376
2019 doi
-
[27]
doi:10.1093/pasj/62.4.879
Hashimoto, Y., Kitai, R., Ichimoto, K., et al.\ 2010, , 62, 879. doi:10.1093/pasj/62.4.879
2010 doi
-
[28]
D., Li, Y., et al.\ 2014, , 792, 13
Hong, J., Ding, M. D., Li, Y., et al.\ 2014, , 792, 13. doi:10.1088/0004-637X/792/1/13
2014 doi
-
[29]
D.\ 2017, , 845, 144
Hong, J., Carlsson, M., & Ding, M. D.\ 2017, , 845, 144. doi:10.3847/1538-4357/aa80e3
2017 doi
-
[30]
D.\ 2022, , 661, A77
Hong, J., Carlsson, M., & Ding, M. D.\ 2022, , 661, A77. doi:10.1051/0004-6361/202142839
2022 doi
-
[31]
doi:10.3847/2041-8205/829/2/L30
Hou, Z., Huang, Z., Xia, L., et al.\ 2016, , 829, L30. doi:10.3847/2041-8205/829/2/L30
2016 doi
-
[32]
S., Scullion, E
Huang, Z., Madjarska, M. S., Scullion, E. M., et al.\ 2017, , 464, 1753. doi:10.1093/mnras/stw2469
2017 doi
-
[33]
doi:10.1086/512969
Isobe, H., Tripathi, D., & Archontis, V.\ 2007, , 657, L53. doi:10.1086/512969
2007 doi
-
[34]
doi:10.1038/s42254-021-00419-x
Ji, H., Daughton, W., Jara-Almonte, J., et al.\ 2022, Nature Reviews Physics, 4, 263. doi:10.1038/s42254-021-00419-x
2022 doi
-
[35]
& Rouppe van der Voort, L
Joshi, J. & Rouppe van der Voort, L. H. M.\ 2022, , 664, A72. doi:10.1051/0004-6361/202243051
2022 doi
-
[36]
E., Ichimoto, K., et al.\ 2007, Science, 318, 1594
Katsukawa, Y., Berger, T. E., Ichimoto, K., et al.\ 2007, Science, 318, 1594. doi:10.1126/science.114604
2007 doi
-
[37]
doi:10.1088/0004-637X/810/1/38
Kim, Y.-H., Yurchyshyn, V., Bong, S.-C., et al.\ 2015, , 810, 38. doi:10.1088/0004-637X/810/1/38
2015 doi
-
[38]
N.\ 2016, Kinematics and Physics of Celestial Bodies, 32, 13
Kondrashova, N. N.\ 2016, Kinematics and Physics of Celestial Bodies, 32, 13. doi:10.3103/S0884591316010050
2016 doi
-
[39]
E., Lukin, V
Leake, J. E., Lukin, V. S., Linton, M. G., et al.\ 2012, , 760, 109. doi:10.1088/0004-637X/760/2/109
2012 doi
- [40]
-
[41]
doi:10.1051/0004-6361/201629266
Libbrecht, T., Joshi, J., de la Cruz Rodr \' guez, J., et al.\ 2017, , 598, A33. doi:10.1051/0004-6361/201629266
2017 doi
-
[42]
doi:10.1088/1674-4527/20/10/165
Liu, R.\ 2020, Research in Astronomy and Astrophysics, 20, 165. doi:10.1088/1674-4527/20/10/165
2020 doi
-
[43]
doi:10.1088/1674-4527/acafc3
Liu, M., Ni, L., Cheng, G.-C., et al.\ 2023, Research in Astronomy and Astrophysics, 23, 035006. doi:10.1088/1674-4527/acafc3
2023 doi
-
[44]
doi:10.1093/pasj/60.3.577
Matsumoto, T., Kitai, R., Shibata, K., et al.\ 2008, , 60, 577. doi:10.1093/pasj/60.3.577
2008 doi
-
[45]
doi:10.1111/j.1365-2966.2012.21625.x
Mei, Z., Shen, C., Wu, N., et al.\ 2012, , 425, 2824. doi:10.1111/j.1365-2966.2012.21625.x
2012
-
[46]
L., Sterling, A
Moore, R. L., Sterling, A. C., Hudson, H. S., et al.\ 2001, , 552, 833. doi:10.1086/320559
2001 doi
-
[47]
Murphy, N. A. & Lukin, V. S.\ 2015, , 805, 134. doi:10.1088/0004-637X/805/2/134
2015 doi
-
[48]
J., Shelyag, S., Mathioudakis, M., et al.\ 2013, , 779, 125
Nelson, C. J., Shelyag, S., Mathioudakis, M., et al.\ 2013, , 779, 125. doi:10.1088/0004-637X/779/2/125
2013 doi
-
[49]
doi:10.1063/1.3428553
Ni, L., Germaschewski, K., Huang, Y.-M., et al.\ 2010, Physics of Plasmas, 17, 052109. doi:10.1063/1.3428553
2010 doi
-
[50]
doi:10.1063/1.4736993
Ni, L., Ziegler, U., Huang, Y.-M., et al.\ 2012, Physics of Plasmas, Effects of plasma on the plasmoid instability, 19, 7, 072902. doi:10.1063/1.4736993
2012 doi
-
[51]
doi:10.1088/0004-637X/799/1/79
Ni, L., Kliem, B., Lin, J., et al.\ 2015, , 799, 79. doi:10.1088/0004-637X/799/1/79
2015 doi
-
[52]
I., et al.\ 2016, , 832, 195
Ni, L., Lin, J., Roussev, I. I., et al.\ 2016, , 832, 195. doi:10.3847/0004-637X/832/2/195
2016 doi
- [53]
-
[54]
A., et al.\ 2020, Proceedings of the Royal Society of London Series A, 476, 20190867
Ni, L., Ji, H., Murphy, N. A., et al.\ 2020, Proceedings of the Royal Society of London Series A, 476, 20190867. doi:10.1098/rspa.2019.0867
2020
-
[55]
doi:10.1051/0004-6361/202039239
Ni, L., Chen, Y., Peter, H., et al.\ 2021, , 646, A88. doi:10.1051/0004-6361/202039239
2021 doi
-
[56]
doi:10.1051/0004-6361/202243304
Ni, L., Cheng, G., & Lin, J.\ 2022, , 665, A116. doi:10.1051/0004-6361/202243304
2022 doi
-
[57]
H., N \'o brega-Siverio, D., et al.\ 2020, , 633, A58
Ortiz, A., Hansteen, V. H., N \'o brega-Siverio, D., et al.\ 2020, , 633, A58. doi:10.1051/0004-6361/201936574
2020 doi
- [58]
-
[59]
Pereira, T. M. D. & Uitenbroek, H.\ 2015, , 574, A3. doi:10.1051/0004-6361/201424785
2015 doi
-
[60]
doi:10.1086/423891
Pariat, E., Aulanier, G., Schmieder, B., et al.\ 2004, , 614, 1099. doi:10.1086/423891
2004 doi
-
[61]
doi:10.1051/0004-6361:20067011
Pariat, E., Schmieder, B., Berlicki, A., et al.\ 2007, , 473, 279. doi:10.1051/0004-6361:20067011
2007 doi
-
[62]
V., & Nordlund, A .\ 2006, , 638, 1086
Peter, H., Gudiksen, B. V., & Nordlund, A .\ 2006, , 638, 1086. doi:10.1086/499117
2006 doi
-
[63]
doi:10.1126/science.1255726
Peter, H., Tian, H., Curdt, W., et al.\ 2014, Science, 346, 1255726. doi:10.1126/science.1255726
2014 doi
-
[64]
P., et al.\ 2019, , 628, A8
Peter, H., Huang, Y.-M., Chitta, L. P., et al.\ 2019, , 628, A8. doi:10.1051/0004-6361/201935820
2019 doi
-
[65]
K., et al.\ 2022, , 664, A91
Przybylski, D., Cameron, R., Solanki, S. K., et al.\ 2022, , 664, A91. doi:10.1051/0004-6361/202141230
2022 doi
-
[66]
D., Wang, H., et al.\ 2000, , 544, L157
Qiu, J., Ding, M. D., Wang, H., et al.\ 2000, , 544, L157. doi:10.1086/317310
2000 doi
-
[67]
doi:10.1088/0004-637X/789/2/132
Rempel, M.\ 2014, , 789, 132. doi:10.1088/0004-637X/789/2/132
2014 doi
- [68]
-
[69]
G., et al.\ 2016, , 823, 110
Reid, A., Mathioudakis, M., Doyle, J. G., et al.\ 2016, , 823, 110. doi:10.3847/0004-637X/823/2/110
2016 doi
-
[70]
Rogers, F. J. & Iglesias, C. A.\ 1992, , 79, 507. doi:10.1086/191659
1992 doi
-
[71]
B., et al.\ 2017, , 851, L6
Rouppe van der Voort, L., De Pontieu, B., Scharmer, G. B., et al.\ 2017, , 851, L6. doi:10.3847/2041-8213/aa99dd
2017 doi
-
[72]
Rouppe van der Voort, L. H. M., Joshi, J., Henriques, V. M. J., et al.\ 2021, , 648, A54. doi:10.1051/0004-6361/202040171
2021 doi
-
[73]
Rouppe van der Voort, L. H. M., Joshi, J., & Krikova, K.\ 2024, , 683, A190. doi:10.1051/0004-6361/202348976
2024 doi
-
[74]
J., Vissers, G
Rutten, R. J., Vissers, G. J. M., Rouppe van der Voort, L. H. M., et al.\ 2013, Journal of Physics Conference Series, 440, 012007. doi:10.1088/1742-6596/440/1/012007
2013 doi
-
[75]
Rust, D. M. & Kumar, A.\ 1994, , 155, 69. doi:10.1007/BF00670732
1994 doi
-
[76]
doi:10.1126/science.aaw2796
Samanta, T., Tian, H., Yurchyshyn, V., et al.\ 2019, Science, 366, 890. doi:10.1126/science.aaw2796
2019 doi
-
[77]
doi:10.3847/1538-4357/ab3a4d
Shen, Y., Qu, Z., Yuan, D., et al.\ 2019, , 883, 104. doi:10.3847/1538-4357/ab3a4d
2019 doi
-
[78]
doi:10.1098/rspa.2020.0217
Shen, Y.\ 2021, Proceedings of the Royal Society of London Series A, 477, 217. doi:10.1098/rspa.2020.0217
2021
-
[79]
doi:10.3847/1538-4357/ac37c3
Shen, J., Xu, Z., Li, J., et al.\ 2022, , 925, 46. doi:10.3847/1538-4357/ac37c3
2022 doi
-
[80]
doi:10.3847/0004-637X/824/2/96
Tian, H., Xu, Z., He, J., et al.\ 2016, , 824, 96. doi:10.3847/0004-637X/824/2/96
2016 doi
-
[81]
doi:10.3847/1538-4357/aaa89d
Tian, H., Yurchyshyn, V., Peter, H., et al.\ 2018, , 854, 92. doi:10.3847/1538-4357/aaa89d
2018 doi
-
[82]
Toriumi, S., Katsukawa, Y., & Cheung, M. C. M.\ 2017, , 836, 63. doi:10.3847/1538-4357/836/1/63
2017 doi
- [83]
-
[84]
van Ballegooijen, A. A. & Martens, P. C. H.\ 1989, , 343, 971. doi:10.1086/167766
1989 doi
-
[85]
Vissers, G. J. M., Rouppe van der Voort, L. H. M., & Rutten, R. J.\ 2013, , 774, 32. doi:10.1088/0004-637X/774/1/32
2013 doi
-
[86]
Vissers, G. J. M., Rouppe van der Voort, L. H. M., Rutten, R. J., et al.\ 2015, , 812, 11. doi:10.1088/0004-637X/812/1/11
2015 doi
-
[87]
Vissers, G. J. M., de la Cruz Rodr \' guez, J., Libbrecht, T., et al.\ 2019, , 627, A101. doi:10.1051/0004-6361/201833560
2019 doi
-
[88]
o gler, A., Shelyag, S., Sch \
V \"o gler, A., Shelyag, S., Sch \"u ssler, M., et al.\ 2005, , 429, 335. doi:10.1051/0004-6361:20041507
2005 doi
-
[89]
M., Mart \' nez-Sykora, J., Hansteen, V
Wargnier, Q. M., Mart \' nez-Sykora, J., Hansteen, V. H., et al.\ 2023, , 946, 115. doi:10.3847/1538-4357/acbfb1
2023 doi
-
[90]
doi:10.1038/s41467-022-28269-w
Yan, X., Xue, Z., Jiang, C., et al.\ 2022, Nature Communications, 13, 640. doi:10.1038/s41467-022-28269-w
2022 doi
-
[91]
doi:10.1007/s11207-013-0354-0
Yang, H., Chae, J., Lim, E.-K., et al.\ 2013, , 288, 39. doi:10.1007/s11207-013-0354-0
2013 doi
-
[92]
R., Tian, H., Peter, H., et al.\ 2018, , 214, 120
Young, P. R., Tian, H., Peter, H., et al.\ 2018, , 214, 120. doi:10.1007/s11214-018-0551-0
2018 doi
-
[93]
ascl:1101.006
Ziegler, U.\ 2011, Astrophysics Source Code Library. ascl:1101.006
2011
-
[94]
doi:10.1016/j.cpc.2008.02.017
Ziegler, U.\ 2008, Computer Physics Communications, 179, 227. doi:10.1016/j.cpc.2008.02.017
2008 doi
-
[95]
Zhang, Q. M. & Ni, L.\ 2019, , 870, 113. doi:10.3847/1538-4357/aaf391
2019 doi
-
[96]
& Keppens, R.\ 2022, , 928, 45
Zhao, X. & Keppens, R.\ 2022, , 928, 45. doi:10.3847/1538-4357/ac54a4
2022 doi
Reviewed August 15, 2026 · model on record in the stance chip above.
Discussion (0). Continue with ORCID to comment.