REVIEW 5 major objections 5 minor 40 references
Topology-Aware Volume Fusion for Spectral Computed Tomography via Histograms and Extremum Graph
T0 review · 5 major / 5 minor · reviewed 2026-08-05 · deepseek-v4-flash
Pith's one-line read This paper proposes fusing multi-energy photon-counting CT volumes into one scalar volume by following the main ridge of a 2D joint histogram, so that standard volume rendering and segmentation can see features that no single energy channel
desk verdict A competent topology-guided fusion method for two-energy spectral CT volumes, clearly written and honestly limited, but the abstract overclaims what it retains from the full spectral stack and the evaluation is qualitative. read the letter →
The pith
A machine-rendered reading of the paper's core claim, the machinery that carries it, and where it could break.
The reading
What carries the argument
Extremum graph: the sub-structure of the Morse–Smale complex that records how maxima connect to saddles along ascending separatrices and thereby encodes the ridge structure of the histogram density field. The paper builds this graph on the 2D histogram, weights each maximum–saddle edge by the density drop, forms a minimum spanning tree so all prominent maxima are kept while low-density regions are avoided, extracts the longest simple path (the tree diameter), and fits a cubic B-spline. The fusion itself is the arc-length parameterization: each voxel, with values (V1(t),V2(t)), is projected onto the spline and assigned the normalized arc length, turning a two-dimensional feature coordinate in
What would settle it
Scan a phantom with a known number k of distinct materials across three energy channels, fuse the least-correlated pair, and count the separated peaks in the fused 1D histogram. If fewer than k materials appear as peaks while the third channel separates them, the claim that one pair preserves key material characteristics is refuted. A sharper test compares persistence-ranked maxima of the original 2D histogram with those of the fused field; any high-persistence maximum that vanishes under projection is a concrete, measured loss.
Extended reading notes
Core claim
The central claim is that the dominant joint structure of two co-registered spectral volumes is captured by a single curve through their 2D histogram, and that arc length along that curve is a valid scalar field for the whole volume. The paper computes the Morse–Smale complex of the log-normalized histogram density, builds the extremum graph connecting histogram maxima through saddles, simplifies it with persistence, and takes the longest path of the graph's minimum spanning tree as the main ridge. A B-spline fitted to this path assigns each histogram bin a scalar in [0,1] (or [0,n] for merged branches) by nearest-point projection and normalized arc length; mapping those values back to voxel
Load-bearing premise
The load-bearing premise is that each prominent maximum in the 2D histogram corresponds to a distinct material or tissue, so a path through those maxima preserves the structures that matter; if scatter, noise, or histogram resolution breaks that correspondence, features merge or disappear in the fused volume.
Editorial extensions
If this is right
- Standard 1D transfer functions and segmentation tools built for conventional CT can be applied directly to spectral data, since the fused volume is a single scalar field.
- Features that cannot be separated in any single energy channel can still be separated in the fused volume, because separation happens along the joint-histogram ridge rather than along either axis.
- Multi-branch paths allow one fused volume to encode several material families as contiguous scalar ranges, keeping metal-scatter artifacts distinct from tissue features in the same rendering.
- The fused parameterization can be treated as a 2D transfer function sampled during ray casting, avoiding the need to store and sample all high-resolution input volumes.
Reading between the lines
- A straightforward extension is to build the same argument on n-dimensional histograms from all energy channels, which would remove the current loss of information from discarded volumes; the paper names this as future work.
- The projection step depends only on geometric distance to the spline, so replacing it with a mapping that respects the gradient flow of the density field could reduce the feature overlapping the authors acknowledge in limitations.
- The preservation claim could be quantified by comparing persistence-ranked maxima of the original histogram with those of the fused field; a large persistence drop would indicate exactly which features were lost.
- The method is not specific to CT: any co-registered multimodal volumes whose joint histogram has ridge structure could use the same fusion recipe.
Editorial analysis
A structured set of objections, weighed in public.
Referee Report
Summary. The paper proposes a pipeline for fusing multi-energy photon-counting CT volumes into a single scalar volume. It computes pairwise 2D histograms, selects the least-correlated energy pair, builds the Morse–Smale complex of the histogram density, extracts an extremum graph, finds a longest path (optionally with interactive branches), fits a B-spline, and projects every histogram grid point onto the spline using arc-length parameterization. The resulting parameterized field is mapped back to the spatial domain as a fused volume intended for standard 1D volume rendering and segmentation. The method is demonstrated on a synthetic circular-Gaussian example and two real PCCT datasets (human heart and phantom lamb heart). The central claim is that the fused volume 'retains key structural and material characteristics from the original spectral data' while reducing the data to a single volume.
Significance. If the claims were fully supported, the method would be a practical contribution to PCCT visualization: it offers a topology-aware dimensionality-reduction route from multi-energy volumes to a single scalar field, connecting multivariate transfer function design with standard 1D rendering workflows. The use of extremum graphs and persistence simplification on the joint histogram is a reasonable and potentially useful idea, and the synthetic illustration is clean and instructive. However, the current manuscript does not substantiate the stronger claims: only two of the available energy volumes are actually fused, the evaluation is almost entirely qualitative, several steps require interactive parameter selection, and the synthetic result is partly guaranteed by construction. As presented, the paper is better characterized as an interactive visualization and exploration tool than as a verified information-preserving fusion method.
major comments (5)
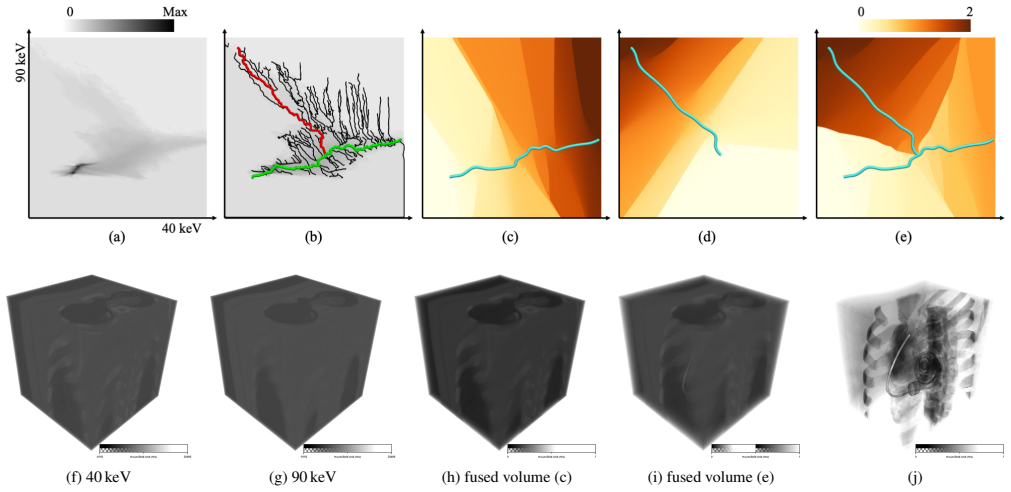
- [Section 6, Eq. (5)] The abstract and Section 4.3 claim the fused volume retains key structural and material characteristics from the original spectral data. However, Eq. (5) defines Vf(t) solely from V1(t) and V2(t), and Section 6 explicitly states 'the information from the remaining volumes is discarded.' The selection of the least-correlated pair (Section 4.1) is a heuristic; no argument or experiment establishes that this pair is information-sufficient. Any two materials whose (V1,V2) bins overlap are mapped to the same or nearby fused values regardless of what a discarded energy channel could distinguish. The evaluation never checks whether features visible only in the non-selected volumes are lost. This unsupported claim is load-bearing and requires either a quantitative test of information sufficiency or a substantial qualification of the paper's claims.
- [Section 5.1, Figure 1] The synthetic Circular Gaussians example is designed so that the 2D histogram consists of eight Gaussian peaks arranged on a circular path; the longest path of the MST passes through every peak by construction. The resulting 1D histogram then shows eight peaks because each peak is projected onto a distinct arc-length interval. This demonstrates the pipeline on data that exactly matches its assumptions, but it does not test behavior when assumptions are violated (e.g., overlapping materials, off-path features, non-Gaussian densities, noise, or histogram resolution changes). The paper's claim that the method preserves features would be strengthened by a synthetic test with ground truth and quantitative feature-preservation metrics, or by a counterexample showing what is lost.
- [Section 5.2, 5.3, Figures 8–10] The real-data evaluation is purely qualitative: volume renderings and 1D histograms are visually compared, with no error bars, no ground-truth segmentation, and no quantitative comparison against existing fusion or dimensionality-reduction baselines (e.g., PCA, Isomap, or earlier transfer-function methods cited in Section 2). Statements such as 'the fused volume increases feature contrast' (Section 5.2) are not backed by measurements. At minimum, the manuscript should report quantitative metrics such as contrast-to-noise ratios of identified structures, overlap with manual or automatic segmentation labels, or preservation of persistence pairs between input and fused fields, and compare with at least one baseline.
- [Section 4.2–4.3, Table 1] The pipeline depends on several manually selected parameters: histogram resolution, persistence threshold, B-spline smoothing factor, spline sample count, and the interactive choice of path endpoints and branches. Table 1 reports only the values used for the presented datasets. No sensitivity analysis is provided, and Sections 4.2 and 6 admit that the automatic longest path often requires interactive refinement. Because the extracted path and hence the fused volume can change qualitatively with these choices, the 'topology-aware' claim is partly a statement about interactive parameter tuning rather than an automatic property of the method. A robustness study across parameter ranges, or an explicit scoping of the claims to interactive exploration, is needed.
- [Section 4.3, Section 5.1] The fused field is defined by projecting histogram points onto a path that was itself extracted from the maxima of that same histogram (Eq. (3), Figure 1). Demonstrating that the fused field separates those maxima is therefore partly by construction: the path was selected precisely to traverse the maxima. For the real datasets, the interactive path selection makes the evaluation additionally self-confirming. The manuscript should acknowledge this circularity and address it, for example by evaluating with independent labels, using an automatic path-selection criterion, or measuring whether the fused field separates features that were not used to guide the path.
minor comments (5)
- [Section 5.2] The sentence 'we selected the histogram corresponding to the 40 keV and 110 keV volumes due to its well-defined structure and visibly prominent features and the lowest correlation of 0.692' is ambiguous. Please clarify whether the pair was selected by the correlation value alone, by visual inspection, or by a combination, and whether the selection was made before or after seeing the corresponding MST/path.
- [Section 4.3] The text says 'sampled densely with 10 6 equally spaced samples'—the exponent appears missing. Also specify whether the 10^6 samples are per branch or across the total spline length.
- [Section 4.2] The assumption that maxima of the histogram represent distinct materials is stated but not justified or referenced. Since this assumption underlies the whole path-extraction step, it deserves an explicit discussion with supporting evidence or a caveat about when it fails.
- [Figure 7(c)] Color consistency in the path overlay could be improved: the MST is described as black, the longest path as green, and maxima/saddles as red/white. Some markers may be difficult to distinguish in a printed grayscale version; consider increasing symbol size or using shapes.
- [Section 6] The discussion of multi-branch fusion mentions 'hard boundaries between points mapped to different branches.' This can create discontinuities in the fused scalar field that affect gradient-based rendering and segmentation. Please discuss the practical consequences and any mitigation, even briefly.
Circularity Check
Fused-field feature preservation is by construction: F is defined as arc length along a path extracted from the histogram's own maxima, and the evaluation counts peaks in the same projected density.
-
self definitional
[Section 4.2 'Graph construction', Section 4.3 'Grid parameterization' (Eq. 3), Section 5.1 'Circular Gaussians']
"The maxima of the histogram are assumed to represent prominent features in the data. Our objective is to extract a path that captures the dominant structure in the histogram while preserving these important features. ... F(p) = ℓp (3) ... This fused volume is expected to preserve the most prominent joint features of the input volumes that lie along the topologically guided path in the histogram space. ... To evaluate whether this fused field captures all significant features, we compute a histogram by aggregating the density values of all grid points projected onto each location along the spli"
The path is built from the MST of the extremum graph whose nodes are the histogram maxima—the features the fused field is claimed to preserve. F(p) is defined as normalized arc length along a spline fitted to that path. Distinct maxima on the path therefore receive distinct F values by construction; 'preservation' is a restatement of the definition, not an empirical consequence. The Section 5.1 evaluation aggregates the original 2D density onto the same spline and counts peaks; since the synthetic Gaussians were placed on the chosen path, recovering eight peaks is guaranteed. In the real-data sections, path selection is interactive, so the user chooses the path that contains the features later shown as 'retained.' Thus the central demonstration of feature preservation reduces to the constr
full rationale
The core pipeline (2D histogram -> extremum graph -> path extraction -> spline projection -> arc-length parameterization) is self-contained, and the topological machinery is implemented with standard external tools (TTK, scipy), not with load-bearing self-citations. No uniqueness theorem is imported from the authors' prior work, and no fitted parameter is masquerading as an independent measurement. However, the paper's central claim that the fused volume 'retains key structural and material characteristics' is not independently validated. The only quantitative demonstration, the synthetic 8-Gaussian example, is definitional: the path is extracted from the histogram's own maxima, and the fused field is the arc-length coordinate along that path, so separating those maxima is guaranteed by construction. The real-data evaluation is also self-confirming because path extraction is interactive. Section 6 openly concedes that discarded volumes may contain unique boundaries and that features off the path may overlap in the fused field, undercutting the abstract's 'maximizing information content' claim, though that is an overstatement rather than a circular derivation. The circularity is real but partial and localized to the feature-preservation demonstration, so a score of 6 is appropriate.
Assumptions & free parameters
free parameters (6)
- Histogram resolution =
1000x1000 (synthetic), 2048x2048 (human heart), 989x989 (phantom lamb heart)
- Persistence threshold =
0.00 (synthetic), 0.15 (heart), 0.10 (phantom)
- Cubic B-spline smoothing factor =
0.01 (synthetic), 0.10 (heart), 0.05 (phantom)
- Selected energy volume pair =
40 and 110 keV (heart), 40 and 90 keV (phantom)
- Interactive path endpoints and branches =
Varies per dataset
- Spline sample count =
10^6
assumptions (5)
- standard math Morse-Smale complex and extremum graph of a piecewise linear scalar field are computed correctly with simulation of simplicity and TTK.
- domain assumption Maxima of the 2D histogram density correspond to specific materials or tissues.
- domain assumption The pair of volumes with lowest correlation best captures both shared and complementary features across all energy levels.
- domain assumption Geometric projection of histogram points onto the nearest spline point preserves the topological order of features.
- domain assumption Logarithmic normalization of histogram bins does not create spurious extrema.
Cite this review
Pith. "Pith review of Topology-Aware Volume Fusion for Spectral Computed Tomography via Histograms and Extremum Graph." pith.science (2026). https://pith.science/paper/KSNGEY7F
@misc{pith2026250814719,
  author       = {Pith},
  title        = {Pith review of: Topology-Aware Volume Fusion for Spectral Computed Tomography via Histograms and Extremum Graph},
  year         = {2026},
  howpublished = {\url{https://pith.science/paper/KSNGEY7F}},
  note         = {Machine review of arXiv:2508.14719}
}
read the original abstract
Photon-Counting Computed Tomography (PCCT) is a novel imaging modality that simultaneously acquires volumetric data at multiple X-ray energy levels, generating separate volumes that capture energy-dependent attenuation properties. Attenuation refers to the reduction in X-ray intensity as it passes through different tissues or materials. This spectral information enhances tissue and material differentiation, enabling more accurate diagnosis and analysis. However, the resulting multivolume datasets are often complex and redundant, making visualization and interpretation challenging. To address these challenges, we propose a method for fusing spectral PCCT data into a single representative volume that enables direct volume rendering and segmentation by leveraging both shared and complementary information across different channels. Our approach starts by computing 2D histograms between pairs of volumes to identify those that exhibit prominent structural features. These histograms reveal relationships and variations that may be difficult to discern from individual volumes alone. Next, we construct an extremum graph from the 2D histogram of two minimally correlated yet complementary volumes-selected to capture both shared and distinct features-thereby maximizing the information content. The graph captures the topological distribution of histogram extrema. By extracting prominent structure within this graph and projecting each grid point in histogram space onto it, we reduce the dimensionality to one, producing a unified volume. This representative volume retains key structural and material characteristics from the original spectral data while significantly reducing the analysis scope from multiple volumes to one. The result is a topology-aware, information-rich fusion of multi-energy CT datasets that facilitates more effective visualization and segmentation.
Figures


Figures from the paper (7 more)



Reference graph
Works this paper leans on
-
[1]
R. Alghamdi, T. M ¨uller, A. Jaspe-Villanueva, M. Hadwiger, and F. Sadlo. Doppler volume rendering: A dynamic, piecewise linear spectral representation for visualizing astrophysics simulations. Com- puter Graphics Forum, 42(3), 2023. 2
work page 2023
-
[2]
A. C. Alves, A. ferreira, G. Luljten, J. Kleeslek, B. Puladi, J. Eg- ger, and V . Alves. Deep PCCT: Photon counting computed tomogra- phy deep learning applications review.arXiv:2402.04301v1 [eess.IV],
-
[3]
A. Ande, V . Subhash, and V . Natarajan. TACHYON: Efficient Shared Memory Parallel Computation of Extremum Graphs. Com- puter Graphics Forum, 42(6):e14784, 2023. doi: 10.1111/cgf.14784 3
-
[4]
U. Ayachit. The ParaView guide, a parallel visualization application. Kitware, 2015. 6
work page 2015
-
[5]
L. Cai, B. P. Nguyen, C.-K. Chui, and S.-H. Ong. A two-level cluster- ing approach for multidimensional transfer function specification in volume visualization. The Visual Computer, 33:163–177, 2017. 2
work page 2017
- [6]
- [7]
-
[8]
Topological persistence and simplification
Edelsbrunner, Letscher, and Zomorodian. Topological persistence and simplification. Discrete & Computational Geometry , 28:511–533,
Show all 40 references
-
[9]
Edelsbrunner and E
H. Edelsbrunner and E. P. M ¨ucke. Simulation of simplicity: a tech- nique to cope with degenerate cases in geometric algorithms. ACM Transactions of Graphics , 9(1):66–104, Jan. 1990. doi: 10.1145/ 77635.77639 3
1990
-
[10]
Engelke, T
W. Engelke, T. B. Masood, J. Beran, R. Caballero, and I. Hotz. Topology-based feature design and tracking for multi-center cyclones. In Topological Methods in Data Analysis and Visualization VI: The- ory, Applications, and Software, pp. 71–85. Springer, 2021. 3
2021
-
[11]
M. Falk, I. Hotz, P. Ljung, D. Treanor, A. Ynnerman, and C. Lund- str¨om. Transfer function design toolbox for full-color volume datasets. In IEEE PacificVis ’17, 2017. 2
2017
-
[12]
Flohr, B
T. Flohr, B. Schmidt, S. Ulzheimer, and H. Alkadhi. Cardiac imaging with photon counting ct. British Journal of Radiology , 96(1152):20230407, 10 2023. doi: 10.1259/bjr.20230407 2
2023 doi
-
[13]
R. Forman. Morse theory for cell complexes. Advances in mathemat- ics, 134(1):90–145, 1998. 4
1998
-
[14]
Greffier, A
J. Greffier, A. Viry, A. Rober, M. Khorsi, and S. Si-Mohamed. Photon- counting ct systems: A technical review of current clinical possibili- ties. Diagnostic and Interventional Imaging, 106:53–59, 2025. 2
2025
-
[15]
Gyulassy, A
A. Gyulassy, A. Knoll, K. C. Lau, B. Wang, P.-T. Bremer, M. E. Papka, L. A. Curtiss, and V . Pascucci. Interstitial and interlayer ion diffusion geometry extraction in graphitic nanosphere battery mate- rials. IEEE Transactions on Visualization and Computer Graphics , 22(1):91...
2016
-
[16]
Haidacher, S
M. Haidacher, S. Bruckner, A. Kanitsar, and E. Gr ¨oller. Information- based transfer functions for multimodal visualization. Eurographics Workshop on Visual Computing for Biomedicine (VCBM), 2008. 2
2008
-
[17]
Heine, H
C. Heine, H. Leitte, M. Hlawitschka, F. Iuricich, L. De Floriani, G. Scheuermann, H. Hagen, and C. Garth. A survey of topology-based methods in visualization. Computer Graphics Forum, 35(3):643–667,
-
[18]
Huang, H
X. Huang, H. Miao, H. Kim, A. Townsend, K. Champley, J. Tringe, V . Pascucci, and P.-T. Bremer. Bimodal visualization of industrial x- ray and neutron computed tomography data. IEEE Transactions on Visualization and Computer Graphics , 31(4):2196–2210, 2025. doi: 10.1109/TVCG....
2025
-
[19]
Jankowai, R
J. Jankowai, R. Sk ˚anberg, D. J¨onsson, A. Ynnerman, and I. Hotz. Ten- sor volume exploration using feature space representatives. In LEVIA 20, 2020. 2
2020
-
[20]
J ¨onsson, P
D. J ¨onsson, P. Steneteg, E. Sund´en, R. Englund, S. Kottravel, M. Falk, A. Ynnerman, I. Hotz, and T. Ropinski. Inviwo – a visualization sys- tem with usage abstraction levels. IEEE Transactions on Visualiza- tion and Computer Graphics, 26(11):3241–3254, 2019. doi: 10.1109/ T...
2019
-
[21]
H. S. Kim, J. P. Schulze, A. C. Cone, G. E. Sosinsky, and M. E. Mar- tone. Dimensionality reduction on multi-dimensional transfer func- tions for multi-channel volume data sets. Information Visualization, 9(3):167–180, 2011. doi: 10.1057/ivs.2010.6 2
2011 doi
-
[22]
Kniss, G
J. Kniss, G. Kindlmann, and C. Hansen. Multidimensional transfer functions for interactive volume rendering. IEEE Transactions on Visualization and Computer Graphics , 8(3):270–285, 2002. doi: 10 .1109/TVCG.2002.1021579 2
2002 arXiv
-
[23]
Konst, L
B. Konst, L. Ohlsson, L. Henriksson, M. Sandstedt, A. Persson, and T. Ebbers. Optimization of photon counting CT for cardiac imaging in patients with left ventricular assist devices: An in-depth assessment of metal artifacts. Journal of Applied Clinical Medical Physics, 25, 05
-
[24]
S. Liu, B. Wang, J. J. Thiagarajan, P.-T. Bremer, and V . Pascucci. Mul- tivariate volume visualization through dynamic projections. In IEEE Symposium on Large Data Analysis and Visualization (LDAV), 2014. doi: 10.1109/LDA V.2014.7013202 2
2014
-
[25]
Ljung, J
P. Ljung, J. Kr ¨uger, E. Gr ¨oller, M. Hadwiger, C. D. Hansen, and A. Ynnerman. State of the art in transfer functions for direct volume rendering. Computer Graphics Forum, 35(3):23, 2016. 2
2016
-
[27]
Nilsson, J
E. Nilsson, J. Lukasczyk, W. Engelke, T. B. Masood, G. Svensson, R. Caballero, C. Garth, and I. Hotz. Exploring cyclone evolution with hierarchical features. In Topological Data Analysis and Visualization (TopoInVis), pp. 92–102. IEEE, 2022. 3
2022
-
[28]
Noordmans, H
H. Noordmans, H. van der V oort, and A. Smeulders. Spectral volume rendering. IEEE Transactions on Visualization and Computer Graph- ics (TVCG) , 6(3):196–207, 2000. doi: doi:10.1109/2945.879782. 2 2
-
[29]
Pandey, T
K. Pandey, T. Bin Masood, S. Singh, I. Hotz, V . Natarajan, and T. G. Murthy. Morse theory-based segmentation and fabric quantification of granular materials. Granular Matter, 24(1):27, Dec 2021. doi: 10. 1007/s10035-021-01182-7 3
2021
-
[30]
Shivashankar, P
N. Shivashankar, P. Pranav, V . Natarajan, R. v. d. Weygaert, E. P. Bos, and S. Rieder. Felix: A topology based framework for visual explo- ration of cosmic filaments. IEEE Transactions on Visualization and Computer Graphics , 22(6):1745–1759, 2016. doi: 10.1109/TVCG. 2015.2452919 3
2016
-
[31]
T. Sousbie. The persistent cosmic web and its filamentary structure–i. theory and implementation. Monthly Notices of the Royal Astronomi- cal Society, 414(1):350–383, 2011. 3
2011
-
[32]
Strengert, T
M. Strengert, T. Klein, R. Botchen, S. Stegmaier, M. Chen, and T. Ertl. Spectral volume rendering using GPU-based raycasting. The Visual Computer, 22(8):550–561, 2006. doi: 10.1007/s00371-006-0028-0 2
2006 doi
-
[33]
Tierny, G
J. Tierny, G. Favelier, J. A. Levine, C. Gueunet, and M. Michaux. The Topology ToolKit.IEEE Transactions on Visualization and Computer Graphics, 24(1):832–842, 2018. doi: 10.1109/TVCG.2017.2743938 4, 6
2018
-
[34]
van der Bie, M
J. van der Bie, M. van Straten, R. Booij, D. Bos, M. L. Dijkshoorn, A. Hirsch, S. P. Sharma, E. H. Oei, and R. P. Budde. Photon-counting CT: Review of initial clinical results. European Journal of Radiology, 163:110829, 2023. doi: doi.org/10.1016/j.ejrad.2023.110829 2
2023
-
[35]
Y . Wang, J. Zhang, D. J. Lehmann, H. Theisel, and X. Chi. Automat- ing transfer function design with valley cell-based clustering of 2D density plots. Computer Graphics Forum, 31(3), 2012. 2
2012
-
[36]
X. Wu, P. He, Z. Long, X. Guo, M. Chen, X. Ren, P. Chen, L. Deng, K. An, P. Li, B. Wei, and P. Feng. Multi-material decomposition of spectral CT images via fully convolutional DenseNets. Journal of X- Ray Sciences and Technology, 27:461–471, 2019. doi: DOI 10.3233/ XST-190500 2
2019
-
[37]
L. Yan, T. B. Masood, R. Sridharamurthy, F. Rasheed, V . Natara- jan, I. Hotz, and B. Wang. Scalar field comparison with topologi- cal descriptors: Properties and applications for scientific visualization. Computer Graphics Forum, 40(3):599–633, 2021. doi: 10.1111/cgf. 14331 3
2021 doi
-
[38]
Zhao and A
X. Zhao and A. E. Kaufman. Multi-dimensional reduction and transfer function design using parallel coordinates. In IEEE/EG International conference on Volume Graphics, pp. 69–76, 2010. 2
2010
-
[2011]
doi: 10.1109/TVCG.2011.244 3
2011 doi
-
[2016]
doi: 10.1111/cgf.12933 3
-
[2024]
doi: 10.1002/acm2.14386 8
Reviewed August 5, 2026 · model on record in the stance chip above.
Discussion (0). Sign in to comment.