REVIEW 3 major objections 5 minor 50 references
Non-parametric Causal Discovery for EU Allowances Returns Through the Information Imbalance
T0 review · 3 major / 5 minor · reviewed 2026-08-05 · deepseek-v4-flash
Pith's one-line read A rank-based metric finds the same EUA drivers as Granger tests, plus the nonlinear ones Granger misses.
desk verdict The empirical headline doesn't follow from the paper's own equations—the sign in the Imbalance Gain is inverted, so the positive IGs in Section 4 cannot be produced by Eq. (9)/(11). read the letter →
The pith
A machine-rendered reading of the paper's core claim, the machinery that carries it, and where it could break.
The reading
What carries the argument
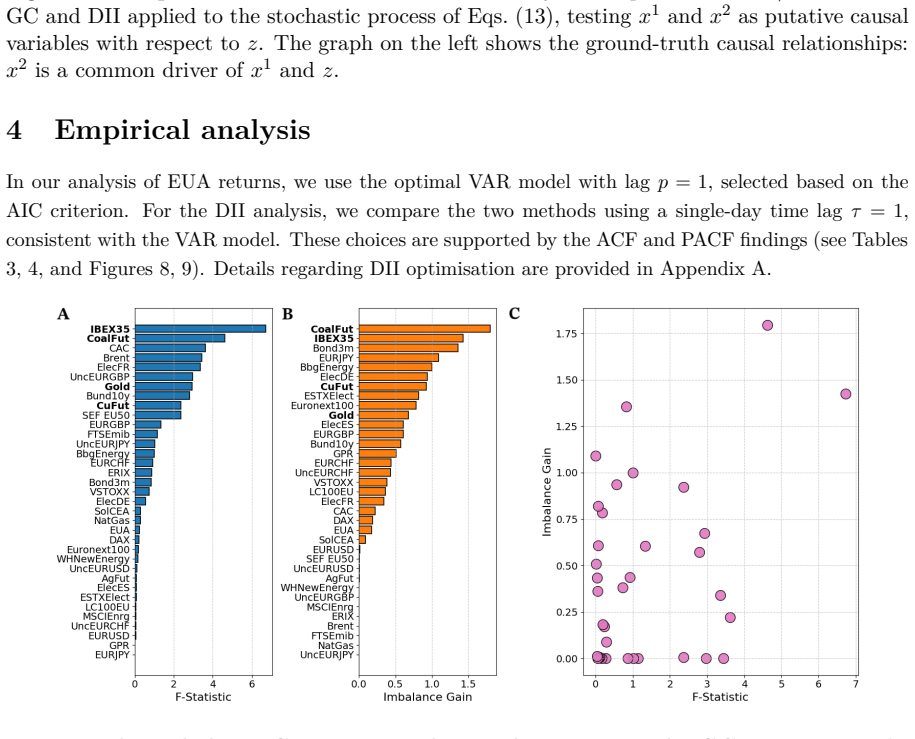
The central object is the Differentiable Information Imbalance (DII), a rank-based, gradient-optimised measure of how well distances in a weighted predictor space reproduce neighbourhood structure in a target space. Its causal variant, the Imbalance Gain (IG), quantifies how much adding a candidate variable to the predictor set improves prediction of the target one day ahead; a positive IG means the variable carries causal information. The DII carries the argument by being non-parametric, requiring no distributional or linearity assumptions, and by giving each variable a single optimised weight comparable to VAR coefficients, which enables a one-to-one comparison with Granger causality.
What would settle it
Rebuild the DII and Granger analysis on a dataset that adds a plausible measured confounder, such as European industrial production or natural gas prices; if the IBEX35/coal-futures causal weights vanish, then the paper's claimed direct causal effects are confounded.
Extended reading notes
Core claim
The paper's central empirical claim is that IBEX35 and coal futures are robust causal drivers of EUA returns, detected by both a linear VAR/Granger approach and the non-linear, model-free DII approach. The authors further claim that, where the two methods disagree, the differences stem from known limitations of linear causality: on synthetic data, multivariate Granger tests fail to detect a quadratic causal coupling (a false negative) and detect a spurious causal link transmitted through a non-linear common driver (a false positive), while the DII-based Imbalance Gain detects the true structure in both cases. The paper therefore proposes the Imbalance Gain as a non-linear analogue of the Gra
Load-bearing premise
The analysis assumes causal sufficiency—that no unobserved variable drives both EUA returns and the predictors in the dataset; the authors openly note this is likely false because factors like risk aversion and policy expectations are unmeasured.
Editorial extensions
If this is right
- EUA return modelling should treat IBEX35 and coal futures as the primary market variables to monitor, since both a linear and a non-linear method independently flag them.
- DII-based Imbalance Gain can flag non-linear causal links that Granger F-tests systematically miss, reducing false negatives relative to VAR-only analysis.
- Where linear methods create a spurious causal link through a non-linear common driver, DII/IG can avoid that false positive.
- Agreement between DII and VAR on a set of drivers can be used as a validation step before committing to a Granger causality conclusion.
- Until resampling-based significance tests are developed, DII causal rankings should be used alongside linear statistical tests rather than alone.
Reading between the lines
- If DII's non-linear advantage generalises, existing Granger/VAR-based spillover studies of carbon and energy markets may undercount crisis-time transmission, because those links can be quadratic or threshold-shaped.
- The same pipeline could be transferred directly to other compliance carbon markets, such as the UK ETS or California allowances, where the same non-linearity problem in price formation applies.
- A testable extension is to compute IG at lags greater than one day: coal futures may lead EUA returns at a horizon that the paper's τ = 1 analysis does not examine.
- Because IG currently lacks a significance threshold, a practical selection rule could be built by permuting predictor labels; the paper itself proposes resampling techniques as future work.
Editorial analysis
A structured set of objections, weighed in public.
Referee Report
Summary. The paper proposes the Differentiable Information Imbalance (DII) as a non-parametric, potentially non-linear method for causal discovery in financial time series, and applies it to EUA (European Union Allowance) returns over January 2013–April 2024. It compares DII-based Imbalance Gain (IG) rankings with multivariate Granger causality from a VAR(1) model, and reports that both methods identify IBEX35 and Coal Futures as important drivers of EUA returns. Two synthetic datasets are used to show that linear Granger causality can miss non-linear causal links and can produce false positives when a non-linear common driver is present.
Significance. If the empirical claims hold, the paper would contribute a non-linear, non-parametric complement to standard Granger-causal analysis of carbon markets, and the overlap with VAR results would strengthen confidence in IBEX35 and coal futures as robust predictors of EUA returns. The paper also provides reproducible code and clearly describes the DII optimization procedure. However, a sign inconsistency in the central IG definition currently undermines the reported positive IG values, so the empirical ranking and the headline overlap claim cannot be accepted without correction. The synthetic illustrations are suggestive but are presented as single-run demonstrations without uncertainty quantification. With a corrected definition and appropriate robustness checks, the contribution could be useful to the q-fin.CP community.
major comments (3)
- [§3.2.2, Eqs. (8)–(11)] The Imbalance Gain is defined in Eq. (9) as IG = 1 − Δ(z0→zτ) / min_w Δ([w x0,z0]→zτ). Since smaller Δ means better predictability, the causal condition in Eq. (8) is min_w Δ([w x0,z0]→zτ) < Δ(z0→zτ). Under Eq. (9) this inequality makes the ratio greater than 1, so IG < 0, not IG > 0 as claimed. The multivariate version Eq. (11) has the same inversion: the numerator is the DII without xα and the denominator is the DII with xα, so a genuine causal variable yields a negative IG. Consequently, the positive IGs reported in Figures 4–6 for true causes cannot be produced by the formula as written. Either the equations are mis-specified or the code uses the inverse ratio. This is load-bearing because the entire empirical ranking and the paper's central overlap claim rest on IG. Please correct the definition and verify which quantity was actually computed.
- [§4 and Appendix A] The empirical IG values are presented as evidence of causal effects, but no significance threshold, confidence interval, or null distribution is provided. The authors acknowledge in §6 that DII lacks a simple significance test, yet the conclusion states that both methods 'detect significant causal effects' from IBEX35 and Coal Futures. Given that the DII optimization involves stochastic mini-batches and multiple hyperparameters, a bootstrap or permutation test is needed to distinguish non-zero IG from noise. Without such a test, the empirical overlap between DII and Granger rankings cannot be regarded as statistically supported.
- [§3.3 and Appendix A] The synthetic demonstrations are single-run experiments with no repeated seeds, error bars, or sensitivity analysis. The DII training uses random mini-batches and Adam optimization, so the reported weights and IGs could vary across runs. Claims such as 'the DII approach appears robust against this drawback' (Section 3.3.2) are not supported without repeated-seed statistics. Additionally, the key hyperparameters — the 0.1 prefactor in Eq. (14), the 5% neighbourhood fraction, the mini-batch size, the temporal exclusion window, and the number of epochs — are fixed without sensitivity analysis. At minimum, show stability of the synthetic conclusions across seeds and across reasonable hyperparameter perturbations.
minor comments (5)
- [Introduction, Section 1] The text 'heavAC100 per tonne' appears to be a typo; presumably '€100 per tonne' is intended.
- [Table 2] The columns in Table 2 appear misaligned or garbled: for example, the EUA row shows Max = -0.0143 and 25% = 0.0010, which are inconsistent with the other rows and with the text. Please reformat and verify all entries.
- [Section 4, Figure 6] The text says 'In the first panel, the IG highlights...' but the left panel of Figure 6 is labelled as F-statistics and the central panel as IG. The wording should refer to the correct panel.
- [References] Reference [1] is listed as 'Phys. Rev. Lett., pages –, Jun 2025' with no volume/article number; please complete the citation. Reference [20] appears to be an unpublished manuscript; if it is not accepted or posted, please mark it clearly.
- [Appendix A] The neighbourhood parameter k is first described as 5% of the points and later as 5 points in each mini-batch of size 100. This is consistent (5% of 100), but the wording could be clarified to avoid confusion.
Circularity Check
No significant circularity: the DII method is imported from prior same-group work, but the EUA empirical target is new and the causal findings are not encoded in the method's equations.
full rationale
The paper's central empirical claim — that IBEX35 and Coal Futures show causal effects on EUA returns — is obtained by applying two independent methods (VAR/Granger and DII) to a 35-variable return dataset. Nothing in the DII equations or in the VAR is fitted to the empirical conclusion; the result emerges from the data. The DII and IG are indeed taken from earlier papers with substantial author overlap ([28], [21], [49], [1], [42]), and Sec. 1.2 frames the contribution as extending that prior II-based study to EUA returns. This is self-citation, but it is not load-bearing in the sense of reducing the empirical result to the cited method's construction: the method is a tool, not a theorem that asserts IBEX35 or CoalFut must be causes. The synthetic datasets in Sec. 3.3 are author-constructed, but they are used as ground-truth checks with known equations; the method is not fitted to those labels. The paper also explicitly flags the causal-sufficiency assumption as 'most likely not satisfied in practice' (Sec. 1.2), which is a confounding limitation rather than a circular step. A separate internal-consistency concern exists in Eqs. (8)–(9) and (11): if DII decreases with added predictive information, then the inequality in Eq. (8) makes the fraction in Eq. (9) greater than 1, implying IG<0, while the text asserts equivalence to IG>0. That is a correctness/implementation issue, not a circularity, and should be resolved by checking the public repository; it does not make the empirical claim an input to the method. Overall, no derivation step reduces to its own inputs, so circularity is minimal.
Assumptions & free parameters
free parameters (4)
- DII neighbourhood scale parameter lambda =
lambda_i = 0.1 * d^2_{ij(k)}, k = 5% of points
- DII training hyperparameters =
2000 epochs, Adam, initial lr 1e-3, cosine decay, 28 mini-batches of N'=100
- Time-lag tau for DII and VAR lag p =
tau = 1, p = 1 (AIC optimal)
- Temporal exclusion window =
financial data [t-1, t+1], synthetic [t-5, t+5]
assumptions (5)
- domain assumption Causal sufficiency: no unmeasured confounder of EUA and the predictors
- domain assumption One-day temporal resolution is sufficient for causal effects to appear at tau=1
- domain assumption Return series are stationary and sampled frames are approximately independent
- standard math Gaussian white noise in the VAR model for F-statistic validity
- ad hoc to paper DII optimization reaches a representative global minimum
Cite this review
Pith. "Pith review of Non-parametric Causal Discovery for EU Allowances Returns Through the Information Imbalance." pith.science (2026). https://pith.science/paper/WT6KFOQI
@misc{pith2026250815667,
  author       = {Pith},
  title        = {Pith review of: Non-parametric Causal Discovery for EU Allowances Returns Through the Information Imbalance},
  year         = {2026},
  howpublished = {\url{https://pith.science/paper/WT6KFOQI}},
  note         = {Machine review of arXiv:2508.15667}
}
read the original abstract
We propose to use a recently introduced non-parametric tool named Differentiable Information Imbalance (DII) to identify variables that are causally related -- potentially through non-linear relationships -- to the financial returns of the European Union Allowances (EUAs) within the EU Emissions Trading System (EU ETS). We examine data from January 2013 to April 2024 and compare the DII approach with multivariate Granger causality, a well-known linear approach based on VAR models. We find significant overlap among the causal variables identified by linear and non-linear methods, such as the coal futures prices and the IBEX35 index. We also find important differences between the two causal sets identified. On two synthetic datasets, we show how these differences could originate from limitations of the linear methodology.
Figures


Figures from the paper (6 more)




Reference graph
Works this paper leans on
-
[1]
Linear scaling causal discovery from high-dimensional time series by dynamical community detection
Matteo Allione, Vittorio Del Tatto, and Alessandro Laio. Linear scaling causal discovery from high-dimensional time series by dynamical community detection. Phys. Rev. Lett. , pages –, Jun 2025
work page 2025
-
[2]
The yield spread and bond return predictability in expansions and recessions
Martin M Andreasen, Tom Engsted, Stig V Møller, and Magnus Sander. The yield spread and bond return predictability in expansions and recessions. The Review of Financial Studies , 34(6):2773– 2812, 09 2020
work page 2020
-
[3]
Aydin Aslan and Peter N. Posch. Does carbon price volatility affect european stock market sectors? a connectedness network analysis.Finance Research Letters, 50, 2022
work page 2022
-
[4]
Transfer Entropy Analysis of the Stock Market
Seung Ki Baek, Beom Jun Kim, and Hawoong Lee. Transfer entropy analysis of the stock market. arXiv preprint physics/0509014 , 2005
work page Pith review arXiv 2005
-
[5]
Baker, Nicholas Bloom, and Steven J
Scott R. Baker, Nicholas Bloom, and Steven J. Davis. Measuring Economic Policy Uncertainty*. The Quarterly Journal of Economics , 131(4):1593–1636, 07 2016
work page 2016
-
[6]
Lionel Barnett, Adam B Barrett, and Anil K Seth. Granger causality and transfer entropy are equivalent for gaussian variables.Physical Review Letters, 103(23):238701, 2009
work page 2009
-
[7]
Barrett, Lionel Barnett, and Anil K
Adam B. Barrett, Lionel Barnett, and Anil K. Seth. Multivariate granger causality and generalized variance. Phys. Rev. E , 81:041907, Apr 2010
work page 2010
-
[8]
Christiane Baumeister and Lutz Kilian. Forty years of oil price fluctuations: Why the price of oil may still surprise us.Journal of Economic Perspectives , 30(1):139–60, February 2016
work page 2016
Show all 50 references
-
[9]
Emission abatement: Untangling the impacts of the eu ets and the economic crisis
Germà Bel and Stephan Joseph. Emission abatement: Untangling the impacts of the eu ets and the economic crisis. Energy Economics, 49:531–539, 2015
2015
-
[10]
Blinowska, Rafał Kuś, and Maciej Kamiński
Katarzyna J. Blinowska, Rafał Kuś, and Maciej Kamiński. Granger causality and information flow in multivariate processes.Phys. Rev. E , 70:050902, Nov 2004
2004
-
[11]
With or without u(k): A pre-brexit network analysis of the eu ets
Simone Borghesi and Andrea Flori. With or without u(k): A pre-brexit network analysis of the eu ets. PLOS ONE, 14(9), 09 2019
2019
-
[12]
An emerging equilibrium in the eu emissions trading scheme.Energy Economics, 33(2):353 – 362, 2011
Don Bredin and Cal Muckley. An emerging equilibrium in the eu emissions trading scheme.Energy Economics, 33(2):353 – 362, 2011
2011
-
[13]
Environmental policy and directed technological change: Evidence from the european carbon market
Raphael Calel and Antoine Dechezleprêtre. Environmental policy and directed technological change: Evidence from the european carbon market. Review of Economics and Statistics , 94(4):918–938, 2012
2012
-
[14]
Effectivetransferentropyincreditmarkets
AliceCaseriniandPaoloPagnottoni. Effectivetransferentropyincreditmarkets. Statistical Methods & Applications, 31:1103–1131, 2022
2022
-
[15]
Volatility spillovers and causality of carbon emissions, oil and coal spot and futures for the eu and usa.Sustainability, 9(10), 2017
Chia-Lin Chang, Michael McAleer, and Guangdong Zuo. Volatility spillovers and causality of carbon emissions, oil and coal spot and futures for the eu and usa.Sustainability, 9(10), 2017
2017
-
[16]
Detecting instability in the volatility of carbon prices.Energy Economics, 33(1):99 – 110, 2011
Julien Chevallier. Detecting instability in the volatility of carbon prices.Energy Economics, 33(1):99 – 110, 2011
2011
-
[17]
On the realized volatility of the ecx co2 emissions 2008 futures contract: Distribution, dynamics and forecasting.Annals of Finance, 7(1):1 – 29, 2011
Julien Chevallier and Benoît Sévi. On the realized volatility of the ecx co2 emissions 2008 futures contract: Distribution, dynamics and forecasting.Annals of Finance, 7(1):1 – 29, 2011
2008
-
[18]
Modeling and explaining the dynamics of european union allowance prices at high-frequency.Energy Economics, 34(1):316 – 326, 2012
Christian Conrad, Daniel Rittler, and Waldemar Rotfuß. Modeling and explaining the dynamics of european union allowance prices at high-frequency.Energy Economics, 34(1):316 – 326, 2012. 20
2012
-
[19]
Empirical properties of asset returns: stylized facts and statistical issues.Quantitative Finance, 1(2):223, mar 2001
Rama Cont. Empirical properties of asset returns: stylized facts and statistical issues.Quantitative Finance, 1(2):223, mar 2001
2001
-
[20]
Towards a robust approach to infer causality in molecular systems satisfying detailed balance, 2025
Vittorio Del Tatto, Debarshi Banerjee, Ali Hassanali, and Alessandro Laio. Towards a robust approach to infer causality in molecular systems satisfying detailed balance, 2025
2025
-
[21]
Robust inference of causality in high-dimensional dynamical processes from the information imbalance of distance ranks
Vittorio Del Tatto, Gianfranco Fortunato, Domenica Bueti, and Alessandro Laio. Robust inference of causality in high-dimensional dynamical processes from the information imbalance of distance ranks. Proceedings of the National Academy of Sciences , 121(19):e2317256121, 2024
2024
-
[22]
Diebold and Canlin Li
Francis X. Diebold and Canlin Li. Forecasting the term structure of government bond yields.Journal of Econometrics, 130(2):337–364, 2006
2006
-
[23]
Diebold and Kamil Yilmaz
Francis X. Diebold and Kamil Yilmaz. Better to give than to receive: Predictive directional mea- surement of volatility spillovers.International Journal of Forecasting , 28(1):57–66, 2012
2012
-
[24]
A new statistic and practical guidelines for nonparametric granger causality testing.Journal of Economic Dynamics and Control , 30(9-10):1647–1669, 2006
Cees Diks and Valentyn Panchenko. A new statistic and practical guidelines for nonparametric granger causality testing.Journal of Economic Dynamics and Control , 30(9-10):1647–1669, 2006
2006
-
[25]
Robert F. Engle. Autoregressive conditional heteroskedasticity with estimates of the variance of united kingdom inflation. Econometrica, 50(4):987–1007, 1982
1982
-
[26]
Impact of economic crises on emissions and eu allowances, 2022
European Central Bank. Impact of economic crises on emissions and eu allowances, 2022. Accessed: 2024-11-28
2022
-
[27]
Dadapy: Distance-based analysis of data-manifolds in python
Aldo Glielmo, Iuri Macocco, Diego Doimo, Matteo Carli, Claudio Zeni, Romina Wild, Maria d’Errico, Alex Rodriguez, and Alessandro Laio. Dadapy: Distance-based analysis of data-manifolds in python. Patterns, 3(10), 2022
2022
-
[28]
Ranking the information content of distance measures.PNAS nexus, 1(2):pgac039, 2022
Aldo Glielmo, Claudio Zeni, Bingqing Cheng, Gábor Csányi, and Alessandro Laio. Ranking the information content of distance measures.PNAS nexus, 1(2):pgac039, 2022
2022
-
[29]
C. W. J. Granger. Investigating causal relations by econometric models and cross-spectral methods. Econometrica, 37(3):424–438, 1969
1969
-
[30]
Time Series Analysis
James Douglas Hamilton. Time Series Analysis . Princeton University Press, 1994
1994
-
[31]
David A. Hsieh. Chaos and nonlinear dynamics: Application to financial markets.The Journal of Finance, 46(5):1839–1877, 1991
1991
-
[32]
Information linkage, dynamic spillovers in prices and volatility between the carbon and energy markets.Journal of Cleaner Production , 198:972 – 978, 2018
Qiang Ji, Dayong Zhang, and Jiang-bo Geng. Information linkage, dynamic spillovers in prices and volatility between the carbon and energy markets.Journal of Cleaner Production , 198:972 – 978, 2018
2018
-
[33]
What happens to the relationship between eu allowances prices and stock market indices in europe?Energy Economics, 81:13–24, 2019
Rebeca Jiménez-Rodríguez. What happens to the relationship between eu allowances prices and stock market indices in europe?Energy Economics, 81:13–24, 2019
2019
-
[34]
Price and network dynamics in the euro- pean carbon market
Andreas Karpf, Antoine Mandel, and Stefano Battiston. Price and network dynamics in the euro- pean carbon market. Journal of Economic Behavior & Organization , 153:103–122, 2018
2018
-
[35]
Kingma and Jimmy Ba
Diederik P. Kingma and Jimmy Ba. Adam: A method for stochastic optimization, 2017
2017
-
[36]
Speculative influence network during financial bubbles: application to chinese stock markets.Journal of Economic Interaction and Coordination , 13(2):385–431, 2018
Lin Li and Didier Sornette. Speculative influence network during financial bubbles: application to chinese stock markets.Journal of Economic Interaction and Coordination , 13(2):385–431, 2018
2018
-
[37]
Linear and non- linear causality in financial markets.Chaos, 34(11):113125, 2024
Haochun Ma, Davide Prosperino, Alexander Haluszczynski, and Christoph Räth. Linear and non- linear causality in financial markets.Chaos, 34(11):113125, 2024. 21
2024
-
[38]
Geopolitical, economic risk and the time- varyingstructureofextremeriskinthecarbonemissionstradingmarket
Junlong Mi, Xing Yang, Feifei Huang, and Yufa Xu. Geopolitical, economic risk and the time- varyingstructureofextremeriskinthecarbonemissionstradingmarket. Frontiers in Environmental Science, 12, 2024
2024
-
[39]
European Parliament and the Council of the European Union. Directive 2003/87/ec of the european parliament and of the council establishing a scheme for greenhouse gas emission allowance trading within the community and amending council directive 96/61/ec, 2003. Accessed: 2024-11-17
2003
-
[40]
How do carbon, stock, and renewable energy markets interact: Evidence from europe.Journal of Cleaner Production , 407:137106, 2023
Lixin Qiu, Lijun Chu, Ran Zhou, Haitao Xu, and Sai Yuan. How do carbon, stock, and renewable energy markets interact: Evidence from europe.Journal of Cleaner Production , 407:137106, 2023
2023
-
[41]
J. Runge. Causal network reconstruction from time series: From theoretical assumptions to practical estimation. Chaos: An Interdisciplinary Journal of Nonlinear Science , 28(7):075310, 07 2018
2018
-
[42]
Investigating the price determinants of the european emission trading system: a non-parametric approach.Quanti- tative Finance, 24(10):1529–1544, 2024
Cristiano Salvagnin, Aldo Glielmo, Maria Elena De Giuli, and Antonietta Mira. Investigating the price determinants of the european emission trading system: a non-parametric approach.Quanti- tative Finance, 24(10):1529–1544, 2024
2024
-
[43]
Measuring information transfer.Phys
Thomas Schreiber. Measuring information transfer.Phys. Rev. Lett., 85:461–464, Jul 2000
2000
-
[44]
Macroeconomicsandreality
ChristopherASims. Macroeconomicsandreality. Econometrica: journal of the Econometric Society , pages 1–48, 1980
1980
-
[45]
Detecting causality in complex ecosystems.Science, 338(6106):496–500, 2012
George Sugihara, Robert May, Hao Ye, Chih-hao Hsieh, Ethan Deyle, Michael Fogarty, and Stephan Munch. Detecting causality in complex ecosystems.Science, 338(6106):496–500, 2012
2012
-
[46]
Tay and L.J
Francis E.H. Tay and L.J. Cao. Modified support vector machines in financial time series forecasting. Neurocomputing, 48(1):847–861, 2002
2002
-
[47]
Luis M. Viceira. Bond risk, bond return volatility, and the term structure of interest rates.Interna- tional Journal of Forecasting, 28(1):97–117, 2012. Special Section 1: The Predictability of Financial Markets Special Section 2: Credit Risk Modelling and Forecasting
2012
-
[48]
Using egarch models to predict volatility in unconsolidated financial markets: the case of european carbon al- lowances
Elena Villar-Rubio, María-Dolores Huete-Morales, and Federico Galán-Valdivieso. Using egarch models to predict volatility in unconsolidated financial markets: the case of european carbon al- lowances. Journal of Environmental Studies and Sciences , 13(3):500 – 509, 2023
2023
-
[49]
Automatic feature selection and weighting in molecular systems using differentiable information imbalance
RominaWild, FelixWodaczek, VittorioDelTatto, BingqingCheng, andAlessandroLaio. Automatic feature selection and weighting in molecular systems using differentiable information imbalance. Nature Communications, 16, 01 2025
2025
-
[50]
The dynamic volatility spillover between european carbon trading market and fossil energy market.Journal of Cleaner Production , 112:2654–2663, 2016
Yue-Jun Zhang and Ya-Fang Sun. The dynamic volatility spillover between european carbon trading market and fossil energy market.Journal of Cleaner Production , 112:2654–2663, 2016. A Details on the DII optimisation We report in this section technical details about the DII opti...
2016
Reviewed August 5, 2026 · model on record in the stance chip above.
Discussion (0). Continue with ORCID to comment.