REVIEW 3 major objections 4 minor 6 references
Glimmers in the Cosmic Dawn. III. On the Photometrically Determined Black Hole Mass to Stellar Mass Relation Across Cosmic Time
T0 review · 3 major / 4 minor · reviewed 2026-08-05 · deepseek-v4-flash
Pith's one-line read Photometric-only SED fitting places black holes in the mass–redshift plane and finds that high-redshift active galaxies host increasingly overmassive black holes relative to their stellar mass, matching JWST broad-line results without using
desk verdict A promising new photometric BH mass method, but the high-z overmassive trend is built on sources that fail the paper's own AGN criterion. read the letter →
The pith
A machine-rendered reading of the paper's core claim, the machinery that carries it, and where it could break.
The reading
What carries the argument
A bespoke SED decomposition code that fits 26 HST+JWST photometric points per source with only seven free parameters: stellar age, star-formation e-folding time, stellar normalization, metallicity, diffuse reddening, AGN normalization, and nuclear reddening. Stellar spectra come from Bruzual & Charlot (2003) population synthesis as implemented in bagpipes; the AGN spectrum is the semi-empirical quasar template of Temple et al. (2021). Model selection uses AIC and an AGN fraction threshold, and masses come from the Kaspi et al. (2000) L5100–MBH relation applied to the reconstructed AGN spectrum.
What would settle it
Measure rest-frame optical broad lines (Hα or Hβ) for the 26 AGN-fraction-selected sources and compute virial masses using local relations; if the high-z sources follow the local MBH–M* relations rather than the overmassive offset, the photometric trend is a calibration artifact. Alternatively, a reverberation-mapping campaign on a few of the brightest sources at z≈1–2 would directly test the L5100–MBH relation outside its calibration domain.
Extended reading notes
Core claim
Using photometry alone, the paper claims, black holes in the nuclei of faint AGN can be weighed and placed in the MBH–M* plane. For 26 of 121 variables, the custom SED fitter finds that a semi-empirical AGN template contributes at least 20% of the flux in one filter, and from those fits the 5100Å luminosity gives masses via the Kaspi et al. (2000) scaling. The recovered masses grow more overmassive relative to the host stellar mass as redshift increases, matching the offset reported by JWST broad-line studies; two z<1 dwarf galaxies also host overmassive intermediate-mass black holes. The highest-redshift object, at zphot=6.74, requires log MBH > 7.36 and is consistent with a light seed accr
Load-bearing premise
The Kaspi et al. (2000) relation between 5100Å luminosity and black hole mass — calibrated on bright, z<1 reverberation-mapped AGN — is assumed to hold exactly, in shape and normalization, for the much fainter and higher-redshift sources in this sample; this assumption sets every reported black hole mass.
Editorial extensions
If this is right
- Independent confirmation that overmassive black holes at high redshift are not a quirk of broad-line virial estimators.
- Photometric MBH estimation extends black hole mass measurements to fainter, lower-mass AGNs, including the IMBH regime in dwarfs.
- Uncorrected reddening can lower recovered MBH by a factor up to ~10, so any photometric mass census must include dust corrections.
- Variability-selected samples recover AGN only when bright states are used, meaning SED-only surveys underestimate AGN fractions without a variability prior.
- The z≈6.7 source with log MBH > 7.36 is reachable by Eddington-limited growth of a 100-solar-mass seed, so heavy seeding is not required for this source.
Reading between the lines
- The redshift trend could be partly a selection effect: at high z, only the most luminous (therefore overmassive) BHs pass the variability and AGN fraction cuts; deeper surveys or completeness modeling are needed to separate the physical trend from selection.
- If the Kaspi relation is luminosity-dependent, extrapolating it to L5100 ~10^42.9 may systematically bias MBH at high z; a reverberation-mapped sample at fainter luminosities or a cross-check with stellar velocity dispersions would test this.
- The two dwarf IMBH candidates hint that variability selection can open a new window on the low-mass end of the BH mass function; spectra of these hosts could confirm the AGN interpretation and measure duty cycles.
- The method's reddening sensitivity suggests photometric MBH programs should combine it with Balmer-decrement or IR dust indicators to break the dust–luminosity degeneracy.
Editorial analysis
A structured set of objections, weighed in public.
Referee Report
Summary. The paper presents a bespoke SED fitting code applied to 121 photometrically variable AGN candidates in the Hubble Ultra Deep Field, using 26 HST+JWST filters from 0.2–4.8 microns. The model decomposes each SED into a stellar component (Bruzual & Charlot 2003 via bagpipes) and an AGN component (Temple et al. 2021 templates), with 5–7 free parameters and AIC-based model selection. The authors identify 26 sources with AGNfrac>0.2, measure L5100 from the reconstructed AGN spectrum, and estimate black hole masses using the Kaspi et al. (2000) scaling relation. They report evidence that high-redshift sources become increasingly overmassive relative to their host stellar masses, consistent with JWST broad-line AGN studies; they also identify two dwarf-galaxy IMBH candidates at z<1 and discuss a z≈6.74 candidate in the context of BH seeding.
Significance. If the central trend is robust, this is a valuable independent confirmation of the overmassive-BH phenomenon seen in JWST broad-line AGN, obtained through a photometric, variability-selected route that does not rely on broad-line measurements. The 26-filter PSF-matched photometry, injection-based error corrections, and explicit treatment of reddening and variability are careful and a strength of the work. The direct Hβ comparison for source 1807 provides a useful single-object sanity check. However, the high-redshift end of the claimed trend currently rests on sources that do not meet the paper's own statistical criterion for AGN retrieval, and on one source whose published spectrum is best matched by a low-redshift star. The paper's novelty and method are promising, but the central claim needs substantial revision to be supported.
major comments (3)
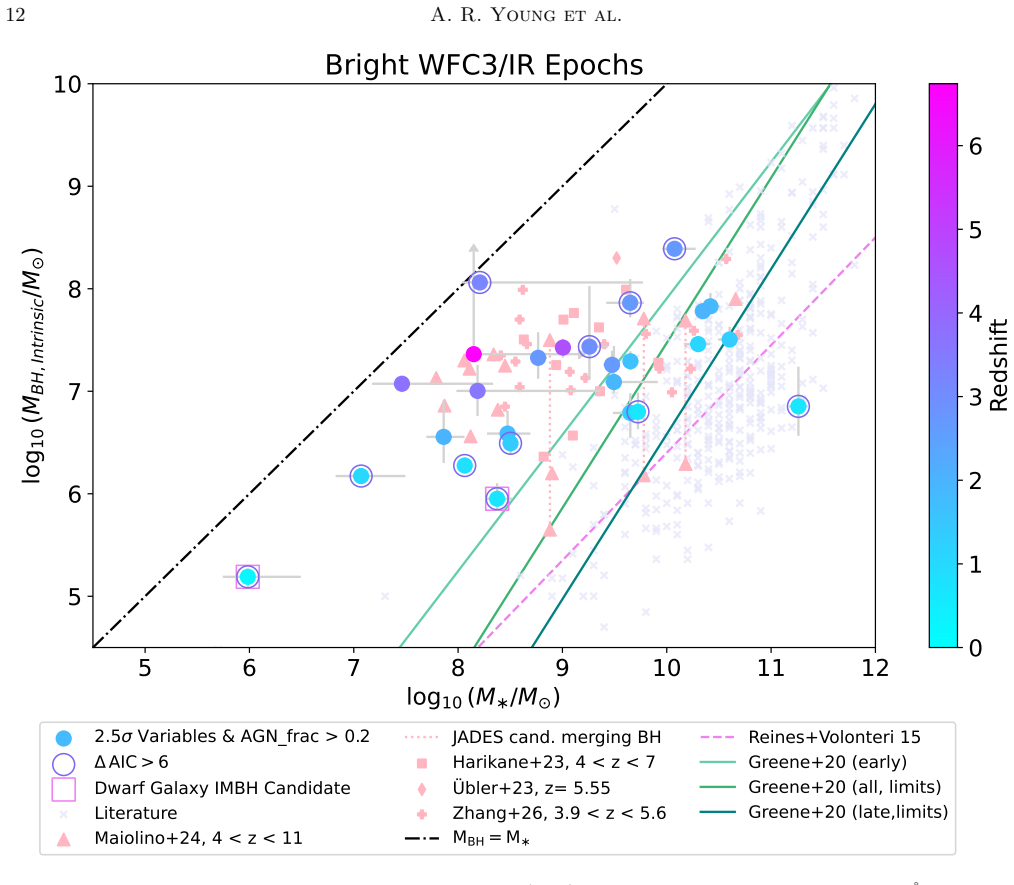
- [§4.1, Table 4, Fig. 6] The high-redshift part of the MBH–M* trend is driven by sources that fail the paper's own AIC model-selection criterion. Source 316 (z=4.61) has AIC_SP=44.45 < AIC_AGN+SP=46.03; source 258 (z=3.72) has 30.71 vs 32.71; source 3384 (z=3.60) has 2.58 vs 2.93, so in all three cases the pure stellar model is preferred. Source 1511 (z=6.74) has ΔAIC=3.94, below the adopted ΔAIC≥6 threshold. Only source 1807 (z=3.19) both satisfies ΔAIC≥6 and AGNfrac>0.2. Since the stated criterion for 'retrieved as AGN via SED fitting' is not met for the very sources defining the z>3 excess, the claim of a photometrically determined overmassive trend is not supported by the current selection. Please rerun the MBH–M* analysis using only sources that meet both criteria, or, if the AGNfrac-only sample is retained, justify why AGNfrac is sufficient and explicitly show how the trend changes when the non-AIC and dis
- [§4.3, §5.4, Fig. 8] Source 1511 is the only z>6 object used in the seeding discussion, yet the paper acknowledges that a published DDT/NIRSpec spectrum is best matched by a late-type star at z~0 and states 'we cannot rule out the stellar classification.' Despite this, the source is retained as a z_phot=6.74 AGN and its lower limit on MBH is presented as a constraint on light/heavy seeding scenarios. Because the photometric AGN interpretation is directly contested by a spectrum, the seeding implications in §5.4 and the final conclusion bullet are not justified. The source should be excluded from the seeding analysis, or the analysis should explicitly quantify how the conclusions change if 1511 is a low-redshift star. At minimum, all z>6 statements must be flagged as dependent on a photometric classification that the paper itself cannot rule out.
- [§5.1, Eq. (3)] The Kaspi et al. (2000) relation is extrapolated about 1.3 dex in L5100 below the calibration median and about 3 dex below the brightest RM sources. The paper acknowledges this in §5.1, but the absolute MBH values, and hence the offset from the local MBH–M* relation, depend on the extrapolation being valid in shape and normalization. The one available check, source 1807, gives log MBH=8.06 from L5100 versus 7.48±0.13 from Hβ—a factor ~3.5 offset, in the direction that enhances the overmassive claim. Please propagate the intrinsic scatter of the relation into the reported errors and test the sensitivity of the trend to alternative calibrations (e.g., Bentz et al. 2013) and to a conservative change in slope or normalization. Without such a sensitivity test, the absolute masses and the derived offset from local relations remain subject to a systematic uncertainty that is not quantified.
minor comments (4)
- [Table 4] Sources 2810 and 2774 appear twice in the table with identical values. This appears to be a duplication error and should be corrected.
- [§5.3, §6] Minor language issues: 'accross' should be 'across' in §5.3; 'comphlimented' should be 'complemented' in §6. Also, the phrase 'does not require the measurement of broad line properties' in the final paragraph is fine but the sentence could be tightened for clarity.
- [Fig. 6] The caption states that sources meeting the ΔAIC condition are 'outlined by purple circles,' but the figure may not be readable in grayscale or for color-blind readers. Consider using distinct marker shapes or adding labels.
- [§4.2] The authors state that intrinsic scatter of the Kaspi relation is not included in the error propagation. While this is a choice, it should be stated prominently in the text or table caption, as the reported error bars are therefore formal uncertainties only.
Circularity Check
No significant circularity: MBH estimates derive from external Kaspi calibration and the redshift trend is not imposed by construction.
full rationale
The paper's derivation chain is: (1) variability-selected AGN candidates from Cammelli et al. (2025, companion paper, same group); (2) SED decomposition using external stellar (Bruzual & Charlot via bagpipes) and AGN (Temple et al. 2021) templates; (3) L5100 measured from the best-fit AGN template; (4) MBH computed with the external Kaspi et al. (2000) scaling relation; (5) comparison to local MBH-M* relations from Reines & Volonteri (2015) and Greene et al. (2020). No equation in the paper defines the target result (the overmassive trend) in terms of itself or of a fitted parameter that is then called a prediction. The Kaspi relation and Temple templates are external, not derived here. The AGN fraction > 0.2 selection is a modeling choice, and the paper honestly reports that several high-z sources fail the AIC criterion and that source 1511 cannot be ruled out as a stellar interloper; this affects robustness, not circularity. The use of the companion variability catalogue is a data input, not a conclusion imported by definition. The paper explicitly acknowledges the luminosity/redshift extrapolation of the Kaspi relation as a caveat. Thus, no circular step is present; the central claim, while debatable, is not forced by construction.
Assumptions & free parameters
free parameters (7)
- norm_AGN =
per source (Table 4)
- E(B-V)_AGN =
per source (Table 4)
- E(B-V)_diffuse =
per source (Table 4)
- log10(tau) =
per source
- log10(t_age) =
per source
- metallicity =
per source (grid 0.1-2 Zsun)
- norm_stellar =
per source
assumptions (5)
- domain assumption Kaspi et al. (2000) MBH-L5100 relation holds for all sources
- domain assumption Temple et al. (2021) AGN templates are representative of AGN SEDs at all redshifts and luminosities
- domain assumption Photometric redshifts from Cammelli et al. (2025) are correct for sources without spectroscopy
- domain assumption Variability is due to AGN accretion variations
- domain assumption Dust extinction laws (Calzetti, SMC) and IGM absorption (Madau 1995) are accurately described
Cite this review
Pith. "Pith review of Glimmers in the Cosmic Dawn. III. On the Photometrically Determined Black Hole Mass to Stellar Mass Relation Across Cosmic Time." pith.science (2026). https://pith.science/paper/UY2MP7N7
@misc{pith2026250815905,
  author       = {Pith},
  title        = {Pith review of: Glimmers in the Cosmic Dawn. III. On the Photometrically Determined Black Hole Mass to Stellar Mass Relation Across Cosmic Time},
  year         = {2026},
  howpublished = {\url{https://pith.science/paper/UY2MP7N7}},
  note         = {Machine review of arXiv:2508.15905}
}
abstract
We present the results from performing spectral energy distribution (SED) fitting on 121 variable active galactic nuclei (AGN) candidates in the Hubble Ultra Deep Field (HUDF) using photometry from both the Hubble Space Telescope (HST) and the James Webb Space Telescope (JWST) covering $0.2 - 4.8$ microns. We designed a bespoke SED fitting code which decomposes the total SED into its stellar and AGN contributions. Our SED fitting retrieves a significant contribution to the total SED from an AGN template for 26 of our variable sources with $0 < z < 7$. We leverage the model AGN spectrum to estimate black hole masses ($M_{BH}$) using the measured luminosity at 5100 \r{A} and local empirical calibrations. Common with recently discovered JWST broad line AGN (BL-AGN), we observe a trend in the $M_{BH} - M_{\ast}$ plane where low redshift sources have $M_{BH}$ which agree with local relations while high redshift sources have increasingly overmassive black holes with respect to the stellar mass ($M_{\ast}$) of their host galaxies. Within our sample, we identify two IMBH candidates hosted by dwarf galaxies at $z<1$ featuring overmassive BHs in the $M_{BH}-M_{\ast}$ plane, similarly to our high redshift sources. Finally, our SED fitter successfully retrieves the AGN nature of one source at $z >6$. This object has $z_{phot} = 6.74$ and we estimate a lower limit on its black hole mass of $\log_{10}(M_{BH}/M_{\odot}) > 7.36$.
Figures


Figures from the paper (8 more)




Reference graph
Works this paper leans on
-
[1]
2024, Nature, 627, 281–285, doi: 10.1038/s41586-024-07053-4 Akins, H
Abuter, R., Allouche, F., Amorim, A., et al. 2024, Nature, 627, 281–285, doi: 10.1038/s41586-024-07053-4 Akins, H. B., Casey, C. M., Lambrides, E., et al. 2024, COSMOS-Web: The over-abundance and physical nature of ”little red dots”–Implications for early galaxy and SMBH assembly. https://arxiv.org/abs/2406.10341 Akins, H. B., Casey, C. M., Berg, D. A., e...
arXiv 2024
-
[3]
F140W 2012-2023 F140W 2023-2012 28.028.529.029.530.030.531.0 Injected Source Magnitude [AB Mag] 0.0 0.2 0.4 0.6 0.8 1.0Fraction of Sources Retrieved F160W (N =
work page 2012
-
[4]
F160W 2009-2012 F160W 2012-2009 Figure
work page 2009
-
[11]
Results from the artificial stars tests seeking to determine if there is a detection bias for variables which get brighter between epochs. Plots show the fraction of injected sources retrieved from the total sample in each magnitude bin (N=500) for the F105W, F140W and F160W filters. The different curves show the different results when difference images a...
arXiv 2017
-
[385]
https://arxiv.org/abs/1705.10877 Fonseca Alvarez, G., Trump, J. R., Homayouni, Y., et al. 2020, ApJ, 899, 73, doi: 10.3847/1538-4357/aba001 Foreman-Mackey, D., Hogg, D. W., Lang, D., & Goodman, J. 2013, Publications of the Astronomical Society of the Pacific, 125, 306–312, doi: 10.1086/670067 Freitag, M., Rasio, F. A., & Baumgardt, H. 2006, Monthly Notice...
arXiv 2020
-
[500]
F105W 2009-2012 F105W 2012-2009 28.028.529.029.530.030.531.0 Injected Source Magnitude [AB Mag] 0.0 0.2 0.4 0.6 0.8 1.0Fraction of Sources Retrieved F140W (N =
work page 2009
Reviewed August 5, 2026 · model on record in the stance chip above.
Discussion (0). Sign in to comment.