REVIEW 3 major objections 4 minor 29 references
Enhancing XAI Interpretation through a Reverse Mapping from Insights to Visualizations
T0 review · 3 major / 4 minor · reviewed 2026-08-05 · deepseek-v4-flash
Pith's one-line read Reverse Mapping closes the loop between AI explanations and user insight by converting free-form user interpretations into structured annotations and coordinated views.
desk verdict Genuinely new reverse-mapping idea for XAI visualization, but the evidence is thin and the schema/LLM parsing gap is load-bearing. read the letter →
The pith
A machine-rendered reading of the paper's core claim, the machinery that carries it, and where it could break.
The reading
What carries the argument
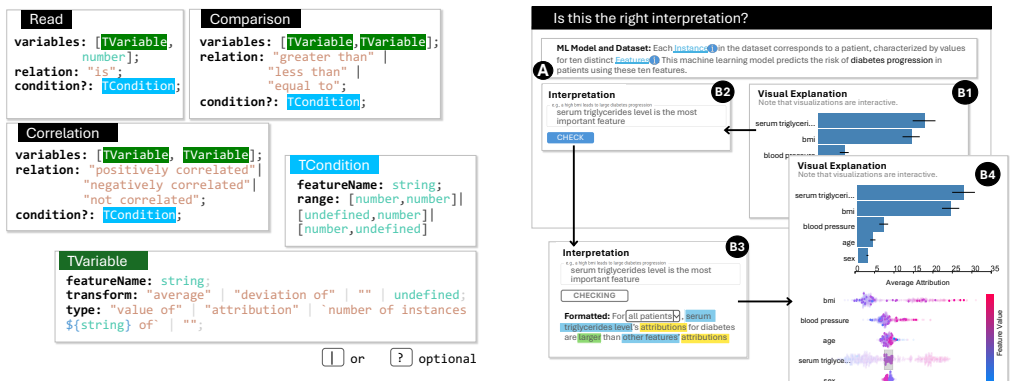
The key mechanism is the two-step Reverse Mapping pipeline: (1) LLM-powered parsing of free-form user text into a structured insight defined by the TypeScript-style schema (variables, relations, optional feature-range conditions), and (2) mapping that structured insight back onto the original visualization by dimming unrelated marks, overlaying reference lines, and generating supplementary charts chosen with empirical design guidelines.
What would settle it
Run the system on a broad corpus of free-form insights from real users analyzing attribution visualizations and compare human-coded categories to the schema: any insight that doesn't fit one of the three types or is mis-parsed would break the reverse mapping. Alternatively, a pre-registered A/B test with a larger sample could check whether the reverse-mapping condition reliably beats a control on a verified insight-discrimination task.
Extended reading notes
Core claim
The paper's central claim is that user-derived insights can be mapped back onto visual explanations to improve interpretation and verification. It defines a structured insight space with three types — Read, Correlation, Comparison — and builds a pipeline that uses GPT-4o to convert free-form text into this schema, then aligns the structured insight with the visualization specification to emphasize relevant marks and generate coordinated additional views. Initial evidence from use cases and a qualitative study supports the claim that this reverse mapping helps users confirm or correct their interpretation of AI explanations.
Load-bearing premise
The paper assumes that the three insight types (Read, Correlation, Comparison) capture what users actually take away from attribution-based global explanations, and that the LLM can parse free-form text into that schema without meaningful loss — the paper itself notes the LLM can introduce unexpected errors.
Editorial extensions
If this is right
- Users move from passively reading explanations to actively testing their own hypotheses against the visualization.
- Incorrect insights can be caught: in the study, participants identified errors 56% of the time only after seeing the enhanced views.
- The method transfers to any attribution-based explanation, since it is built on the underlying data format rather than SHAP-specific features.
- The interaction pattern follows the verification loop in the knowledge generation model, so it could be extended to other visual analytics tasks beyond XAI.
Reading between the lines
- If the schema generalizes, future XAI tools could maintain a running model of each user's misunderstandings and correct them in real time, rather than delivering one-shot explanations.
- The three-type schema could be expanded to cover time-series, counterfactual, or causal explanations, making reverse mapping a general layer for interactive explanation systems.
- A controlled study with a holdout test (e.g., predicting model outputs) could quantify whether the 56% correction rate translates into durable learning gains.
Editorial analysis
A structured set of objections, weighed in public.
Referee Report
Summary. The paper introduces Reverse Mapping, a paradigm for XAI visualization in which the user's free-form textual interpretation of an explanation is converted by an LLM (GPT-4o) into a structured insight (one of three types: Read, Correlation, Comparison; possibly with conditions), and that structured insight is then mapped back onto the original visualization via annotations and coordinated multi-view visualizations. The prototype is built on SHAP-based global explanations of a diabetes-progression model and is demonstrated with two use cases: one where a correct user insight is reinforced (no correlation between blood-pressure and serum-triglyceride attributions) and one where an incorrect user insight is rejected (blood pressure 'contributes to increased diabetes progression in most patients'). Qualitative feedback was collected from 25 online participants and 3 supervised interviews, reporting 84% 'very helpful' ratings and 56% correction of initially incorrect statements after seeing the enhanced visualizations. The paper frames the work as initial evidence for a new paradigm and explicitly lists evaluation depth and LLM reliability as limitations.
Significance. If the central claim holds, Reverse Mapping offers a useful inversion of the usual visualization-to-insight flow: instead of only extracting insights from static explanation plots, the system closes the loop by returning the user's own insight into the visual explanation and thereby supporting verification. This is a novel contribution that connects XAI interpretation to the knowledge-generation loop from visual analytics. The prototype is concrete, builds on grammar-based visualization specifications, and makes a reasonable design choice to steer visualization recommendation by empirical design guidelines rather than raw LLM suggestion. The paper is honest about its preliminary nature, and the two use cases are clear and illustrative. However, the load-bearing assumptions—that the three-type schema spans the space of user insights and that the LLM parses free-form text faithfully—are not validated, and the user study lacks a control condition, so the empirical evidence currently falls short of supporting the strength of the claims in the abstract.
major comments (3)
- [§4.1, Figure 2] The paper defines three structured insight types (Read, Correlation, Comparison) and states that this 'space of XAI insights' is derived from the data format of attribution-based global explanations and task abstraction. No evidence is provided that these three types cover the range of insights users actually express about such explanations. The user study does not measure schema coverage or record how many user inputs could not be represented. This is load-bearing: the reverse-mapping pipeline depends on every free-form insight being convertible to this schema without loss or distortion. If a user's insight is compound, conditional, or comparative across more than two features, the system has no defined way to represent it and may silently coerce it into a wrong structured form. Please provide a systematic analysis of schema coverage on a corpus of user utterances, or extend the schema
- [§4.2 and §7] The conversion from free-form text to structured JSON is performed by GPT-4o using few-shot and chain-of-thought prompting, and the paper concedes in Section 7 that 'using LLM in the Reverse Mapping requires further investigation and validation' and that 'LLM in formatting user inputs can introduce unexpected errors.' Yet the evaluation in Section 6 does not measure parse accuracy, the frequency of LLM-induced errors, or how often users had to correct the structured output via the dropdown/input mechanism. This matters because a mis-parsed insight will produce exactly the wrong annotation or additional view, potentially reinforcing a misconception while presenting it as an objective check. I request an explicit accuracy evaluation of the parser on a representative set of user statements, including out-of-schema and ambiguous inputs, and a description of failure handling in the system.
- [§6] The reported evidence—84% of participants finding the enhancements 'very helpful' and 56% correcting an incorrect statement after viewing enhancements—comes from a study with no control or baseline condition and with self-reported, non-behavioral outcome measures. Without a comparison condition (e.g., static explanation, generic interactive visualization without reverse mapping, or a non-adaptive annotation condition), these numbers do not establish that the benefit is attributable to the reverse-mapping mechanism rather than to the simple act of providing an additional view or allowing interaction. The small qualitative sample (25 online participants, 3 interviews) is suitable for a preliminary feasibility study but not for the strong claim in the abstract that the approach 'enhances visual explanations' and helps users 'verify specific insight.' Please add a between-subjects or within-
minor comments (4)
- [§2] Typo: 'constrasting AI recommendations' should be 'contrasting AI recommendations.'
- [§1 and throughout] Minor writing issues: 'mindlessly reliance' should be 'mindless reliance'; some sentences are run-on (e.g., 'This manifests when users misattribute meaning to incorrect visual channels...'). A careful copyedit would improve readability.
- [Figure 2] The schema diagram is dense and the TypeScript syntax may be unfamiliar to some readers. A short textual explanation of the notation (e.g., what ':=Consist of' and '|or?optional' mean) would make the figure self-contained.
- [§4.3] The description of how annotations are generated says marks and channels are identified by 'examining their associations with the feature' in visualization specifications. More detail on the alignment algorithm (e.g., how feature names are matched to encodings, and how conditional ranges are converted to reference lines) would help reproducibility.
Circularity Check
No significant circularity: the paper is a design proposal with an empirical qualitative evaluation; no derivation or prediction reduces to its own inputs.
full rationale
The paper contains no fitted parameter, no quantitative prediction derived from a model, and no uniqueness theorem imported from the authors' prior work. The Reverse Mapping pipeline is presented as a design: free-form user insights are parsed by GPT-4o into a hand-specified schema (Figure 2), then mapped by rules to annotations and coordinated visualizations (§4.3). The schema and mapping rules are design choices, not outputs of the evaluation. The reported percentages (84% 'very helpful', 56% correction) are empirical measurements from the user study, not quantities forced by the pipeline. The references that include current authors ([3], [21], [23]) are used as background, related interventions, or prior design motivation; none is load-bearing for the central claim, and no alternative is declared forbidden via a self-citation. Section 7 explicitly discloses that LLM formatting 'can introduce unexpected errors' and that the evaluation is 'preliminary and qualitative'; these are acknowledged limitations and validity threats, not circular steps. The self-consistency concern—users see enhancements derived from their own stated insights—could affect construct validity of the study, but it does not make the claimed enhancement equivalent to its input by construction. Thus the derivation chain is not circular.
Assumptions & free parameters
assumptions (5)
- domain assumption The verification loop in the visualization knowledge generation model (Sacha et al.) applies to XAI explanation interpretation.
- domain assumption SHAP-based attribution visualizations are a representative and sufficient testbed for the Reverse Mapping paradigm.
- ad hoc to paper The three-type structured insight schema (Read, Correlation, Comparison) is a sufficient taxonomy for insights from attribution-based global explanations.
- domain assumption GPT-4o with few-shot and chain-of-thought prompting can reliably classify and structure free-form user text into the predefined JSON schema.
- domain assumption Visualization design guidelines from GenoRec and DracoGPT are valid for selecting charts that support insight verification.
Cite this review
Pith. "Pith review of Enhancing XAI Interpretation through a Reverse Mapping from Insights to Visualizations." pith.science (2026). https://pith.science/paper/S46GDWKC
@misc{pith2026250818640,
  author       = {Pith},
  title        = {Pith review of: Enhancing XAI Interpretation through a Reverse Mapping from Insights to Visualizations},
  year         = {2026},
  howpublished = {\url{https://pith.science/paper/S46GDWKC}},
  note         = {Machine review of arXiv:2508.18640}
}
read the original abstract
As AI systems become increasingly integrated into high-stakes domains, enabling users to accurately interpret model behavior is critical. While AI explanations can be provided, users often struggle to reason effectively with these explanations, limiting their ability to validate or learn from AI decisions. To address this gap, we introduce Reverse Mapping, a novel approach that enhances visual explanations by incorporating user-derived insights back into the explanation workflow. Our system extracts structured insights from free-form user interpretations using a large language model and maps them back onto visual explanations through interactive annotations and coordinated multi-view visualizations. Inspired by the verification loop in the visualization knowledge generation model, this design aims to foster more deliberate, reflective interaction with AI explanations. We demonstrate our approach in a prototype system with two use cases and qualitative user feedback.
Figures


Figures from the paper (1 more)

Reference graph
Works this paper leans on
-
[1]
J. Adebayo, M. Muelly, I. Liccardi, and B. Kim. Debugging tests for model explanations. In Proceedings of the 34th International Confer- ence on Neural Information Processing Systems . Curran Associates Inc., Red Hook, NY , USA, 2020. 1
work page 2020
-
[2]
G. Bansal, T. Wu, J. Zhou, R. Fok, B. Nushi, E. Kamar, M. T. Ribeiro, and D. Weld. Does the whole exceed its parts? the effect of ai expla- nations on complementary team performance. In Proceedings of the 2021 CHI Conference on Human Factors in Computing Systems. As- sociation for Computing Machinery, New York, NY , USA, 2021. doi: 10.1145/3411764.3445717 1, 2
arXiv 2021
-
[3]
J. Y . Bo, P. Hao, and B. Y . Lim. Incremental xai: Memorable under- standing of ai with incremental explanations. In Proceedings of the 2024 CHI Conference on Human Factors in Computing Systems. As- sociation for Computing Machinery, New York, NY , USA, 2024. doi: 10.1145/3613904.3642689 1, 2
arXiv 2024
-
[4]
M. Brundage, S. Avin, J. Wang, H. Belfield, G. Krueger, G. Hadfield, H. Khlaaf, J. Yang, H. Toner, R. Fong, et al. Toward trustworthy ai development: Mechanisms for supporting verifiable claims, 2020. 2
work page 2020
-
[5]
Z. Buc ¸inca, M. B. Malaya, and K. Z. Gajos. To trust or to think: Cog- nitive forcing functions can reduce overreliance on ai in ai-assisted decision-making. Proc. ACM Hum.-Comput. Interact. , 5(CSCW1), Apr. 2021. doi: 10.1145/3449287 1, 2
doi:10.1145/3449287 2021
-
[6]
Z. Buc ¸inca, S. Swaroop, A. E. Paluch, F. Doshi-Velez, and K. Z. Gajos. Contrastive explanations that anticipate human misconcep- tions can improve human decision-making skills. In Proceedings of the 2025 CHI Conference on Human Factors in Computing Systems . Association for Computing Machinery, New York, NY , USA, 2025. doi: 10.1145/3706598.3713229 2
arXiv 2025
- [7]
- [8]
Show all 29 references
-
[10]
H. Kaur, H. Nori, S. Jenkins, R. Caruana, H. Wallach, and J. Wort- man Vaughan. Interpreting interpretability: Understanding data scien- tists’ use of interpretability tools for machine learning. InProceedings of the 2020 CHI Conference on Human Factors in Computing Systems, C...
2020
-
[11]
Q. V . Liao, D. Gruen, and S. Miller. Questioning the ai: Informing design practices for explainable ai user experiences. In Proceedings of the 2020 CHI Conference on Human Factors in Computing Systems, p. 1–15. Association for Computing Machinery, New York, NY , USA,
2020
-
[12]
Lundberg, G
S. Lundberg, G. Erion, H. Chen, A. DeGrave, J. Prutkin, B. Nair, R. Katz, J. Himmelfarb, N. Bansal, and S.-I. Lee. From local expla- nations to global understanding with explainable ai for trees. Nature Machine Intelligence, 2, 01 2020. doi: 10.1038/s42256-019-0138-9 1, 2
2020 doi
-
[13]
S. L’Yi, Q. Wang, F. Lekschas, and N. Gehlenborg. Gosling: A grammar-based toolkit for scalable and interactive genomics data visualization. IEEE Transactions on Visualization and Computer Graphics, 28(1):140–150, 2022. doi: 10.1109/TVCG.2021.3114876 2
2022
-
[14]
Y . Ming, H. Qu, and E. Bertini. Rulematrix: Visualizing and under- standing classifiers with rules. IEEE Transactions on Visualization and Computer Graphics, 25(1):342–352, 2019. doi: 10.1109/TVCG. 2018.2864812 2
2019
-
[15]
R. K. Mothilal, A. Sharma, and C. Tan. Explaining machine learning classifiers through diverse counterfactual explanations. In Proceed- ings of the 2020 Conference on Fairness, Accountability, and Trans- parency, p. 607–617. Association for Computing Machinery, New York, NY , ...
2020
-
[16]
T. Munzner. Visualization analysis and design. CRC press, 2014. 2
2014
-
[18]
Sacha, A
D. Sacha, A. Stoffel, F. Stoffel, B. C. Kwon, G. Ellis, and D. A. Keim. Knowledge generation model for visual analytics. IEEE Transactions on Visualization and Computer Graphics , 20(12):1604–1613, 2014. doi: 10.1109/TVCG.2014.2346481 1
2014
-
[19]
Satyanarayan, D
A. Satyanarayan, D. Moritz, K. Wongsuphasawat, and J. Heer. Vega- lite: A grammar of interactive graphics. IEEE Transactions on Vi- sualization and Computer Graphics , 23(1):341–350, 2017. doi: 10. 1109/TVCG.2016.2599030 2
2017
-
[20]
Waldstein, P
S. Waldstein, P. Seeb ¨ock, R. Donner, A. Sadeghipour, H. Bogunovi ´c, A. Osborne, and U. Schmidt-Erfurth. Unbiased identification of novel subclinical imaging biomarkers using unsupervised deep learn- ing. Scientific Reports, 10:12954, 07 2020. doi: 10.1038/s41598-020 -69814-1 1
2020 doi
-
[21]
D. Wang, Q. Yang, A. Abdul, and B. Y . Lim. Designing theory-driven user-centric explainable ai. In Proceedings of the 2019 CHI Confer- ence on Human Factors in Computing Systems , p. 1–15. Association for Computing Machinery, New York, NY , USA, 2019. doi: 10.1145/ 3290605.3300831 2
2019
-
[22]
H. W. Wang, M. Gordon, L. Battle, and J. Heer. Dracogpt: Ex- tracting visualization design preferences from large language mod- els. IEEE Transactions on Visualization and Computer Graphics , 31(1):710–720, Jan. 2025. doi: 10.1109/TVCG.2024.3456350 3
2025
-
[23]
Q. Wang, K. Huang, P. Chandak, M. Zitnik, and N. Gehlenborg. Ex- tending the nested model for user-centric xai: A design study on gnn- based drug repurposing. IEEE Transactions on Visualization and Computer Graphics , 29(1):1266–1276, 2023. doi: 10.1109/TVCG. 2022.3209435 1, 2
2023
-
[24]
Q. Wang, Y . Ming, Z. Jin, Q. Shen, D. Liu, M. J. Smith, K. Veera- machaneni, and H. Qu. Atmseer: Increasing transparency and con- trollability in automated machine learning. InProceedings of the 2019 CHI Conference on Human Factors in Computing Systems , p. 1–12. Association ...
2019
-
[25]
Q. Wang, J. Yuan, S. Chen, H. Su, H. Qu, and S. Liu. Visual geneal- ogy of deep neural networks. IEEE Transactions on Visualization and Computer Graphics, 26(11):3340–3352, 2020. doi: 10.1109/TVCG. 2019.2921323 2
2020
-
[26]
F. Yang, Z. Huang, J. Scholtz, and D. L. Arendt. How do visual ex- planations foster end users’ appropriate trust in machine learning? In Proceedings of the 25th International Conference on Intelligent User Interfaces, p. 189–201. Association for Computing Machinery, New York,...
2020
-
[27]
W. Yang, Z. Li, M. Liu, Y . Lu, K. Cao, R. Maciejewski, and S. Liu. Diagnosing concept drift with visual analytics. In 2020 IEEE Confer- ence on Visual Analytics Science and Technology (VAST), pp. 12–23,
2020
-
[28]
Y . You, H. W. Chen, and J. Zhao. Enhancing ai explainability for non- technical users with llm-driven narrative gamification. InProceedings of the Extended Abstracts of the CHI Conference on Human Factors in Computing Systems . Association for Computing Machinery, New York, N...
2025
-
[29]
doi: 10.1109/V AST50239.2020.00007 2
2020
-
[31]
J. Yuan, C. Chen, W. Yang, M. Liu, J. Xia, and S. Liu. A survey of visual analytics techniques for machine learning. Computational Visual Media, 7(1):3–36, 2021. doi: 10.1007/s41095-020-0191-7 2
2021 doi
-
[2020]
doi: 10.1145/3313831.3376590 2
Reviewed August 5, 2026 · model on record in the stance chip above.
Discussion (0). Sign in to comment.