REVIEW 3 major objections 4 minor 2 references
Decoding the Single-peaked HI Spectra of Low Redshift Post-starburst Galaxies
T0 review · 3 major / 4 minor · reviewed 2026-08-15 · deepseek-v4-flash
Pith's one-line read Post-starburst galaxies at low redshift have unusually single-peaked H I spectra, and the paper argues that in most cases their remaining gas is concentrated in the center rather than dynamically unsettled.
desk verdict Solid, new K-excess measurement for PSBs, but the central-concentration interpretation rests on an unvalidated empirical boundary; worth refereeing with revisions. read the letter →
The pith
A machine-rendered reading of the paper's core claim, the machinery that carries it, and where it could break.
The reading
What carries the argument
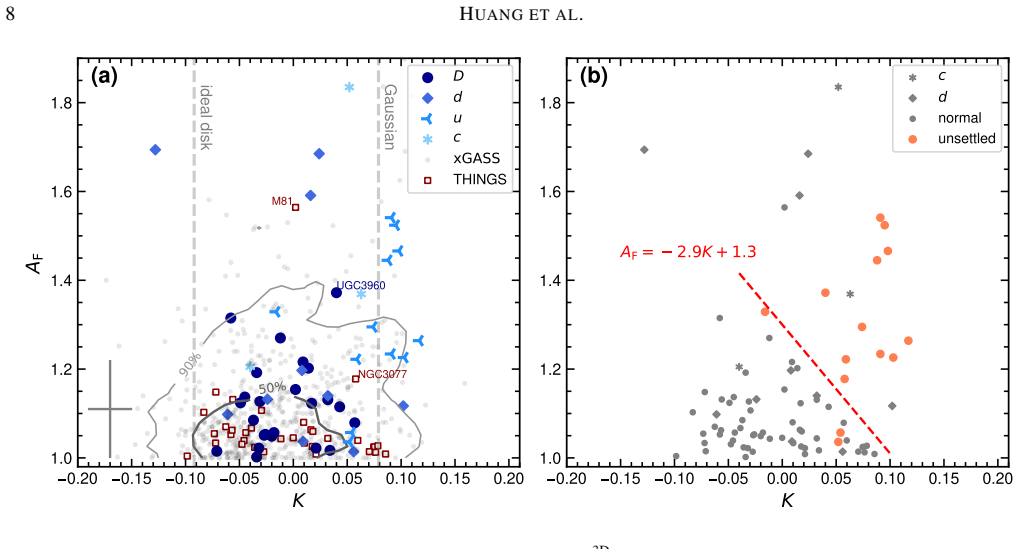
The load-bearing quantity is the spectral concentration $K$, a nonparametric measure of how peaked an integrated H I spectrum is (negative for double-horned, near zero for flat-topped, positive for single-peaked; a Gaussian has $K = 0.079$), paired with the spectral asymmetry $A_{\rm F}$, the ratio of flux on one side of the spectral center to the other. With THINGS maps the paper shows that $K$ tracks the spatial concentration of H I in the inner disk, while rotating the moment maps in the disk plane changes $K$ with a standard deviation of about 0.024, contributing scatter but no systematic shift. With ATLAS$^{\rm 3D}$ maps it shows that unsettled H I raises $K$ together with $A_{\rm F}$, and it proposes the empirical boundary $A_{\rm F} > -2.9K + 1.3$ to separate normal from unsettled gas. That boundary is the instrument that lets a single unresolved spectrum be classified as concentrated-but-settled versus unsettled.
What would settle it
A decisive test would be to map the neutral hydrogen in the 43 FAST-detected PSBs at kiloparsec resolution: if most of the high-$K$, low-$A_{\rm F}$ PSBs turn out to have extended, regularly rotating disks with normal central concentration, the main mechanism fails, while if many show large-scale chaotic kinematics despite low asymmetry, the empirical $K$-$A_{\rm F}$ divider is misclassifying unsettled gas as settled.
Extended reading notes
Core claim
The paper's central claim is that the high H I spectral concentration of low-redshift post-starburst galaxies is real, survives controlling for stellar mass, H I mass, optical concentration and inclination, and for most systems reflects central gas concentration rather than unsettled gas. Using resolved THINGS maps it shows that $K$ tracks the spatial concentration of H I in the inner disk, with the strongest sensitivity inside roughly one effective radius; mock rotations show that non-axisymmetric structure only adds scatter to $K$. Using ATLAS$^{\rm 3D}$ galaxies it shows that unsettled H I also raises $K$, but is accompanied by high spectral asymmetry. A boundary in the $K$-$A_{\rm F}$ plane separates normal from unsettled systems, and fewer than one-third of the PSBs lie in the unsettled region. The rest behave like settled disks with elevated central concentration, suggesting that mergers drive gas inward or destabilize it, and that the cold gas reservoir is retained but stabilized against star formation.
Load-bearing premise
The classification of most post-starburst galaxies as "settled but centrally concentrated" rests on a dividing line in the spectrum-shape versus asymmetry plane that was trained on a small set of nearby resolved galaxies and then applied to unresolved spectra; if unsettled gas in these galaxies is more symmetric than that training sample, the conclusion would misread.
Editorial extensions
If this is right
- For unresolved H I surveys, the spectral concentration $K$ becomes a cheap statistical indicator of where the neutral gas sits, with high-$K$, low-asymmetry spectra pointing to gas packed inside roughly one effective radius.
- The minority of PSBs above the unsettled boundary are candidates for merger-disrupted gas that is out of place, so their quenching is explained by displacement rather than removal of fuel.
- The majority of PSBs retain a relatively settled, centrally concentrated H I reservoir, implying that star formation is suppressed because the gas is stabilized by turbulence or a spheroid, not because it was ejected.
- Because PSB $K$ values match starburst values, the concentration is probably inherited from the starburst phase rather than produced by the quenching process itself.
- Since non-axisymmetric structure only adds scatter to $K$, individual values cannot be naively read as radial concentration; the diagnostic works statistically or when azimuthal structure is accounted for.
- Around a quarter of the PSBs are consistent with unsettled H I, so the sample may contain two distinct quenching paths, one driven by gas displacement and one by central gas stabilization.
Reading between the lines
- If the paper is right, an interferometric map of the high-$K$, low-$A_{\rm F}$ PSBs should show a central H I enhancement within roughly one effective radius on top of an otherwise rotating disk; that is a directly testable prediction.
- A stacked-spectrum extension: applying the same $K$-$A_{\rm F}$ boundary to unresolved spectra from large single-dish surveys would let the unsettled-galaxy fraction be measured statistically, without waiting for resolved maps.
- The bimodality implies two distinct re-ignition paths: settled-concentrated PSBs may stay quenched as long as turbulence holds, while the unsettled minority may form a new disk if the gas settles, a contrast future follow-up can test.
- If the concentration is inherited from the starburst phase, quenching in these systems is "gas stays but is stabilized" rather than "gas is expelled," which would tilt the balance against strong-outflow models for low-redshift PSBs.
Signed reviews
Editorial analysis
A structured set of objections, weighed in public.
Referee Report
Summary. The paper analyzes the integrated H I spectra of low-redshift post-starburst galaxies (PSBs) drawn from Ellison et al. (2025), using the spectral concentration statistic K introduced by Yu et al. (2022b). It reports that PSBs have significantly higher K than a matched sample of xGASS galaxies (two-sample KS test p<0.001), that the excess persists after controlling for stellar mass, H I mass, optical concentration, and inclination through a K' hyperplane correction, and that PSBs are statistically indistinguishable from xGASS starbursts. To interpret the excess, the paper uses resolved H I maps from THINGS and ATLAS3D to show that K correlates with spatial H I concentration, that non-axisymmetric structure mostly adds scatter, that unsettled H I tends to produce high K and high spectral asymmetry A_F, and that diffuse H I missed by interferometers has a modest systematic effect on K. On this basis the authors propose an empirical K-AF boundary (Eq. 3) to separate unsettled from normal H I, apply it to the PSB sample, and conclude that most PSBs are not dominated by unsettled H I but rather have centrally concentrated H I, implying that quenching in these systems is associated with gas redistribution rather than H I removal.
Significance. If the central interpretation holds, the paper makes a valuable observational contribution: it connects the recently discovered H I reservoirs in PSBs to the dynamical state of the gas, and it proposes a practical K-AF diagnostic that can be used with integrated spectra alone in large future surveys. The paper has clear strengths in the measurement of the K excess: K is an externally defined metric, the comparison to xGASS uses a carefully matched detection threshold, the K' correction removes obvious parameter dependencies, the KS test is highly significant, and the comparison to starbursts is a sensible benchmark. The resolved-map analyses in Sections 4.1 and 4.2 are instructive, and the paper candidly acknowledges its own caveats about the empirical boundary. The main significance, however, rests on the unsettled/settled split in Section 4.5, which is not yet secured by the analysis as presented.
major comments (3)
- [Section 4.3 / Eq. (3)] The settled/unsettled split that drives the central interpretation is based on the empirical boundary AF > -2.9K + 1.3, trained with a linear SVM on a small sample of THINGS and ATLAS3D galaxies, with the unsettled class defined by the u-type galaxies plus two reclassified systems (NGC 3077 and UGC 3960). The paper gives no cross-validation, no bootstrap or other uncertainty estimate for the boundary coefficients, and no test that the boundary transfers to the unresolved, lower-S/N FAST spectra of PSBs. Because Section 4.5's claim that 'less than one-third' of PSBs are unsettled and the remainder are centrally concentrated follows directly from applying this boundary in Figure 8a, the boundary is load-bearing for the paper's main conclusion. I request either cross-validation and bootstrap uncertainties for Eq. (3), a sensitivity analysis showing that the PSB breakdown is stable under plausible shifts of the boundary, and a transfer test using synthetic unresolved spectra generated from resolved maps, or a revision of the interpretation to present the unsettled/settled split as tentative.
- [Abstract; Sections 2.1, 2.2; Table 1] The abstract and Section 2.1 state that the analysis covers 67 PSBs with integrated H I spectra, but Section 2.2 and Table 1 define the final comparison sample as 43 PSBs after applying the conservative detection threshold. The percentages in Figure 3a (67.4% versus 36.5%) appear to be based on 43 PSBs, so it is unclear which claims use all 67 objects and which use only the 43. This discrepancy affects the abstract's accuracy as well as the reproducibility of the statistics. Please state explicitly which sample is used for each analysis, and either adjust the abstract or present the 67-galaxy measurement alongside the 43-galaxy one.
- [Section 4.5 / Figure 8b] The claim that settled PSBs still show elevated K relative to settled xGASS galaxies (p<0.001, average K difference 0.029) is made after excluding galaxies using Eq. (3). This comparison is not independent of the boundary being tested, and selecting on K and A_F can bias the residual K distribution even if the boundary is approximately correct. This does not threaten the raw K excess measured in Section 3, but the specific interpretation that most PSBs have centrally concentrated H I would be better supported by a more direct test, for example by mapping the K-spatial concentration relation from Section 4.1 onto the PSB K values while accounting for the selection imposed by the K-AF cut.
minor comments (4)
- [Figure 6b caption] The caption writes the boundary as 'AF = 2.9K + 1.3', which appears to omit the minus sign in Eq. (3); please correct this to match AF = -2.9K + 1.3.
- [Section 4.5 and Conclusion] The text says 'less than one-third of the PSBs fall within the region associated with unsettled H I', while the Conclusion says 'around a quarter of the PSBs'. Please give the exact fraction and its uncertainty, and make the two statements consistent.
- [Section 5 and Section 4.1] Section 5 says the analysis uses '34 late-type and dwarf galaxies in THINGS', while Section 4.1 uses only 25 THINGS galaxies with R_e measurements and Section 4.2 refers to 34; please clarify the counts and state explicitly which subsample is used in each step.
- [Eq. (2)] The hyperplane fit in Eq. (2) is reported without uncertainties on the coefficients alpha and beta; adding bootstrap errors would help the reader assess how much of the K' offset could be affected by the fitted correction.
Circularity Check
No significant circularity: the PSB K excess and the settled/unsettled split rest on external metrics and independent resolved-galaxy calibrations.
full rationale
The paper's central derivation chain is self-contained. The spectral concentration metric K is taken from Yu et al. (2022b) as an externally defined, nonparametric shape statistic, and the authors verify consistency against that work for 1000 randomly selected galaxies, finding negligible offsets. The claim that PSBs have elevated K does not reduce to a fit: the K-excess K' is obtained by fitting a hyperplane to the xGASS control sample and then evaluating PSB residuals, so the comparison is a standard control-residual analysis rather than a prediction constrained by PSB data. The key interpretation step, separating 'unsettled' from 'concentrated' HI, uses the empirical boundary AF > -2.9K + 1.3 (Eq. 3), trained on independently classified THINGS and ATLAS3D galaxies via a linear SVM. Applying this boundary to PSBs is a transfer of a classifier to new data, not a derivation that presupposes the PSB conclusion. The paper also explicitly cautions that the boundary is empirically derived from massive nearby galaxies and should be applied carefully to other regimes. While the authors cite their own prior work (Y22 and Yu et al. 2022a), the load-bearing relations are independently tested in Sections 4.1-4.4 using resolved HI data, and no equation used in the paper reduces the PSB result to a fitted parameter or to a self-citation. The potential fragility of the K-AF boundary, the small training sample, and the discrepancy between the 67 PSBs stated in the abstract and the 43 PSBs in the final sample are correctness and reporting concerns, not circularity. Overall, the derivation is not circular by construction.
Assumptions & free parameters
free parameters (2)
- K0 hyperplane coefficients =
alpha = (-0.0094, -0.0256, 0.0042, -0.0596); beta = 0.352
- K-AF unsettled boundary coefficients =
AF = -2.9K + 1.3
assumptions (3)
- domain assumption The K-AF boundary trained on THINGS and ATLAS3D transfers to unresolved low-redshift PSBs.
- domain assumption K measurements are comparable across FAST, ALFALFA, xGASS, HI-MaNGA, THINGS, and ATLAS3D after S/N correction and 5.5 km/s resampling.
- domain assumption The E25 PSB sample remains representative after removing 25/111 galaxies with HI confusion.
Cite this review
Pith. "Pith review of Decoding the Single-peaked HI Spectra of Low Redshift Post-starburst Galaxies." pith.science (2026). https://pith.science/paper/XHQAMBNE
@misc{pith2026250819545,
  author       = {Pith},
  title        = {Pith review of: Decoding the Single-peaked HI Spectra of Low Redshift Post-starburst Galaxies},
  year         = {2026},
  howpublished = {\url{https://pith.science/paper/XHQAMBNE}},
  note         = {Machine review of arXiv:2508.19545}
}
abstract
Recent observations with the Five-hundred-meter Aperture Spherical Telescope (FAST) have revealed abundant reservoirs of neutral hydrogen (HI) in low redshift post-starburst galaxies (PSBs), raising the question of why star formation ceases rapidly in these systems. In this study, we present a detailed analysis of the shape of the integrated HI spectra of 67 PSBs. We find that PSBs exhibit significantly higher HI spectral concentration values ($K$) compared to a matched sample from xGASS, and are more comparable to those of starburst galaxies. By extending our analysis to spatially resolved HI data from THINGS and ATLAS$^{\rm 3D}$, we show that both centrally concentrated HI distributions and dynamically unsettled HI can effectively increase $K$, while non-axisymmetric structures only contribute to the scatter of the $K$ distribution. Distinguishing between central concentration and dynamically unsettled gas as the origin of high $K$ can be achieved by measuring the spectral asymmetry ($A_{\rm F}$), making the $K$-$A_{\rm F}$ plane a powerful diagnostic tool for identifying galaxies with unsettled HI using integrated spectra alone. Based on their location in the $K$-$A_{\rm F}$ plane, we find that most PSBs are not dominated by unsettled HI, but rather exhibit elevated central gas concentration. Both modes of gas redistribution in PSBs may eventually contribute to their quenching.
Figures


Figures from the paper (7 more)




Reference graph
Works this paper leans on
-
[1]
Abazajian, K. N., Adelman-McCarthy, J. K., Ag¨ueros, M. A., et al. 2009, ApJS, 182, 543, doi: 10.1088/0067-0049/182/2/543 Alatalo, K., Lacy, M., Lanz, L., et al. 2015, ApJ, 798, 31, doi: 10.1088/0004-637X/798/1/31 HI SPECTRAL SHAPE OF PSB S 13 Table
-
[2]
Properties of 43 PSBs in the final PSB sample. SDSS objID R.A. Decl. z log M∗ log MHI PM flag K K ′ σK (deg) (deg) ( M⊙) ( M⊙) (1) (2) (3) (4) (5) (6) (7) (8) (9) (10) 587722984440463382 216.5541 0.8606 0.03186 10.18 9.06 T 0.134 0.115 0.048 587725489988960505 257.1393 57.4767 0.02961 9.61 8.86 F -0.064 -0.062 0.042 587726032256630848 198.4683 2.1326 0.03...
Reviewed August 15, 2026 · model on record in the stance chip above.
Discussion (0). Continue with ORCID to comment.