REVIEW 3 major objections 5 minor 65 references
Gravitational Microlensing of the Galactic Centre $\gamma$-Ray Excess: A New Test for Point-Like or Extended Emission?
T0 review · 3 major / 5 minor · reviewed 2026-08-15 · deepseek-v4-flash
Pith's one-line read Gravitational microlensing can tell whether the Galactic Centre gamma-ray excess comes from point-like pulsars or smooth dark matter—provided future detectors gain enough sensitivity.
desk verdict A genuinely new temporal test of the GCE origin, with a sound qualitative conclusion but several load-bearing numerical inconsistencies that must be fixed before the event rates can be trusted. read the letter →
The pith
A machine-rendered reading of the paper's core claim, the machinery that carries it, and where it could break.
The reading
What carries the argument
The load-bearing object is the Einstein radius in the source plane, $R_E = \sqrt{\frac{4GM}{c^2}\frac{D_{os}D_{ls}}{D_{ol}}}$, about 8.1 au for a solar-mass lens toward the Galactic Bulge. The key identity is the point-source magnification $\mu = \frac{y^2+2}{y\sqrt{y^2+4}}$, whose spike at a binary-lens caustic crossing is capped by the finite source radius as $\mu_{\max} \sim 2R_E/r_s$; for a 10-km pulsar this yields the ~8700-fold flashes that the paper uses as its primary signature. The argument runs on the contrast between point sources and extended sources: a pulsar is eight orders of magnitude smaller than $R_E$ and therefore gets magnified, while dark-matter annihilation emission is smooth on au scales and is essentially unmodified. The caustic-crossing events come from the 6% of lenses that are binaries, 70% of which produce caustic crossings, and the paper converts the optical depth $\tau \sim 3\times10^{-6}$ into event rates via the area swept out by moving lenses.
What would settle it
A concrete check: inject the predicted twin-peak caustic-crossing lightcurve into one resolution element of synthetic Fermi-LAT data with photon counts scaled by $10^{1.41}$ (26x sensitivity) and run the paper's 3-day sliding-window Poisson significance search; if the twin peaks are not recovered with p ≤ 0.01, the detection threshold is too optimistic. On the observational side, a single clean measurement of the ~8700-amplification double peak separated by ~70 days from the Galactic Centre would rule out smooth dark-matter annihilation as the source of that flux, while a decade-long null search with a 26x detector in the 500-source scenario would start to constrain the compact-source fraction.
Extended reading notes
Core claim
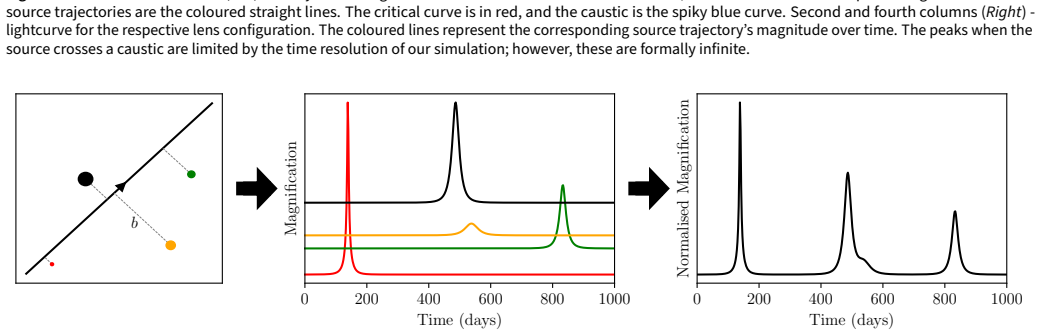
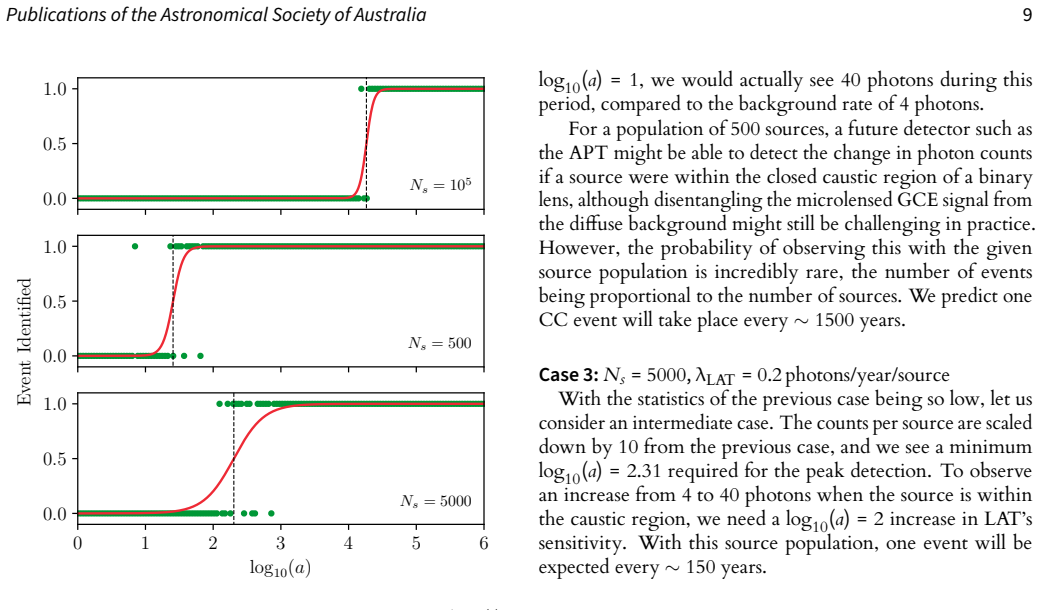
The central claim is that gravitational microlensing supplies a new, template-independent discriminant between the two leading explanations of the Galactic Centre excess: if the excess is produced by millisecond pulsars, the gamma-ray flux from a small patch of the bulge will occasionally show sharp temporal magnifications, while a smooth dark-matter signal will be temporally flat. The physical basis is the size-dependence of the Einstein magnification: for a point source of radius $r_s$, the maximum magnification is about $2 R_E / r_s$, and with a 10-km pulsar and a stellar lens $R_E \sim$ au, this reaches about $2.4\times10^8$ in perfect alignment and about 8700 at the caustic crossing of a typical binary-lens event. On this basis the paper predicts two characteristic signatures—twin caustic-crossing peaks roughly 70 days apart, and single-lens bumps lasting weeks—and simulates Poisson photon arrivals to find the detector sensitivity needed to see them. The required improvement in effective area over Fermi-LAT is a factor of $10^{1.41}$ for a population of 500 bright sources, $10^{2.31}$ for 5000 sources, and $10^{4.26}$ for 100,000 faint sources. None of these thresholds is met by Fermi-LAT or the planned Advanced Particle-physics Telescope, so the authors present the test as a tool for future observations rather than a resolution of the current debate.
Load-bearing premise
The load-bearing premise is that the pulsar population behind the GCE can be modelled as a set of identical, steady point sources emitting at a single constant photon rate (Section 3, Eq. 11); in reality the source-count distribution is poorly constrained, and a bright tail of sources or intrinsic flaring—which the authors acknowledge as a concern in Section 5—would change both the event rates and the detector sensitivity needed to see the predicted flashes.
Editorial extensions
If this is right
- If a small population of ~500 bright MSPs produces the excess, a detector with about 26 times Fermi-LAT's effective area could detect caustic-crossing flashes, but such events are expected only once every ~1500 years.
- If the population is intermediate (~5000 sources), a ~200x sensitivity detector would see one microlensing flash every ~150 years, while a ~18,000x detector would see several per year for the 100,000-source case—though each flash from faint sources is very hard to catch.
- A single clean detection of the predicted twin-peak lightcurve would break the degeneracy between dark matter and pulsar interpretations, and the observed event rate would constrain the number of MSPs contributing to the excess.
- Because the test looks at time variability rather than sky templates, it avoids the main systematic that has plagued spatial and spectral studies: mismodelling of the diffuse background and of the source template.
Reading between the lines
- The same size-discrimination argument could be turned around: even before reaching the detection thresholds, a decade-long gamma-ray lightcurve of the bulge with a future detector could place an upper limit on the compact-source fraction of the GCE from the absence of flicker, making a null result physically informative.
- The thresholds are sensitive to the assumed 3.5% caustic-crossing fraction and to the binary fraction of lenses; if the true binary fraction is closer to the 23% found in recent population fits, caustic-crossing events would be several times more common, lowering the sensitivity needed for the bright-population cases.
- A matched-filter search over the full lightcurve, rather than a sliding 3-day Poisson window, might recover the faint caustic-crossing peaks at lower sensitivity than the paper's thresholds, since it would use the known twin-peak shape; this is a testable modelling improvement not explored in the paper.
- The same method could be applied to unresolved source populations elsewhere in the Galaxy, such as globular clusters or the Galactic plane, where future detectors could use microlensing flicker to measure the compact-object content independently of spectral template fits.
Signed reviews
Editorial analysis
A structured set of objections, weighed in public.
Referee Report
Summary. This paper proposes a new observational test of the origin of the Galactic Centre gamma-ray excess (GCE). If the GCE arises from a population of millisecond pulsars, gravitational microlensing by stellar-mass lenses along the bulge line of sight will produce time-dependent magnifications, including rare caustic-crossing spikes with peak magnification about 8700; if the GCE arises from smooth dark-matter annihilation, the emission is extended on AU scales and effectively immune. The authors model three source populations (Ns = 1e5, 500, 5000), simulate lens configurations and Poisson photon light curves, and compute the detector sensitivity (scaled by a relative to Fermi-LAT) needed to identify microlensing events. They find that Fermi-LAT cannot detect these events and that even the proposed APT (log10 a about 1) is insufficient; for a bright 500-source population, caustic-crossing events could be seen with log10 a about 1.4 but are extremely rare, and for a faint 1e5-source population detection would need log10 a about 4.3. The paper concludes that microlensing is not a near-term discriminator but could constrain point-source populations in future observations.
Significance. The proposed test is conceptually novel and forward-modeled from standard microlensing physics. The distinction between point-like MSP emission and extended emission via finite-source magnification is physically sound, and the conclusion that current and near-future instruments lack sensitivity is robust to the quantitative errors discussed below. The paper provides a clearly described simulation pipeline (source placement, binary-lens caustic-crossing light curves, Poisson significance tests) and gives explicit detection thresholds. It also candidly acknowledges limitations: identical-source assumption, unknown source-count distribution, intrinsic flaring, and look-elsewhere corrections. However, the quantitative event rates rest on internally inconsistent lens parameters, so the numerical predictions in Sections 4.2.1 and 4.2.2 and the abstract's 'multiple times a year' statement need correction; the central methodological claim is not invalidated.
major comments (3)
- [Section 4.1, Table 1 and Eq. (17)] The lens population in Table 1 is internally inconsistent with the stated optical depth. For a circular region of radius R_region = 4e7 R_E, the optical depth is tau = N_lens / (R_region/R_E)^2; with N_lens = 6.3e4 this gives tau about 4e-11, not 3e-6. Matching tau = 3e-6 requires N_lens about 4.8e9. The simulations therefore do not generate a lens distribution that realizes the assumed optical depth, and the event rates computed from Eq. (17) and the counts in Figure 7 are not grounded in the simulated lens field.
- [Section 2.2 and Table 1; Eq. (15)] The stated conversion of the lens velocity is wrong by a factor of about 20. With R_E = 8.1 au for a solar-mass lens, v = 200 km/s corresponds to 0.0143 R_E/day, not 0.28 R_E/day. This overestimates the swept-area factor in Eq. (15), which also appears to be evaluated as 74 rather than about 36 given the stated inputs. The error propagates into Eq. (17), so all event-rate claims—the CC rates of one per 1500 and 150 years in Section 4.2.1, the per-century color bars in Figure 7, and the abstract's statement that a large population would produce 'events multiple times a year'—must be recomputed.
- [Section 4.2.1] Even using the published Table 1 inputs, the quoted CC event rates do not follow from Eq. (17). For Ns = 500, y = 2, tau = 3e-6, v = 0.28 R_E/day, and DeltaT = 11 years, Eq. (17) gives about 2 events with y < 2 in the survey, or about 0.07 CC events after the 3.5% fraction; this corresponds to one CC per about 150 years, not one per 1500 years. The analogous discrepancy affects the Ns = 5000 rate. The rates need to be reconciled with the equations and with the corrected velocity and lens-number inputs; the detection thresholds in Figure 6 are less affected because they use injected events, but they do not rescue the event-rate claims.
minor comments (5)
- [Section 3, Eq. (15)] The fiducial value 74 for the swept-area factor is not consistent with v = 200 km/s and R_E = 8.1 au; please state the actual numeric value and use it consistently throughout.
- [Section 4.2.1] The relationship between the 70-day in-caustic plateau magnification of 'an order of magnitude' and the caustic-crossing spikes with mu about 8700 should be clarified; the detection algorithm appears to use only the two peaks, while the rate statement about 4 photons in a 70-day period uses the plateau.
- [Figure 1] Figure 1 would benefit from labeling which panel corresponds to the q = 1, s = 1 configuration used in all CC simulations, since the reader cannot otherwise identify the lightcurve shape adopted in Section 4.
- [Section 4.2.2, Case 1] The text refers to 'Figure 5' for the minimum log10(a) as a function of maximum magnification, but the actual figure is Figure 7; correct the cross-reference.
- [Table 1 and Section 4.1, step 3] The stated threshold ymax = 4 R_E yields a maximum single-lens magnification of about 1.006, i.e. a 0.6% enhancement, not 'approximately 6%'; please correct the numerical value.
Circularity Check
No significant circularity: the derivation is forward-modeled from standard microlensing physics and literature-based source populations.
full rationale
The paper does not fit a parameter to a target conclusion and then rename it a prediction. Its central derivation chain is forward: standard point-mass and binary-lens magnification equations (Eqs. 2-9) are combined with literature-based source populations (Gautam et al. 2022; Lee et al. 2016) and externally measured microlensing event statistics (OGLE/MACHO binary and caustic-crossing fractions) to simulate lightcurves (Section 4.1), and only then are detector-sensitivity thresholds extracted by Poisson-significance logistic fits (Section 4.2). The claimed thresholds log10(a)=1.41, 2.31, 4.26 are derived from injected lightcurves, not from the assumed Ns values alone. The MSP peak magnification ~8700 is imported from observed OGLE caustic events via Eq. (10), so it is an external input, not a fitted output. Self-citations to List et al. (2020, 2021, 2025) appear only in the GCE literature review and do not carry the lensing derivation. The numerical inconsistencies in the lens velocity and lens-number normalization (Table 1 vs Eq. 3/optical depth) are correctness/consistency concerns, not circularity: correcting them would change event-rate numbers but would not make the derivation depend on its own conclusion. The paper's own caveats about source-count distribution, intrinsic flaring, and look-elsewhere effects are acknowledged uncertainties rather than hidden circular inputs. No equation is defined in terms of the quantity it is supposed to predict.
Assumptions & free parameters
free parameters (9)
- Microlensing optical depth τ =
3×10^-6
- Number of GCE sources Ns (Case 1) =
10^5
- Number of GCE sources Ns (Case 2) =
500
- Number of GCE sources Ns (Case 3) =
5000
- Binary lens fraction =
6%
- Caustic-crossing fraction among binaries =
70%
- CC configuration parameters q, s =
1, 1
- Peak CC magnification µMSP =
~8700
- Detectable impact parameter limit ymax =
4 RE
assumptions (7)
- standard math Standard point-mass and binary microlensing equations (Eqs. 2-10)
- domain assumption The GCE is either smooth dark matter annihilation or a population of unresolved MSPs
- domain assumption MSP gamma-ray emission is point-like on au scales (source radius ~10 km)
- domain assumption Dark matter annihilation emission is smooth on au scales
- domain assumption Lenses are uniformly distributed in a 2D plane with the adopted optical depth
- domain assumption Source-count normalizations from Gautam et al. (2022) and Lee et al. (2016) apply
- domain assumption Advanced Particle-astrophysics Telescope will provide log10(a)=1 sensitivity improvement
Cite this review
Pith. "Pith review of Gravitational Microlensing of the Galactic Centre $\gamma$-Ray Excess: A New Test for Point-Like or Extended Emission?." pith.science (2026). https://pith.science/paper/3PPFP2R5
@misc{pith2026250819577,
  author       = {Pith},
  title        = {Pith review of: Gravitational Microlensing of the Galactic Centre $\gamma$-Ray Excess: A New Test for Point-Like or Extended Emission?},
  year         = {2026},
  howpublished = {\url{https://pith.science/paper/3PPFP2R5}},
  note         = {Machine review of arXiv:2508.19577}
}
abstract
We present a potential test of the origin of the $\gamma$-ray Galactic Centre Excess (GCE). We demonstrate how gravitational microlensing by stellar mass objects along the line of sight to the Galactic Bulge can distinguish between the possibility of extensive emission due to dark matter self-annihilation from more prosaic astrophysical sources, namely millisecond pulsars. Such an astrophysical origin would result in emission from a population of small, currently unresolved point-like sources - in contrast to the expected smoother emission resulting from dark matter annihilation. Given that the scale of gravitational microlensing, that is, the Einstein radius for stellar mass lenses, and hence, the degree of induced magnification, is sensitive to the size of the emitting region, such microlensing will induce time variability in the emission of astrophysical sources, whereas $\gamma$-ray emission from dark matter annihilation will effectively be immune to such influences. However, we find that detecting microlensing-induced variability requires significantly greater sensitivity than that of current or planned $\gamma$-ray detectors. For a small population of bright GCE sources, more than an order-of-magnitude increase in effective area over Fermi-LAT would be required, with events remaining extremely rare. For a large population of faint sources, events would occur multiple times a year, but would only be detectable with a four-order-of-magnitude improvement. Whilst microlensing might not be a definitive test of the origin of the GCE, in future observations, it may prove useful in determining the properties of any point-like source population.
Figures


Figures from the paper (4 more)



Reference graph
Works this paper leans on
-
[1]
Abazajian, K. N. 2011, J. Cosmology Astropart. Phys., 2011, 010
2011
-
[2]
N., Canac, N., Horiuchi, S., & Kaplinghat, M
Abazajian, K. N., Canac, N., Horiuchi, S., & Kaplinghat, M. 2014, Phys. Rev. D, 90, 023526
work page 2014
- [3]
- [4]
- [5]
-
[6]
Alcock, C., Allsman, R. A., Alves, D., et al. 2000, ApJ, 541, 270
work page 2000
-
[7]
B., Abdo, A
Atwood, W. B., Abdo, A. A., Ackermann, M., et al. 2009, ApJ, 697, 1071
2009
-
[8]
Bartels, R., Krishnamurthy, S., & Weniger, C. 2016, Phys. Rev. Lett., 116, 051102
work page 2016
Show all 65 references
-
[9]
2018, Nature Astronomy, 2, 819
Bartels, R., Storm, E., Weniger, C., & Calore, F. 2018, Nature Astronomy, 2, 819
2018
- [10]
-
[11]
E., & Seljak, U
Bayer, A. E., & Seljak, U. 2020, J. Cosmology Astropart. Phys., 2020, 009
2020
-
[12]
2022, in 37th International Cosmic Ray Conference, 655
Buckley, J., Adapt, Alnussirat, S., et al. 2022, in 37th International Cosmic Ray Conference, 655
2022
-
[13]
L., Safdi, B
Buschmann, M., Rodd, N. L., Safdi, B. R., et al. 2020, Phys. Rev. D, 102, 023023
2020
-
[14]
Calore, F., Cholis, I., & Weniger, C. 2015, J. Cosmology Astropart. Phys., 2015, 038
2015
-
[15]
2021, Phys
Calore, F., Donato, F., & Manconi, S. 2021, Phys. Rev. Lett., 127, 161102, publisher: American Physical Society
2021
-
[16]
Caron, S., Eckner, C., Hendriks, L., et al. 2023, J. Cosmology Astropart. Phys., 2023, 013
2023
-
[17]
A., Hendriks, L., & Ruiz de Austri, R
Caron, S., Gómez-Vargas, G. A., Hendriks, L., & Ruiz de Austri, R. 2018, J. Cosmology Astropart. Phys., 2018, 058
2018
-
[18]
J., Mishra-Sharma, S., Lisanti, M., et al
Chang, L. J., Mishra-Sharma, S., Lisanti, M., et al. 2020, Phys. Rev. D, 101, 023014
2020
-
[19]
A., Scott, P., Trotta, R., & Lewis, G
Clark, H. A., Scott, P., Trotta, R., & Lewis, G. F. 2018, J. Cosmology Astropart. Phys., 2018, 060
2018
-
[20]
2020, MN- RAS, 495, 3350
Coleman, B., Paterson, D., Gordon, C., Macias, O., & Ploeg, H. 2020, MN- RAS, 495, 3350
2020
-
[21]
P., Hooper, D., et al
Daylan, T., Finkbeiner, D. P., Hooper, D., et al. 2016, Physics of the Dark Universe, 12, 1
2016
-
[22]
T., & Slatyer, T
Dinsmore, J. T., & Slatyer, T. R. 2022, J. Cosmology Astropart. Phys., 2022, 025
2022
-
[23]
S., & Petters, A
Gaudi, B. S., & Petters, A. O. 2002, ApJ, 574, 970
2002
-
[24]
M., Ferrario, L., et al
Gautam, A., Crocker, R. M., Ferrario, L., et al. 2022, Nature Astronomy, 6, 703
2022
-
[25]
2009, arXiv e-prints, arXiv:0910.2998
Goodenough, L., & Hooper, D. 2009, arXiv e-prints, arXiv:0910.2998
2009 arXiv
-
[26]
2013, Phys
Gordon, C., & Macías, O. 2013, Phys. Rev. D, 88, 083521
2013
-
[27]
K., Gould, A., et al
Han, C., Jung, Y. K., Gould, A., et al. 2023, A&A, 672, A8
2023
-
[28]
M., & Slatyer, T
Hooper, D., Cholis, I., Linden, T., Siegal-Gaskins, J. M., & Slatyer, T. R. 2013, Phys. Rev. D, 88, 083009
2013
-
[29]
2011, Physics Letters B, 697, 412
Hooper, D., & Goodenough, L. 2011, Physics Letters B, 697, 412
2011
-
[30]
2011, Phys
Hooper, D., & Linden, T. 2011, Phys. Rev. D, 84, 123005
2011
-
[31]
2002, Acta Astron., 52, 39
Jaroszynski, M. 2002, Acta Astron., 52, 39
2002
-
[32]
2004, Acta Astron., 54, 103
Jaroszynski, M., Udalski, A., Kubiak, M., et al. 2004, Acta Astron., 54, 103
2004
-
[33]
2006, Acta Astron., 56, 307 Jaroszyński, M., Skowron, J., Udalski, A., et al
Jaroszynski, M., Skowron, J., Udalski, A., et al. 2006, Acta Astron., 56, 307 Jaroszyński, M., Skowron, J., Udalski, A., et al. 2010, Acta Astron., 60, 197
2006
-
[34]
2024, ApJ, 968, 44
Joffre, S., Torres-Albà, N., Ajello, M., Kocevski, D., & Buehler, R. 2024, ApJ, 968, 44
2024
-
[35]
Kuang, R., Mao, S., Wang, T., Zang, W., & Long, R. J. 2021, MNRAS, 503, 6143
2021
-
[36]
K., & Slatyer, T
Leane, R. K., & Slatyer, T. R. 2019, arXiv e-prints, arXiv:1904.08430 —. 2020a, Phys. Rev. Lett., 125, 121105 —. 2020b, Phys. Rev. D, 102, 063019
2019 arXiv
-
[37]
K., Lisanti, M., Safdi, B
Lee, S. K., Lisanti, M., Safdi, B. R., Slatyer, T. R., & Xue, W. 2016, Phys. Rev. Lett., 116, 051103
2016
-
[38]
Lewis, G. F. 2004, MNRAS, 355, 106
2004
-
[39]
L., Safdi, B
Linden, T., Rodd, N. L., Safdi, B. R., & Slatyer, T. R. 2016, Phys. Rev. D, 94, 103013
2016
-
[40]
L., Schoen, E., & W olf, F
List, F., Park, Y., Rodd, N. L., Schoen, E., & W olf, F. 2025, arXiv e-prints, arXiv:2507.17804
2025
-
[41]
L., & Lewis, G
List, F., Rodd, N. L., & Lewis, G. F. 2021, Phys. Rev. D, 104, 123022
2021
-
[42]
L., Lewis, G
List, F., Rodd, N. L., Lewis, G. F., & Bhat, I. 2020, Phys. Rev. Lett., 125, 241102
2020
-
[43]
Malyshev, D. V. 2025, Phys. Rev. D, 111, 043033
2025
-
[44]
2024, Phys
Manconi, S., Calore, F., & Donato, F. 2024, Phys. Rev. D, 109, 123042
2024
-
[45]
D., Zhong, Y.-M., & Cholis, I
McDermott, S. D., Zhong, Y.-M., & Cholis, I. 2023, MNRAS, 522, L21
2023
-
[46]
2022, Phys
Mishra-Sharma, S., & Cranmer, K. 2022, Phys. Rev. D, 105, 063017
2022
-
[47]
L., & Safdi, B
Mishra-Sharma, S., Rodd, N. L., & Safdi, B. R. 2017, AJ, 153, 253
2017
-
[48]
2024, Symmetry, 16, 201
Misiaszek, M., & Rossi, N. 2024, Symmetry, 16, 201
2024
-
[49]
2020, Annual Review of Nuclear and Particle Science, 70, 455
Murgia, S. 2020, Annual Review of Nuclear and Particle Science, 70, 455
2020
-
[50]
M., Silk, J., Libeskind, N
Muru, M. M., Silk, J., Libeskind, N. I., Gottlöber, S., & Hoffman, Y. 2025, arXiv e-prints, arXiv:2508.06314
2025 arXiv
-
[51]
F., Frenk, C
Navarro, J. F., Frenk, C. S., & White, S. D. M. 1997, ApJ, 490, 493 O’Leary, R. M., Kistler, M. D., Kerr, M., & Dexter, J. 2015, arXiv e-prints, arXiv:1504.02477
1997 arXiv
-
[52]
1986, ApJ, 304, 1 —
Paczynski, B. 1986, ApJ, 304, 1 —. 1991, ApJ, 371, L63 12 Nada Salama et al. Petrović, J., Serpico, P. D., & Zaharijas, G. 2015, J. Cosmology Astropart. Phys., 2015, 023
1986
-
[53]
Ploeg, H., Gordon, C., Crocker, R., & Macias, O. 2020, J. Cosmology As- tropart. Phys., 2020, 035
2020
-
[54]
Schneider, P., Ehlers, J., & Falco, E. E. 1992, Gravitational Lenses (Springer), doi:10.1007/978-3-662-03758-4
1992 doi
-
[55]
2007, Acta Astron., 57, 281
Skowron, J., Jaroszynski, M., Udalski, A., et al. 2007, Acta Astron., 57, 281
2007
-
[56]
2024, MNRAS, 530, 4395
Song, D., Eckner, C., Gordon, C., et al. 2024, MNRAS, 530, 4395
2024
-
[57]
R., Udalski, A., et al
Sumi, T., W oźniak, P. R., Udalski, A., et al. 2006, ApJ, 636, 240
2006
-
[58]
P., Bond, I
Sumi, T., Bennett, D. P., Bond, I. A., et al. 2013, ApJ, 778, 150
2013
-
[59]
1997, MNRAS, 284, 172
Wambsganss, J. 1997, MNRAS, 284, 172
1997
-
[60]
Witt, H. J. 1990, A&A, 236, 311
1990
-
[61]
J., & Mao, S
Witt, H. J., & Mao, S. 1995, ApJ, 447, L105
1995
-
[62]
2015, ApJ, 802, 124
Yuan, Q., & Ioka, K. 2015, ApJ, 802, 124
2015
-
[63]
2016, ApJS, 225, 18
Zechlin, H.-S., Cuoco, A., Donato, F., Fornengo, N., & Vittino, A. 2016, ApJS, 225, 18
2016
-
[64]
2024, Phys
Zhong, Y.-M., & Cholis, I. 2024, Phys. Rev. D, 109, 123017
2024
-
[65]
D., Cholis, I., & Fox, P
Zhong, Y.-M., McDermott, S. D., Cholis, I., & Fox, P. J. 2020, Phys. Rev. Lett., 124, 231103
2020
Reviewed August 15, 2026 · model on record in the stance chip above.
Discussion (0). Continue with ORCID to comment.