REVIEW 3 major objections 5 minor 1 cited by
Detection of 'super-virial' gas in the Circumgalactic medium of the Milky Way towards PKS 2155-304
T0 review · 3 major / 5 minor · reviewed 2026-08-05 · deepseek-v4-flash
Pith's one-line read This paper reports the first simultaneous detection of four distinct highly ionized gas phases in the Milky Way's circumgalactic medium toward the blazar PKS 2155-304, including the first Mg XII K-alpha absorption line ever seen in the Milk
desk verdict A careful, incremental extension of the super-virial CGM program whose strong conclusions rest on two ~2-sigma line detections, one of which conflicts with a more sensitive instrument's upper limit. read the letter →
The pith
A machine-rendered reading of the paper's core claim, the machinery that carries it, and where it could break.
The reading
What carries the argument
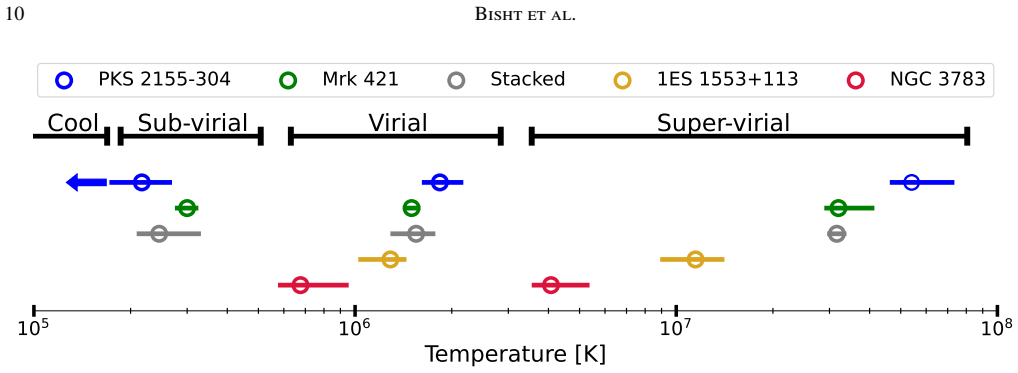
The PHASE model: a hybrid collisional-plus-photoionization spectral model that produces Voigt absorption profiles, with free parameters for temperature, equivalent hydrogen column density, elemental abundances (each allowed to vary relative to oxygen), non-thermal broadening, photoionization parameter U, and redshift. With U frozen at its lowest value (10^-3.9), the model simultaneously fits all detected and non-detected lines and decomposes them into three phases: sub-virial, virial, and super-virial. The fourth, cool phase is inferred from the model-independent temperature estimate obtained from the column-density ratio of the O V non-detection to the O IV detection, which places an upper
What would settle it
Take the same Chandra and XMM-Newton spectra and fit them with a non-equilibrium cooling model, or allow the photoionization parameter to float: if a good fit can be obtained without the 5×10^7 K phase, the super-virial interpretation fails. Alternatively, with a future high-resolution X-ray spectrometer, resolve the Mg XII and Si XIV line profiles: if their Doppler b parameters exceed the thermal value at 5×10^7 K by more than the errors, the line widths are dominated by turbulence and the temperature inference collapses.
Extended reading notes
Core claim
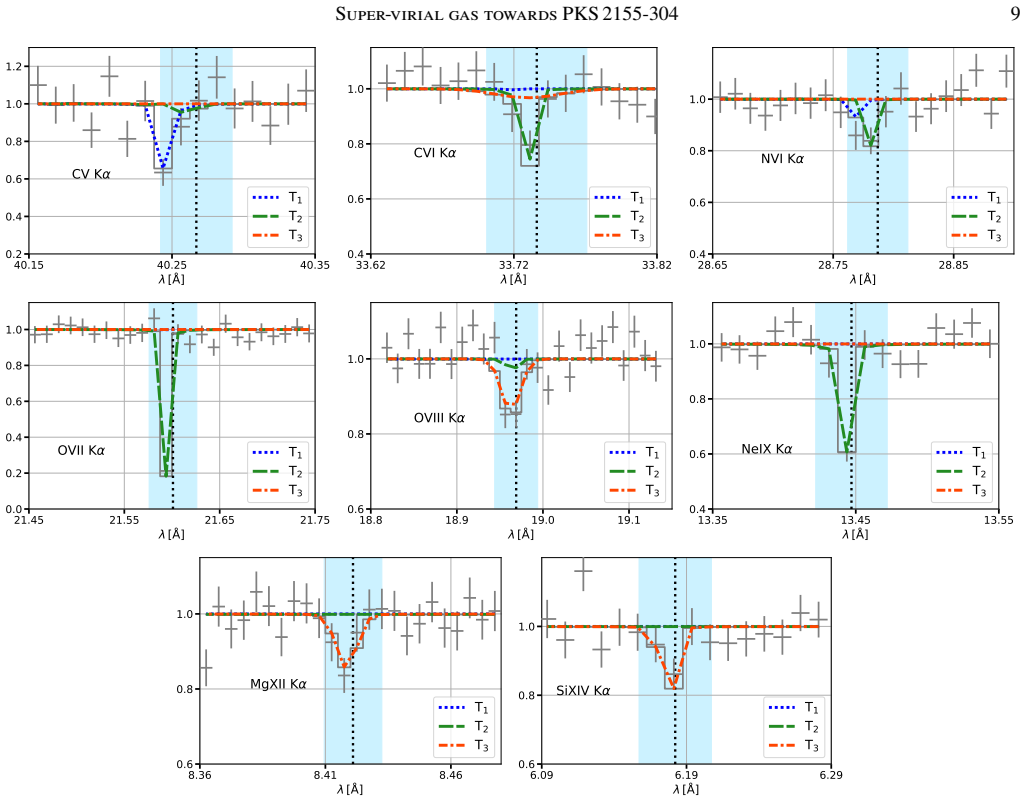
On its own terms, this paper establishes that the z=0 X-ray absorption spectrum of PKS 2155-304 contains at least three, and likely four, thermally distinct phases of the Milky Way's circumgalactic medium. The Mg XII K-alpha absorption line at 8.421 Å, detected at 2.4 sigma with equivalent width 1.47±0.59 mÅ in the ACIS-MEG data, together with the Si XIV line in HRC-LETG, provides the first X-ray absorption evidence of a hot phase at about 5×10^7 K at a southern Galactic latitude. The authors argue that the column-density ratios of adjacent H-like and He-like ions (C VI/C V, O VIII/O VII, Si XIV/Si XIII, and others), under collisional ionization equilibrium, yield temperatures with clear val
Load-bearing premise
The temperature and phase separation rest on the assumption that the absorbing gas is in collisional ionization equilibrium with negligible photoionization, so measured ratios of adjacent ions translate directly into temperatures; non-equilibrium cooling, significant photoionization, or unresolved non-thermal broadening would change the inferred temperatures and could merge or remove the phases.
Editorial extensions
If this is right
- The super-virial gas at roughly 5×10^7 K exists at southern Galactic latitudes, so it is not a northern-sky artifact; models of the Milky Way's CGM must reproduce this hot phase as a global, inhomogeneous component.
- Mg XII K-alpha can now be used as a new tracer of the hottest CGM phase in other sightlines, extending the diagnostic suite beyond O VII, O VIII, Ne X, and Si XIV.
- The coexistence of four phases with temperature valleys between them supports a multi-peaked (log-normal) temperature distribution in the CGM, consistent with multiphase gas expected from feedback and accretion.
- The kinematic pattern of blue-shifted low-ionization lines (v ≈ -100 km/s), consistent-with-zero virial lines, and red-shifted hot lines indicates simultaneous infall of cool gas, a quasi-static virial phase, and outflow of the super-virial phase along this line of sight.
- The alpha-enhancement and super-solar abundances in the virial and super-virial phases require a nucleosynthetic source (core-collapse supernovae) that enriches the CGM unevenly, with the hot phase enriched in Mg and Si while the virial phase is enriched in C and Ne.
Reading between the lines
- Because the inferred super-virial column density toward PKS 2155-304 (N_H ≈ 2.5×10^21 cm^-2) is an order of magnitude larger than along previous sightlines, and the sky position is only about 17.7 degrees in Galactic longitude, an extension of the paper's logic is that this line of sight catches an overdense patch or an outflow preferentially directed from the Galactic center; stacking surveys sho
- The paper fixes the photoionization parameter U at 10^-3.9 and does not report a test with U free; a testable extension is to re-fit the same spectra with U as a free parameter and check whether a photoionized warm component can replace the sub-virial phase without erasing the super-virial detection.
- The Mg XII and Si XIV detections are at the 2-3 sigma level, so a clean confirmation would come from re-observing the same sightline with a future high-resolution X-ray calorimeter at higher signal-to-noise, resolving the line profiles and measuring both the Doppler temperature and the actual absorption shape.
- If the hot phase is truly super-virial and alpha-enhanced, its cooling time is long; a direct extension is that the same phase should be visible in absorption in the halos of external galaxies with similar column densities and relative abundances, which would make the 'super-virial' CGM a generic feature of star-forming galaxies.
Editorial analysis
A structured set of objections, weighed in public.
Referee Report
Summary. This paper analyzes all available Chandra (ACIS-MEG, ACIS-LETG, HRC-LETG) and XMM-Newton (RGS1/RGS2) grating spectra toward PKS 2155-304 to search for z=0 X-ray absorption lines from H- and He-like C, N, O, Ne, Mg, and Si. It reports detections (significance >2σ) of C V, C VI, N VI, O IV, O VII (Kα/β), O VIII, Ne IX, and the first Mg XII Kα detection in the Milky Way CGM, plus a 2.1σ Si XIV detection. From CIE column-density ratios and a three-phase PHASE model, the paper infers four temperature phases: cool (<1.7×10^5 K), sub-virial (2.2×10^5 K), virial (1.8×10^6 K), and super-virial (5.4×10^7 K). It derives non-solar abundances, interprets low-ionization blueshifts and high-ionization redshifts as inflow/outflow, and emphasizes that this sightline lies at southern Galactic latitude (b=-52.2°), extending previous northern detections.
Significance. If the Mg XII and Si XIV detections are real, this is a valuable result: it provides the first southern-hemisphere X-ray absorption evidence for a ~5×10^7 K CGM phase, introduces Mg XII as a tracer, and gives a four-phase temperature ladder that constrains CGM structure. The paper merits credit for combining all archival grating data, comparing with UV O VI and C IV measurements, and checking ISM contamination using XRB sightlines. However, the central super-virial claim rests on two marginal line detections and on instrument choices made after inspecting multiple datasets. The statistical foundation of the main claim is therefore not yet established at the level asserted in the abstract and conclusions.
major comments (3)
- [§2.2, Table 1, Table 3] The T3=5.4×10^7 K phase in Table 3 is carried by exactly two line detections: Mg XII Kα (ACIS-MEG, EW=1.47±0.59 mÅ, 2.4σ) and Si XIV Kα (HRC-LETG, EW=3.73±1.75 mÅ, 2.1σ). The paper adopts a >2σ detection threshold while searching ~10 ions × 5 instruments. Under Gaussian noise, ~50 trials at a 2σ cut are expected to produce ~2.5 spurious detections, i.e. the two lines that define T3 are exactly the marginal cases expected from noise. The authors need a trials-corrected significance, a blind false-positive simulation, or a joint fit of all five instruments to these lines. Without such a test, the super-virial phase is not securely detected.
- [§2.2-2.3, Tables 1-2] The instrument selection is post hoc and, for Si XIV, inconsistent with the most sensitive instrument. The adopted HRC-LETG Si XIV EW (3.73 mÅ) is not confirmed by ACIS-MEG, which gives a 3σ upper limit of <2.6 mÅ; ACIS-LETG gives <2.5 mÅ. At face value the instrument with the best sensitivity at 6.18 Å excludes the adopted value, and the statement in §2.2 that the non-detections are 'consistent with detection within 1σ' is not supported by the quoted numbers. Similar post hoc choices are made for O VII (ACIS-LETG adopted over larger RGS1/MEG EWs) and Mg XI (MEG upper limit adopted over the RGS2 5.7±1.7 mÅ detection). A pre-specified selection rule or a simultaneous fit to all instruments is required before the phase decomposition can be trusted.
- [§2.3-2.4] The cool phase (<1.7×10^5 K) is inferred from a single ratio of one detection (O IV) to one non-detection (O V), under CIE and the assumption that both ions trace the same phase. That ratio is not unique to a thermal plasma: photoionized or recombining gas can produce the same O IV/O V constraint at different temperatures. Similarly, the PHASE model freezes U=10^-3.9 without testing the sensitivity of the inferred T1/T2/T3 values to this assumption. The statement that the model 'successfully reproduces the column densities' is not an independent check, since the same data were used for the fit. These modeling uncertainties are secondary to the statistical issue above, but they affect the four-phase interpretation.
minor comments (5)
- [Tables 1-2] N VII Kα is listed as detected in ACIS-LETG (3.2±1.4 mÅ) in Table 1, but Table 2 uses the HRC-LETG upper limit (<5.26 mÅ) with no explanation. Please clarify which measurement is used and why.
- [§2.4] The χ2/dof values in the F-test paragraph (5156.53/5617, 5156.55/5618) are not consistent with the final fit χ2/dof of 5156.53/5603 quoted earlier in the same section; a one-parameter freeze should change dof by 1, not 14. Please recompute or correct.
- [§2.4 vs §4, Fig. 7] The text reports that the hot-phase line-of-sight velocity is consistent with zero, yet §4 and Fig. 7 discuss the hot gas as outflowing/redshifted. These statements should be reconciled.
- [General] Typographical: 'Sixiii' should read 'Si xiii'; Fig. 7 axis label 'OVI,CIV' needs formatting; Fig. 2 caption is difficult to parse for the dashed magenta/purple lines.
- [§3.2] Confidence levels for previous sightline parameters are mixed (1σ, 90%, 99.73%) when comparing with the 1σ values of this work; please use consistent confidence levels for quantitative comparisons.
Circularity Check
No significant circularity: the detections, column densities, and temperature inferences are derived from the measured grating spectra; self-citations are contextual and not load-bearing.
full rationale
The paper's derivation chain is: co-add archival grating spectra; measure absorption-line equivalent widths; convert EWs to column densities; use column-density ratios under collisional ionization equilibrium (CIE) to estimate temperatures; and fit the PHASE model to all detected and non-detected lines. None of these steps defines its conclusion in terms of its inputs. In Sec. 2.3, the model-independent temperatures are conditional inferences from measured ratios (e.g., C VI/C V, O VIII/O VII, Si XIV/Si XIII) under stated CIE assumptions; they are not identities. In Sec. 2.4, the PHASE model parameters are free and fitted to the data; the statement that the final model 'successfully reproduces' observed column densities is a goodness-of-fit description after fitting, not an independent prediction. The paper explicitly rejects simpler models on chi-square grounds, so the four-phase structure is not imposed by construction. The comparisons with UV O VI and C IV from Collins et al. (2004) are external benchmarks not used in the X-ray fit, so their consistency is a genuine, non-circular check. The self-citation to Das (2024) for negligible non-thermal broadening supports a modeling assumption, but it is not the mechanism that produces the super-virial temperature, which is mainly constrained by the high-ionization lines and the PHASE fit. The principal scientific weakness, that Mg XII (2.4 sigma) and Si XIV (2.1 sigma) are marginal detections, is a statistical robustness concern, not a circularity concern. Therefore no circular step meets the required evidence bar.
Assumptions & free parameters
free parameters (8)
- T1 (sub-virial phase temperature) =
2.2±0.5e5 K
- T2 (virial phase temperature) =
1.8+0.3-0.2e6 K
- T3 (super-virial phase temperature) =
5.4+1.9-0.8e7 K
- N_H1, N_H2, N_H3 (equivalent H column densities) =
1.9e18, 8.8e18, 2.5e21 cm^-2
- [C/O] and [N/O] in PHASE_A =
0.23+0.24-0.16 and 0.35+0.30-0.42
- [Ne/O] in PHASE_A =
1.02+0.28-0.27
- [Mg/O] and [Si/O] in PHASE_B =
0.43+0.21-0.29 and 0.93+0.22-0.40
- [O/Fe], [Ne/Fe], [Mg/Fe], [Si/Fe] =
lower limits (e.g., >1.0, >0.72, >1.43, >1.93)
assumptions (5)
- domain assumption The absorbing gas is in collisional ionization equilibrium (CIE)
- domain assumption Photoionization is negligible (U frozen at 1e-3.9)
- domain assumption The absorption is at z=0 (Milky Way CGM), not at the blazar redshift or in the Galactic disk ISM
- domain assumption Line broadening is purely thermal (non-thermal broadening insignificant)
- standard math Abundance ratios are measured relative to the solar abundance standard
Cite this review
Pith. "Pith review of Detection of 'super-virial' gas in the Circumgalactic medium of the Milky Way towards PKS 2155-304." pith.science (2026). https://pith.science/paper/CVKQXW5T
@misc{pith2026250902019,
  author       = {Pith},
  title        = {Pith review of: Detection of 'super-virial' gas in the Circumgalactic medium of the Milky Way towards PKS 2155-304},
  year         = {2026},
  howpublished = {\url{https://pith.science/paper/CVKQXW5T}},
  note         = {Machine review of arXiv:2509.02019}
}
abstract
We present the first simultaneous detection of four distinct highly ionized $z=0$ absorbing phases using Chandra and XMM-Newton grating spectra toward the blazar PKS 2155$\hbox{-}$304. We detect the MgXII K$\alpha$ absorption line for the first time in the circumgalactic medium (CGM) of the Milky Way. Along with MgXII K$\alpha$, we detect SiXIV K$\alpha$ absorption, which are the tell-tale signatures of the hot 'super-virial' gas in the CGM. Both from the model-independent calculations and hybrid-ionization modeling, we infer four phases at distinct temperatures, hot 'super-virial' ($5.4^{+1.9}_{-0.8} \times 10^7$ K), warm-hot 'virial' ($1.8^{+0.3}_{-0.2} \times 10^6$ K), warm 'sub-virial' ($2.2\pm 0.5 \times 10^5$ K), and cool phase ($<1.7 \times 10^5$ K). The warm-hot and hot phases are $\alpha$-enhanced, and [C/O] and [Ne/O] are super-solar in the warm-hot phase, while [Mg/O] and [Si/O] are super-solar in the hot phase. The low-ionization lines are blue-shifted (v$_{\rm los} \approx -100$ km s$^{-1}$), whereas the high-ionization lines are red-shifted. It suggests a scenario of infalling sub-virial, quasi-static virial, and outflowing super-virial phases along this sightline. Earlier studies on individual sightlines were confined to the Northern Hemisphere. Our sightline is located in the Southern hemisphere, demonstrating that hot super-virial gas is also present at Southern Galactic latitudes as well. This confirms a more widespread distribution of the super-virial gas across both hemispheres.
Figures


Figures from the paper (4 more)


Forward citations
Cited by 1 Pith paper
-
Studying the absorption signatures of H I Lyman-\alpha\ in the warm-hot circumgalactic medium with TNG50
TNG50 shows coronal broad Lyα absorbers from warm-hot CGM have covering fraction ~0.8 for log N_HI ≥13 and dominate ~50% of CGM H I absorbers around MW-like galaxies.
Reference graph
Works this paper leans on
-
[1]
Arnaud, K., Dorman, B., & Gordon, C. 1999, XSPEC: An X-ray spectral fitting package, Astrophysics Source Code Library, record ascl:9910.005
work page 1999
-
[2]
2023, ApJ, 952, 41, doi: 10.3847/1538-4357/acd337
Bhattacharyya, J., Das, S., Gupta, A., Mathur, S., & Krongold, Y. 2023, ApJ, 952, 41, doi: 10.3847/1538-4357/acd337
-
[3]
Bisht, M. S., Banerjee, P., Nath, B. B., & Shchekinov, Y. 2024a, ApJ, 975, 26, doi: 10.3847/1538-4357/ad77be 14 Bisht et al
-
[4]
Bisht, M. S., Nath, B. B., & Mathur, S. 2024b, ApJ, 975, 49, doi: 10.3847/1538-4357/ad77c0
-
[5]
Bluem, J., Kaaret, P., Kuntz, K. D., et al. 2022, ApJ, 936, 72, doi: 10.3847/1538-4357/ac8662
-
[6]
Collins, J. A., Shull, J. M., & Giroux, M. L. 2004, ApJ, 605, 216, doi: 10.1086/382269
-
[7]
2024, ApJL, 963, L48, doi: 10.3847/2041-8213/ad2a43
Das, S. 2024, ApJL, 963, L48, doi: 10.3847/2041-8213/ad2a43
-
[8]
2021, ApJ, 918, 83, doi: 10.3847/1538-4357/ac0e8e
Das, S., Mathur, S., Gupta, A., & Krongold, Y. 2021, ApJ, 918, 83, doi: 10.3847/1538-4357/ac0e8e
Show all 49 references
-
[9]
2019a, ApJ, 887, 257, doi: 10.3847/1538-4357/ab5846
Das, S., Mathur, S., Gupta, A., Nicastro, F., & Krongold, Y. 2019a, ApJ, 887, 257, doi: 10.3847/1538-4357/ab5846
-
[10]
2019b, ApJL, 882, L23, doi: 10.3847/2041-8213/ab3b09
Das, S., Mathur, S., Nicastro, F., & Krongold, Y. 2019b, ApJL, 882, L23, doi: 10.3847/2041-8213/ab3b09
-
[11]
Donahue, M., & Voit, G. M. 2022, PhR, 973, 1, doi: 10.1016/j.physrep.2022.04.005
2022 doi
-
[12]
Draine, B. T. 2011, Physics of the Interstellar and Intergalactic Medium (Princeton University Press)
2011
-
[13]
S., Sharma, P., et al
Dutta, A., Bisht, M. S., Sharma, P., et al. 2024, MNRAS, 531, 5117, doi: 10.1093/mnras/stae977
2024 doi
-
[14]
J., Soler, J
Elia, D., Evans, N. J., Soler, J. D., et al. 2025, ApJ, 980, 216, doi: 10.3847/1538-4357/adaeb2
2025 doi
-
[15]
E., & Treves, A
Falomo, R., Pesce, J. E., & Treves, A. 1993, ApJL, 411, L63, doi: 10.1086/186913 Faucher-Giguère, C.-A., & Oh, S. P. 2023, ARA&A, 61, 131, doi: 10.1146/annurev-astro-052920-125203 Ferland,G.J.,Chatzikos,M.,Guzmán,F.,etal.2017,RMxAA,53, 385, doi: 10.48550/arXiv.1705.10877
-
[16]
C., Allen, G
Fruscione, A., McDowell, J. C., Allen, G. E., et al. 2006, in Society of Photo-Optical Instrumentation Engineers (SPIE) Conference
2006
-
[17]
6270, Observatory Operations: Strategies, Processes, and Systems, ed
Series, Vol. 6270, Observatory Operations: Strategies, Processes, and Systems, ed. D. R. Silva & R. E. Doxsey, 62701V, doi: 10.1117/12.671760
-
[18]
2018, MNRAS, 474, 696, doi: 10.1093/mnras/stx2776
Gatuzz, E., & Churazov, E. 2018, MNRAS, 474, 696, doi: 10.1093/mnras/stx2776
2018 doi
-
[19]
2021, ApJ, 909, 164, doi: 10.3847/1538-4357/abdbb6
Gupta, A., Kingsbury, J., Mathur, S., et al. 2021, ApJ, 909, 164, doi: 10.3847/1538-4357/abdbb6
2021 doi
-
[20]
2014, Ap&SS, 352, 775, doi: 10.1007/s10509-014-1958-z Gupta,A.,Mathur,S.,Kingsbury,J.,Das,S.,&Krongold,Y.2023, Nature Astronomy, 7, 799, doi: 10.1038/s41550-023-01963-5
Gupta, A., Mathur, S., Galeazzi, M., & Krongold, Y. 2014, Ap&SS, 352, 775, doi: 10.1007/s10509-014-1958-z Gupta,A.,Mathur,S.,Kingsbury,J.,Das,S.,&Krongold,Y.2023, Nature Astronomy, 7, 799, doi: 10.1038/s41550-023-01963-5
2014 doi
- [21]
-
[22]
2017, ApJ, 836, 243, doi: 10.3847/1538-4357/836/2/243
Gupta, A., Mathur, S., & Krongold, Y. 2017, ApJ, 836, 243, doi: 10.3847/1538-4357/836/2/243
2017 doi
-
[23]
2012, ApJL, 756, L8, doi: 10.1088/2041-8205/756/1/L8
Gupta, A., Mathur, S., Krongold, Y., Nicastro, F., & Galeazzi, M. 2012, ApJL, 756, L8, doi: 10.1088/2041-8205/756/1/L8
2012 doi
-
[24]
R., Millman, K
Harris, C. R., Millman, K. J., van der Walt, S. J., et al. 2020, Nature, 585, 357, doi: 10.1038/s41586-020-2649-2
2020 doi
-
[25]
B., & Shelton, R
Henley, D. B., & Shelton, R. L. 2010, ApJS, 187, 388, doi: 10.1088/0067-0049/187/2/388 —. 2013, ApJ, 773, 92, doi: 10.1088/0004-637X/773/2/92
2010 doi
-
[26]
B., Shelton, R
Henley, D. B., Shelton, R. L., Cumbee, R. S., & Stancil, P. C. 2015, ApJ, 799, 117, doi: 10.1088/0004-637X/799/2/117 HI4PI Collaboration, Ben Bekhti, N., Flöer, L., et al. 2016, A&A, 594, A116, doi: 10.1051/0004-6361/201629178
2015 doi
-
[27]
Hunter, J. D. 2007, Computing in Science and Engineering, 9, 90, doi: 10.1109/MCSE.2007.55
2007 doi
-
[28]
2001, A&A, 365, L1, doi: 10.1051/0004-6361:20000036
Jansen, F., Lumb, D., Altieri, B., et al. 2001, A&A, 365, L1, doi: 10.1051/0004-6361:20000036
2001 doi
-
[29]
D., et al
Kaaret, P., Koutroumpa, D., Kuntz, K. D., et al. 2020, Nature Astronomy, 4, 1072, doi: 10.1038/s41550-020-01215-w
2020 doi
-
[30]
S., et al
Krongold, Y., Nicastro, F., Brickhouse, N. S., et al. 2003, ApJ, 597, 832, doi: 10.1086/378639
2003 doi
- [31]
-
[32]
2024a, MNRAS, 531, 3034, doi: 10.1093/mnras/stae1051 —
Lara-DI, A., Krongold, Y., Mathur, S., et al. 2024a, MNRAS, 531, 3034, doi: 10.1093/mnras/stae1051 —. 2024b, MNRAS, 533, 287, doi: 10.1093/mnras/stae1845
-
[33]
2023, ApJ, 946, 55, doi: 10.3847/1538-4357/acbf40
Lara-DI, A., Mathur, S., Krongold, Y., Das, S., & Gupta, A. 2023, ApJ, 946, 55, doi: 10.3847/1538-4357/acbf40
2023 doi
-
[34]
2022, Probing the Circumgalactic Medium with X-Ray Absorption Lines (Singapore: Springer Nature Singapore), 1–36, doi: 10.1007/978-981-16-4544-0_112-1
Mathur, S. 2022, Probing the Circumgalactic Medium with X-Ray Absorption Lines (Singapore: Springer Nature Singapore), 1–36, doi: 10.1007/978-981-16-4544-0_112-1
2022 doi
-
[35]
2017, ApJL, 851, L7, doi: 10.3847/2041-8213/aa991a
Mathur, S., Nicastro, F., Gupta, A., et al. 2017, ApJL, 851, L7, doi: 10.3847/2041-8213/aa991a
2017 doi
-
[36]
L., Mathur, S., Das, S., Krongold, Y., & Gupta, A
McClain, R. L., Mathur, S., Das, S., Krongold, Y., & Gupta, A. 2024, MNRAS, 527, 5093, doi: 10.1093/mnras/stad3497
2024 doi
-
[37]
2018, ApJ, 862, 34, doi: 10.3847/1538-4357/aacceb
Nakashima, S., Inoue, Y., Yamasaki, N., et al. 2018, ApJ, 862, 34, doi: 10.3847/1538-4357/aacceb
2018 doi
-
[38]
2017, A&A, 605, A47, doi: 10.1051/0004-6361/201630336
Nevalainen, J., Wakker, B., Kaastra, J., et al. 2017, A&A, 605, A47, doi: 10.1051/0004-6361/201630336
2017 doi
-
[39]
2016, ApJL, 828, L12, doi: 10.3847/2041-8205/828/1/L12
Nicastro, F., Senatore, F., Krongold, Y., Mathur, S., & Elvis, M. 2016, ApJL, 828, L12, doi: 10.3847/2041-8205/828/1/L12
2016 doi
-
[40]
2002, ApJ, 573, 157, doi: 10.1086/340489
Nicastro, F., Zezas, A., Drake, J., et al. 2002, ApJ, 573, 157, doi: 10.1086/340489
2002 doi
-
[41]
2018, Nature, 558, 406, doi: 10.1038/s41586-018-0204-1
Nicastro, F., Kaastra, J., Krongold, Y., et al. 2018, Nature, 558, 406, doi: 10.1038/s41586-018-0204-1
2018 doi
-
[42]
2023, A&A, 674, A195, doi: 10.1051/0004-6361/202243992
Ponti, G., Zheng, X., Locatelli, N., et al. 2023, A&A, 674, A195, doi: 10.1051/0004-6361/202243992
2023 doi
-
[43]
2025a, ApJ, 982, 8, doi: 10.3847/1538-4357/adb3a5
Roy, M., Mathur, S., Das, S., et al. 2025a, ApJ, 982, 8, doi: 10.3847/1538-4357/adb3a5
-
[44]
2025b, ApJ, 988, 71, doi: 10.3847/1538-4357/ade059
Roy, M., Su, K.-Y., Mathur, S., & Stern, J. 2025b, ApJ, 988, 71, doi: 10.3847/1538-4357/ade059
-
[45]
2023, PASJ, 75, 1324, doi: 10.1093/pasj/psad073
Sugiyama, H., Ueda, M., Fukushima, K., et al. 2023, PASJ, 75, 1324, doi: 10.1093/pasj/psad073
2023 doi
-
[46]
S., & Werk, J
Tumlinson, J., Peeples, M. S., & Werk, J. K. 2017, ARA&A, 55, 389, doi: 10.1146/annurev-astro-091916-055240 Vijayan, A., & Li, M. 2022, MNRAS, 510, 568, doi: 10.1093/mnras/stab3413 Super-virial gas towards PKS 2155-304 15
2017 doi
-
[47]
C., Tananbaum, H
Weisskopf, M. C., Tananbaum, H. D., Van Speybroeck, L. P., & O’Dell, S. L. 2000, in Society of Photo-Optical Instrumentation Engineers (SPIE) Conference Series, Vol. 4012, X-Ray Optics, Instruments, and Missions III, ed. J. E. Truemper & B. Aschenbach, 2–16, doi: 10.1117/12.391545
2000 doi
-
[48]
J., Mathur, S., Nicastro, F., et al
Williams, R. J., Mathur, S., Nicastro, F., et al. 2005, ApJ, 631, 856, doi: 10.1086/431343
2005 doi
-
[49]
Y., et al
Yoshino, T., Mitsuda, K., Yamasaki, N. Y., et al. 2009, PASJ, 61, 805, doi: 10.1093/pasj/61.4.805
2009 doi
Reviewed August 5, 2026 · model on record in the stance chip above.
Discussion (0). Sign in to comment.