REVIEW 4 major objections 5 minor 63 references
Solar Vortices as Conduits for Magnetoacoustic Waves: Multi-Layer Coupling and Their Role in Atmospheric Heating
T0 review · 4 major / 5 minor · reviewed 2026-08-05 · deepseek-v4-flash
Pith's one-line read This paper reports the first direct evidence that solar vortices act as structured waveguides for magnetoacoustic waves, arguing that these compressive waves—not torsional Alfvén waves—dominate energy transport in the lower chromosphere and
desk verdict The qualitative multi-layer waveguide claim is probably right and is the real contribution; the quantitative heating numbers are inflated by a disclosed boundary artifact and should be tempered. read the letter →
The pith
A machine-rendered reading of the paper's core claim, the machinery that carries it, and where it could break.
The reading
What carries the argument
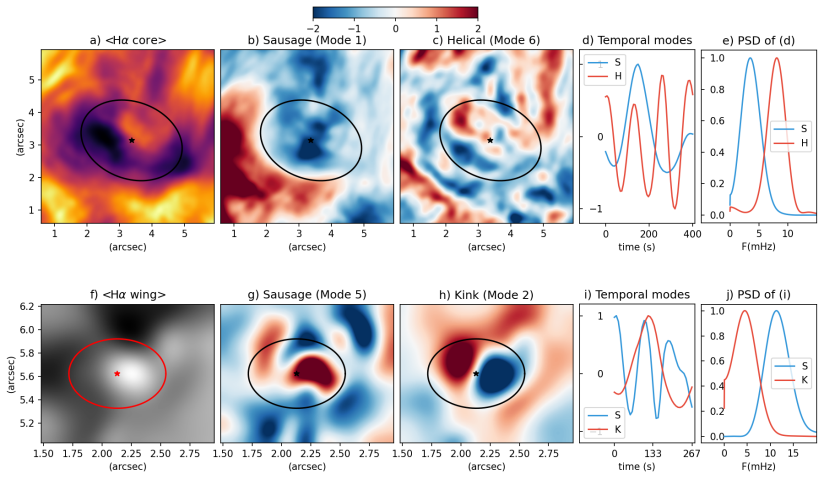
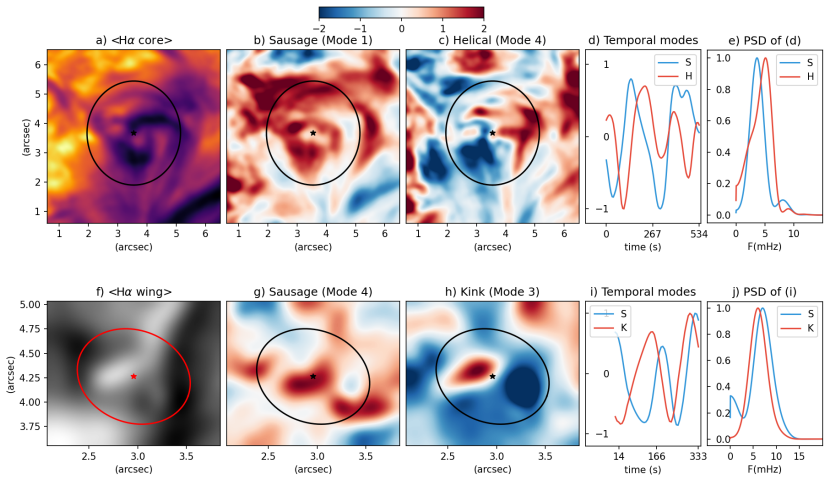
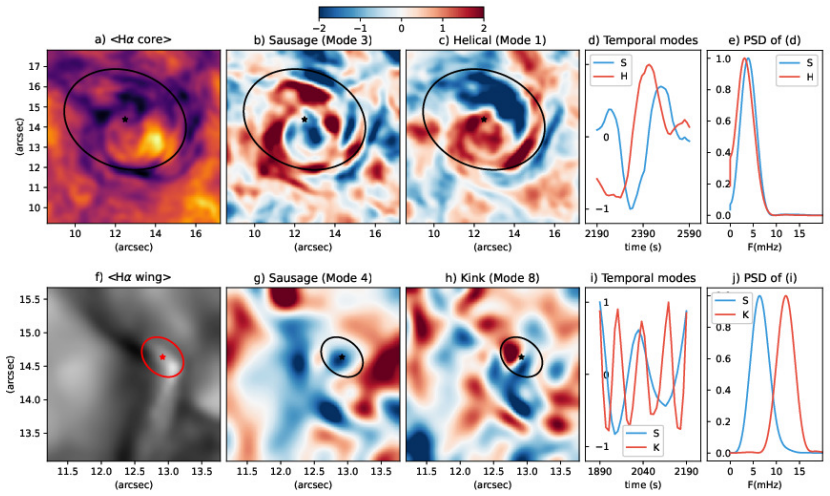
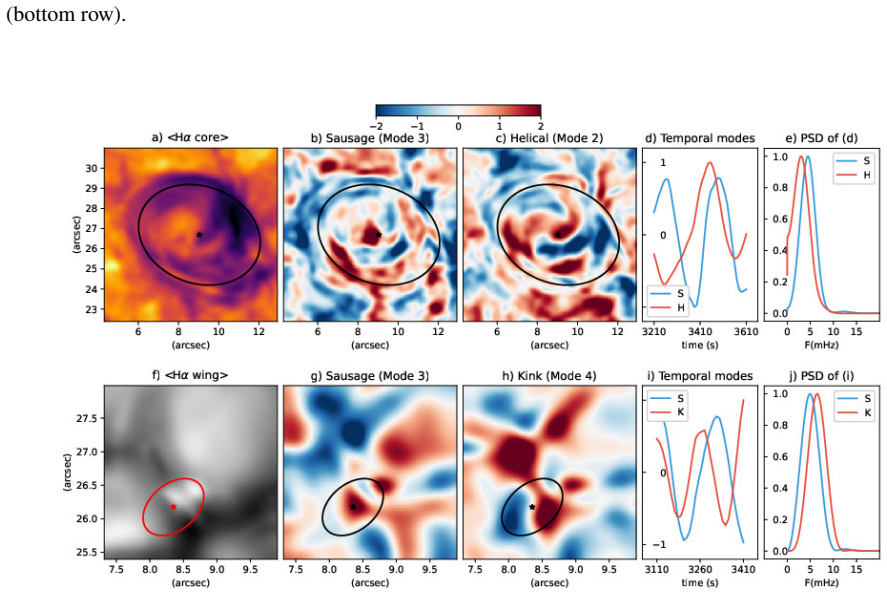
The load-bearing object is the vortex tube itself, treated as a rotating, elliptical MHD waveguide anchored in the photosphere and extending into the chromosphere. The method carrying the wave-mode identification is spectral proper orthogonal decomposition (SPOD), a covariance-filtering technique that isolates spatially coherent modes at single frequencies; the authors use its spatial patterns and temporal coefficients to classify sausage modes (radial width oscillations) and kink/helical modes (transverse or rotating axis displacements), and cross-check with an automated morphological swirl detector tracking the vortex center and radius. The energy argument rests on splitting the wave energ
What would settle it
Run the same simulation with a lower boundary that lets acoustic waves pass through, and recalculate the height-resolved compressive energy flux inside the vortex; if the flux no longer reaches the roughly 200–400 W m^-2 needed to balance radiative losses below 1 Mm, the heating claim fails. Alternatively, measure the compressive flux inside a vortex from high-cadence Fe I 1.56 µm and Ca II 8542 Å spectropolarimetry; if vortex-region compressive flux equals the non-vortex background, the waveguide claim fails.
Extended reading notes
Core claim
The paper's central claim is that a solar vortex is a vertically coherent MHD waveguide: the same structure connects photospheric bright points to the overlying chromospheric swirl, and it carries magnetoacoustic waves whose thermal signatures appear in both the Hα wing (photosphere) and Hα core/Ca II 8542 Å (chromosphere). The authors report the first quantitative detection of sausage and kink/helical wave modes inside the same vortex across layers, cross-validating spectral proper orthogonal decomposition (SPOD) with independent morphological tracking of the vortex center and radius. They further decompose the wave energy flux into a compressive pressure-driven part, W_p, and a magnetic pa
Load-bearing premise
The energy-balance result depends on the simulation's lower boundary, which reflects acoustic waves and can artificially inflate the compressive wave flux; if that inflation is large, the claim that vortex-guided waves offset radiative losses would be overstated.
Editorial extensions
If this is right
- Chromospheric-heating models must include vortex-guided compressive flux; without vortices, the modeled acoustic energy supply in the low chromosphere would be too small.
- SPOD becomes a diagnostic for detecting rotational flow and wave-mode content even where velocity fields are unresolved, such as sunspot umbras and upper-atmosphere layers.
- The kink-to-helical transition with height implies the vortex axis is a helical, tilted curve, so three-dimensional forward models of vortices should not assume straight vertical tubes.
- The W_m/W_p crossover near 1 Mm defines a wave-regime boundary: magnetoacoustic waves dominate below it and Alfvénic waves above it, so wave-heating models must switch the dominant channel at that height.
Reading between the lines
- A testable extension suggested by the authors' own caveat: rerun the energy-flux analysis with a transmitting (non-reflecting) lower boundary; if compressive flux still exceeds radiative-loss thresholds below 1 Mm, the heating conclusion survives the boundary artifact.
- The crossover height where W_m/W_p crosses unity should depend on magnetic field strength and geometry; mapping vortices in plage or sunspot regions would reveal where vortex-guided compressive dominance ends.
- The finding probably generalizes beyond the Sun: any magnetized stellar atmosphere with strong swirls and inclined fields should show vortex-guided magnetoacoustic heating, not solely Alfvénic channeling.
- Because the observed kink mode evolves into a helical mode with height, vortex bending may be the physical mechanism connecting misaligned photospheric and chromospheric structures; a direct test would measure the phase relationship between vortex-center displacement and chromospheric emission.
Editorial analysis
A structured set of objections, weighed in public.
Referee Report
Summary. The manuscript combines SST/CRISP Hα and Ca II 8542 Å observations of quiet-Sun swirls, a Bifrost coronal-hole simulation (ch024031_by200bz005), and synthetic rotating-Gaussian vortex models to argue that solar vortices are vertically coherent MHD waveguides. It computes Shannon entropy, mutual information, and Jensen–Shannon divergence to connect photospheric bright points to chromospheric swirls; applies Spectral Proper Orthogonal Decomposition (SPOD) to intensity, velocity, Poynting flux, temperature/FWHM maps; and independently tracks vortex centers/radii with A-MorphIS to infer Kink/Helical and Sausage mode frequencies. The paper's central claims are (i) first direct evidence that vortices carry magnetoacoustic modes through multiple layers, and (ii) compressive (magnetoacoustic) wave flux dominates below ~1 Mm and offsets chromospheric radiative losses, challenging Alfvén-dominated vortex energetics.
Significance. If established, the waveguide result would be a substantial advance: it would move vortex studies from morphological swirl detection and indirect connectivity to explicit multi-height wave-mode identification, and it would challenge the standard torsional-Alfvén picture for lower-atmosphere vortex energetics. The study has genuine strengths: the mode identification is cross-checked by two independent methods (SPOD and A-MorphIS/FFT); the morphological frequencies (2.5–6.7 mHz) are consistent with prior vortex oscillation measurements; the analysis includes ten simulated and ten observed vortices rather than a single event; and the authors openly disclose the Bifrost lower-boundary limitation. However, the quantitative energy-balance conclusion is not equally robust: its principal input, W_p, is acknowledged to be inflated by the reflective lower boundary, and the synthetic SPOD validation is circular in its construction. These caveats are disclosed, but they are not consistently carried into the abstract and Discussion. With revisions that calibrate or temper the flux claim and quantify mode-classification confidence, the paper could be suitable for publication.
major comments (4)
- [Wave energy transport / Supplementary Wave energy flux analysis] The abstract's quantitative conclusion that magnetoacoustic waves 'efficiently transfer energy, offset losses from radiation, and dominate energy transport in the lower chromosphere' rests on the magnitude of W_p computed with Eqs. (22)–(24). The Supplementary text states that the Bifrost lower boundary is a pressure node that reflects acoustic waves, excites a limited set of p-modes with larger amplitudes than in the real Sun, 'could artificially enhance the compressive wave energy flux (W_p)', and 'complicates direct interpretation of W_p >> W_m below 1 Mm as a purely physical result.' Yet the Results and Discussion quote W_pz ≈ 10^4 W m^-2 at 0.6 Mm and ≈200 W m^-2 at 2 Mm and present them as meeting/exceeding chromospheric heating requirements, without propagating the caveat into the headline. This is load-bearing for the energy-balance claim. I ask the authors to calibrate W_p again
- [Supplementary Synthetic data / Results MHD wave analysis] The synthetic SPOD calibration is constructed by imposing exactly the two modes that are then 'recovered' (Kink at 7 mHz and Sausage at 9 mHz in the rotating Gaussian model). This validates the numerical pipeline but does not establish that the same SPOD classification has a low false-positive rate on real vortices, where the true modal content is unknown. The authors explicitly caution that frequencies must be estimated or validated by complementary methods, and the A-MorphIS/FFT analysis does supply independent frequency estimates consistent with published ranges (2.5–6.7 mHz). What is missing is a quantitative measure of classification confidence for the real-data spatial modes: no null cases (rotation plus noise without waves), no template-matching scores, no inter-rater or algorithmic consistency metric. Because the paper's central claim is 'first direct evidence' of magnetoacoustic
- [Results: Wave energy transport] The quoted energetics for vortex N1 are internally inconsistent: at 2 Mm the paper reports total wave energy S ≈ 4.29×10^26 erg with W_m ≈ 1.32×10^26 erg and W_p ≈ 1.28×10^25 erg. Since Eqs. (22)–(24) define the total as the sum of the compressive and magnetic components (or at least do not define any additional term), the components sum to 1.45×10^26 erg, a factor ~3 below the stated total. Either define what S includes or correct the value. Separately, the population range 10^24–10^28 erg is obtained by 'assuming similar fluxes but variable size and duration' from a single simulated vortex; no scaling law or uncertainty is given, so the extension to 10 observed swirls is not yet quantitatively supported. This matters for the 'nanoflare regime' comparison.
- [Abstract / Discussion] The phrase 'clear wave-heating signatures' overstates what the evidence shows. The temperature SPOD modes for N1 and FWHM modes for S1 demonstrate oscillatory thermal perturbations correlated with Sausage/Kink modes; they are wave signatures, not a demonstrated net heating contribution. A net heating claim would require a quantitative energy budget linking the wave flux to radiative loss and excess emission in the same vortex. This is especially relevant given the boundary-affected W_p issue, because the only quantitative link to radiative losses is that boundary-dependent flux. Please either provide such a budget or temper the wording to 'temperature perturbations consistent with wave propagation'.
minor comments (5)
- [Results: Vortex photosphere - chromosphere connectivity] The sentence 'Our initial goal was to assess how well the simulated vortices from the Bifrost model compare to the structural properties of the observed vortices' appears twice verbatim in consecutive paragraphs.
- [Figure 5 caption] 'vorted' should be 'vortex' in 'the individual behaviour of each vorted'.
- [Figure 22 caption] 'a interval' should be 'an interval'.
- [Figure 10 caption] The phrase 'panels (j) and (h)' appears to be a typo for 'panels (e) and (j)' referring to the two PSD panels.
- [References] Reference [47] (Gupta et al., J. Optics, with TBD metadata) appears unrelated to the excitation of overtones in Gaussian waveguides; please verify or replace with a directly relevant source.
Circularity Check
No significant circularity: synthetic SPOD validation is a recovery test, real-data mode frequencies come from independent morphological analysis, and the Bifrost boundary limitation is a disclosed simulation-fidelity caveat, not a circular reduction.
full rationale
The paper's derivation chain is: Bifrost simulation -> synthetic Hα spectra via non-LTE radiative transfer (SunnyNet/Muspel) -> A-MorphIS vortex identification -> SPOD decomposition of S_z, v_z, temperature, v_LOS, FWHM -> wave energy flux decomposition W_p, W_m -> comparison with chromospheric radiative-loss estimates. The synthetic vortex models (M-I/M-II) are used as a controlled recovery test: Kink and Sausage waveforms are imposed with frequencies 7/9 mHz and SPOD is shown to recover the correct families. This is a validation experiment, not a fit: the imposed frequencies are not used as free parameters in the observational or simulation analysis, and the real-data mode frequencies are instead derived from independent A-MorphIS time series of the vortex center displacement (f_D) and radius (f_R, Table S2). The classification of SPOD spatial patterns as Kink/Helical or Sausage is qualitative pattern matching, but the quantitative frequency support is external to the synthetic construction. The Bifrost lower-boundary pressure-node effect is explicitly disclosed by the authors as a possible artificial enhancement of W_p below 1 Mm; this is a correctness/fidelity caveat, not a circular step, because W_p is computed from the simulation fields and compared with external estimates (e.g., Rajaguru et al. 2019, Withbroe & Noyes 1977), not defined in terms of the conclusion. Self-citations (A-MorphIS, temperature-gradient proxy, WaLSAtools, prior vortex-tube papers) are methodological or background; none is an unverified uniqueness theorem or the sole justification for the central waveguide/heating claim. No equation is defined in terms of its target, and no fitted parameter is renamed as a prediction. Therefore the paper does not reduce to its inputs by construction.
Assumptions & free parameters
free parameters (5)
- Synthetic SPOD calibration inputs (imposed frequencies, amplitudes, random walk) =
Sausage 9 mHz, Kink 7 mHz; A_walk = 0.03 px/s; scale 0.0764; noise U(0, 0.2)
- Per-vortex SPOD analysis windows =
S1 photosphere 10:21-10:24 UT, chromosphere 10:21-10:28 UT; N1 3800-4300 s; temp +100 s
- Vortex isolation mask radius (simulation) =
circular mask, approximately 3.4 arcsec
- Spatial low-pass filter cutoff for N1 H-alpha =
Gaussian, 0.3 arcsec
- Observational population energy scaling =
10^24 to 10^28 erg across vortex population
assumptions (6)
- domain assumption Bifrost lower boundary is a pressure node; the limited set of excited p-modes has larger amplitudes than in the real Sun
- standard math SPOD assumes linear superposition of modes
- domain assumption H-alpha core FWHM is a proxy for chromospheric temperature
- domain assumption SunnyNet faithfully approximates non-LTE hydrogen populations
- domain assumption MI and JSD of intensity time series quantify physical photosphere-chromosphere coupling
- domain assumption Bifrost run ch024031_by200bz005 (coronal hole) represents the observed quiet-Sun conditions
Cite this review
Pith. "Pith review of Solar Vortices as Conduits for Magnetoacoustic Waves: Multi-Layer Coupling and Their Role in Atmospheric Heating." pith.science (2026). https://pith.science/paper/4GSXTIU5
@misc{pith2026250902895,
  author       = {Pith},
  title        = {Pith review of: Solar Vortices as Conduits for Magnetoacoustic Waves: Multi-Layer Coupling and Their Role in Atmospheric Heating},
  year         = {2026},
  howpublished = {\url{https://pith.science/paper/4GSXTIU5}},
  note         = {Machine review of arXiv:2509.02895}
}
read the original abstract
The Sun's atmosphere hosts swirling plasma structures, known as solar vortices, which have long been thought to channel wave energy into higher layers. Until now, no direct observations have confirmed their role in the heating of the atmosphere. Here, we present the first direct evidence that solar vortices act as structured waveguides, carrying magnetoacoustic modes (waves that behave like sound waves but travel through magnetized plasma) that leave clear wave-heating signatures. By mapping vortex regions at multiple heights and analysing the waves they contain, we show that magnetoacoustic waves efficiently transfer energy, offset losses from radiation, and dominate energy transport in the lower chromosphere. These results challenge the long-standing assumption that vortices primarily support twisting disturbances traveling along magnetic field lines (Alfven waves), revealing instead that magnetoacoustic modes play the leading role in the lower atmosphere. This redefines the role of vortices in magnetized plasmas and has broader implications for wave-plasma interactions in regions of strong magnetic fields.
Figures


Figures from the paper (43 more)








Reference graph
Works this paper leans on
-
[1]
Suzana S. A. Silva, Gary Verth, Erico L. Rempel, Sergiy Shelyag, Luiz A. C. A. Schiavo, and Viktor Fedun. Solar vortex tubes. II. on the origin of magnetic vortices.The Astrophysical Journal, 915(1):24, jun 2021. doi: 10.3847/1538-4357/abfec2. URLhttps://doi.org/10.3847/1538-4357/abfec2
-
[2]
Suzana S. A. Silva, Gary Verth, Erico L. Rempel, Istvan Ballai, Shahin Jafarzadeh, and Viktor Fedun. MagnetohydrodynamicPoyntingFluxVorticesintheSolarAtmosphereandTheirRoleinConcentrating Energy. The Astrophysical Journal, 963(1):10, March 2024. doi: 10.3847/1538-4357/ad1403
-
[3]
Abraham C. L. Chian, Suzana S. A. Silva, Erico L. Rempel, Gošić, Milan , Luis R. Bellot Rubio, 1In this work, the covariance matrix was filtered using a Gaussian filter kernel for𝑔𝑘 as described by (45). 2https://WaLSA.tools 19 Kanya Kusano, Rodrigo A. Miranda, and Iker S. Requerey. Supergranular turbulence in the quiet Sun: Lagrangian coherent structures...
-
[4]
K. Tziotziou, E. Scullion, S. Shelyag, O. Steiner, E. Khomenko, G. Tsiropoula, J. R. Canivete Cuissa, S.Wedemeyer,I.Kontogiannis,N.Yadav,I.N.Kitiashvili,S.J.Skirvin,I.Dakanalis,A.G.Kosovichev, and V. Fedun. Vortex Motions in the Solar Atmosphere.Space Science Reviews, 219(1):1, February
-
[5]
Requerey, Jose Carlos Del Toro Iniesta, Luis R
Iker S. Requerey, Jose Carlos Del Toro Iniesta, Luis R. Bellot Rubio, Valentín Martínez Pillet, Sami K. Solanki, and Wolfgang Schmidt. Convectively Driven Sinks and Magnetic Fields in the Quiet-Sun.The Astrophysical Journal Supplement Series, 229(1):14, March 2017. doi: 10.3847/1538-4365/229/1/14
-
[6]
Suzana S. A. Silva, Viktor Fedun, Gary Verth, Erico L. Rempel, and Sergiy Shelyag. Solar vortex tubes: Vortex dynamics in the solar atmosphere.The Astrophysical Journal, 898(2):137, jul 2020. doi: 10.3847/1538-4357/ab99a9. URL https://doi.org/10.3847/1538-4357/ab99a9
-
[7]
N.Yadav, R.H.Cameron, andS.K.Solanki. Vortexflowpropertiesinsimulationsofsolarplageregion: Evidence for their role in chromospheric heating.Astronomy & Astrophysics, 645:A3, January 2021. doi: 10.1051/0004-6361/202038965
-
[8]
Thealfvénicnatureofchromosphericswirls
Andrea Francesco Battaglia, José Roberto Canivete Cuissa, Flavio Calvo, Aleksi Antoine Bossart, and OskarSteiner. Thealfvénicnatureofchromosphericswirls. Astronomy&Astrophysics ,649:A121,2021. doi: 10.1051/0004-6361/202040110. URLhttps://doi.org/10.1051/0004-6361/202040110
Show all 63 references
-
[9]
M., Fischer, C
Díaz-Castillo, S. M., Fischer, C. E., Rezaei, R., Steiner, O., and Berdyugina, S. Connectivity between the solar photosphere and chromosphere in a vortical structure - observations of multi- phase, small-scale magnetic field amplification.Astronomy & Astrophysics, 691:A37, 202...
2024 doi
-
[10]
Magnetic Tornado Properties: ASubstantialContributiontotheSolarCoronalHeatingviaEfficientEnergyTransfer
Hidetaka Kuniyoshi, Munehito Shoda, Haruhisa Iijima, and Takaaki Yokoyama. Magnetic Tornado Properties: ASubstantialContributiontotheSolarCoronalHeatingviaEfficientEnergyTransfer. arXiv e-prints, art. arXiv:2304.03010, April 2023. doi: 10.48550/arXiv.2304.03010
-
[11]
Suzana S. A. Silva, Gary Verth, Istvan Ballai, Erico L. Rempel, Sergiy Shelyag, Luiz A. C. A. Schiavo, Tiago F. P. Gomes, and Viktor Fedun. Solar Vortex Tubes. III. Vorticity and Energy Transport.The Astrophysical Journal, 975(1):118, November 2024. doi: 10.3847/1538-4357/ad781a
2024 doi
-
[12]
Hidetaka Kuniyoshi, Souvik Bose, and Takaaki Yokoyama. Comprehensive Synthesis of Magnetic Tornado: Cospatial Incidence of Chromospheric Swirls and Extreme-ultraviolet Brightening.The Astrophysical Journal Letters, 969(2):L34, July 2024. doi: 10.3847/2041-8213/ad5a0e
2024 doi
-
[13]
Fedun, S
V. Fedun, S. Shelyag, G. Verth, M. Mathioudakis, and R. Erdélyi. MHD waves generated by high- frequency photospheric vortex motions. Annales Geophysicae, 29(6):1029–1035, jun 2011. doi: 10.5194/angeo-29-1029-2011. 20
2011 doi
-
[14]
George Cherry, Boris Gudiksen, and Adam J. Finley. Detection of wave activity within a realistic 3d magnetohydrodynamicquietsunsimulation. Astronomy&Astrophysics ,2025. doi: 10.1051/0004-6361/ 202555110. URL https://doi.org/10.1051/0004-6361/202555110. Forthcoming article
2025 doi
-
[15]
Christian
DavidB.Jess,MihalisMathioudakis,RobertErdélyi,PhilipJ.Crockett,FrancisP.Keenan,andDamianJ. Christian. Alfvén Waves in the Lower Solar Atmosphere.Science, 323(5921):1582, March 2009. doi: 10.1126/science.1168680
2009 doi
-
[16]
Tziotziou, G
K. Tziotziou, G. Tsiropoula, I. Kontogiannis, E. Scullion, and J. G. Doyle. A persistent quiet-Sun small-scale tornado. I. Characteristics and dynamics.Astronomy & Astrophysics, 618:A51, October
-
[17]
Tziotziou, G
K. Tziotziou, G. Tsiropoula, and I. Kontogiannis. A persistent quiet-Sun small-scale tornado. II. Oscillations. Astronomy & Astrophysics, 623:A160, March 2019. doi: 10.1051/0004-6361/201834679
2019 doi
-
[18]
Magnetic tornadoes as energy channels into the solar corona
Sven Wedemeyer-Böhm, Eamon Scullion, Oskar Steiner, Luc Rouppe van der Voort, Jaime de La Cruz Rodriguez, Viktor Fedun, and Robert Erdélyi. Magnetic tornadoes as energy channels into the solar corona. Nature, 486(7404):505–508, jun 2012. doi: 10.1038/nature11202
2012 doi
-
[19]
AlfvÉnwavesinsimulationsofsolarphotospheric vortices
S.Shelyag,P.S.Cally,A.Reid,andM.Mathioudakis. AlfvÉnwavesinsimulationsofsolarphotospheric vortices. The Astrophysical Journal Letters, 776(1):L4, sep 2013. doi: 10.1088/2041-8205/776/1/L4. URL https://dx.doi.org/10.1088/2041-8205/776/1/L4
2013 doi
-
[20]
Reeves, Patrick Antolin, Daniel Elias Nóbrega-Siverio, Adam F
Bart De Pontieu, Vanessa Polito, Viggo Hansteen, Paola Testa, Katharine K. Reeves, Patrick Antolin, Daniel Elias Nóbrega-Siverio, Adam F. Kowalski, Juan Martinez-Sykora, Mats Carlsson, Scott W. McIntosh,WeiLiu,AdrianDaw,andCharlesC.Kankelborg. ANewViewoftheSolarInterfaceRegion...
2021 doi
-
[21]
Dakanalis, G
I. Dakanalis, G. Tsiropoula, K. Tziotziou, and I. Kontogiannis. Chromospheric swirls. I. Automated detection in H𝛼 observations and their statistical properties.Astronomy & Astrophysics, 663:A94, July
-
[22]
Jess, Marco Stangalini, Samuel D
Shahin Jafarzadeh, David B. Jess, Marco Stangalini, Samuel D. T. Grant, Jonathan E. Higham, Martin E. Pessah, Peter H. Keys, Sergey Belov, Daniele Calchetti, Timothy J. Duckenfield, Viktor Fedun, Bernhard Fleck, Ricardo Gafeira, Stuart M. Jefferies, Elena Khomenko, Richard J. ...
2025
-
[23]
A. B. Albidah, W. Brevis, V. Fedun, I. Ballai, D. B. Jess, M. Stangalini, J. Higham, and G. Verth. Proper orthogonal and dynamic mode decomposition of sunspot data.Philosophical Transactions of the Royal Society A: Mathematical, Physical and Engineering Sciences, 379(2190):202...
2021
-
[24]
A. B. Albidah, V. Fedun, A. A. Aldhafeeri, I. Ballai, D. B. Jess, W. Brevis, J. Higham, M. Stangalini, S.S.A.Silva,C.D.MacBride,andG.Verth.Thetemporalandspatialevolutionofmagnetohydrodynamic wave modes in sunspots.The Astrophysical Journal, 954(1):30, aug 2023. doi: 10.3847/15...
2023 doi
-
[25]
Jafarzadeh, L
S. Jafarzadeh, L. A. C. Schiavo, V. Fedun, S. K. Solanki, M. Stangalini, D. Calchetti, G. Verth, D. B. Jess, S. D. T. Grant, I. Ballai, R. Gafeira, P. H. Keys, B. Fleck, R. J. Morton, P. K. Browning, S. A. Silva, T.Appourchaux,A.Gandorfer,L.Gizon,J.Hirzberger,F.Kahil,D.OrozcoS...
-
[26]
Aldhafeeri, Gary Verth, Wernher Brevis, David B
Anwar A. Aldhafeeri, Gary Verth, Wernher Brevis, David B. Jess, Max McMurdo, and Viktor Fedun. Magnetohydrodynamic wave modes of solar magnetic flux tubes with an elliptical cross section. The Astrophysical Journal, 912(1):50, may 2021. doi: 10.3847/1538-4357/abec7a. URL https...
2021 doi
-
[27]
S. J. Skirvin, V. Fedun, S. S. A. Silva, T. Van Doorsselaere, N. Claes, M. Goossens, and G. Verth. The effect of linear background rotational flows on magnetoacoustic modes of a photospheric magnetic flux tube.Monthly Notices of the Royal Astronomical Society, 518(4):6355–6366...
2023 doi
-
[28]
Slow body mhd waves in inhomogeneous photospheric waveguides.Universe, 10(8), 2024
IstvanBallai,FisalAsiri,ViktorFedun,GaryVerth,EmeseForgács-Dajka,andAbdulrahmanB.Albidah. Slow body mhd waves in inhomogeneous photospheric waveguides.Universe, 10(8), 2024. ISSN 2218-1997. doi: 10.3390/universe10080334. URLhttps://www.mdpi.com/2218-1997/10/8/334
2024 doi
-
[29]
Maxworthy, E
T. Maxworthy, E. J. Hopfinger, and L. G. Redekopp. Wave motions on vortex cores.Journal of Fluid Mechanics, 151:141–165, 1985. doi: 10.1017/S0022112085000908
1985 doi
-
[30]
Automated Detection of Chromospheric Swirls Based on Their Morphological Characteristics.Solar Physics, 296 (1):17, January 2021
Ioannis Dakanalis, Georgia Tsiropoula, Kostas Tziotziou, and Konstantinos Koutroumbas. Automated Detection of Chromospheric Swirls Based on Their Morphological Characteristics.Solar Physics, 296 (1):17, January 2021. doi: 10.1007/s11207-020-01748-3
2021 doi
-
[31]
Leenaarts, M
J. Leenaarts, M. Carlsson, and L. Rouppe van der Voort. The Formation of the H𝛼 Line in the Solar Chromosphere. The Astrophysical Journal, 749:136, April 2012. doi: 10.1088/0004-637X/749/2/136
2012 doi
-
[32]
S. J. Mumford, V. Fedun, and R. Erdélyi. Generation of Magnetohydrodynamic Waves in Low Solar Atmospheric Flux Tubes by Photospheric Motions.The Astrophysical Journal, 799(1):6, January 2015. doi: 10.1088/0004-637X/799/1/6. 22
2015 doi
-
[33]
Apublicly available simulation of an enhanced network region of the Sun.Astronomy & Astrophysics, 585:A4, jan
MatsCarlsson,ViggoH.Hansteen,BorisV.Gudiksen,JorritLeenaarts,andBartDePontieu. Apublicly available simulation of an enhanced network region of the Sun.Astronomy & Astrophysics, 585:A4, jan
-
[34]
S. P. Rajaguru, S. Couvidat, and R. Wachter. Low-frequency acoustic-wave energy flux to the solar chromosphere from hinode sot observations.The Astrophysical Journal, 871(2):155, 2019. doi: 10.3847/1538-4357/aaf888
2019 doi
-
[35]
G. L. Withbroe and R. W. Noyes. Mass and energy flow in the solar chromosphere and corona.Annual Review of Astronomy and Astrophysics, 15:363–387, 1977. doi: 10.1146/annurev.aa.15.090177.002051
1977
-
[36]
Magnetohydrodynamicwavesinnonuniformplasmas: Theconnectionbetweenresonantabsorption, phasemixing, andmodecoupling
M.Goossens,I.Arregui,andT.VanDoorsselaere. Magnetohydrodynamicwavesinnonuniformplasmas: Theconnectionbetweenresonantabsorption, phasemixing, andmodecoupling. FrontiersinAstronomy and Space Sciences, 6:20, 2019. doi: 10.3389/fspas.2019.00020
2019
-
[37]
Chromosphericheatingbymagnetohydrodynamic wavesand instabilities.Journal ofGeophysical Research: SpacePhysics, 126(7):e2020JA029097, 2021
A.K.Srivastava,J.L.Ballester,S.K.Dhara,andetal. Chromosphericheatingbymagnetohydrodynamic wavesand instabilities.Journal ofGeophysical Research: SpacePhysics, 126(7):e2020JA029097, 2021. doi: 10.1029/2020JA029097
2021 doi
-
[38]
B. V. Gudiksen, M. Carlsson, V. H. Hansteen, W. Hayek, J. Leenaarts, and J. Martínez-Sykora. The stellar atmosphere simulation code Bifrost. Code description and validation.Astronomy & Astrophysics, 531:A154, July 2011. doi: 10.1051/0004-6361/201116520
2011 doi
-
[39]
and Pereira, Tiago M
Chappell, Bruce A. and Pereira, Tiago M. D. Sunnynet: A neural network approach to 3d non-lte radiative transfer.Astronomy & Astrophysics, 658:A182, 2022. doi: 10.1051/0004-6361/202142625. URL https://doi.org/10.1051/0004-6361/202142625
2022 doi
-
[40]
Leenaarts and M
J. Leenaarts and M. Carlsson. MULTI3D: A Domain-Decomposed 3D Radiative Transfer Code. In B. Lites, M. Cheung, T. Magara, J. Mariska, and K. Reeves, editors,The Second Hinode Science Meeting: Beyond Discovery-Toward Understanding, volume 415 ofAstronomical Society of the Pacif...
2009
-
[41]
Tiago M. D. Pereira and Edvarda Harnes. tiagopereira/muspel.jl: v0.2.4, February 2025. URL https://doi.org/10.5281/zenodo.14906962
2025 doi
-
[42]
Imaging vector fields using line integral convolution
Brian Cabral and Leith Casey Leedom. Imaging vector fields using line integral convolution. In Proceedings of the 20th Annual Conference on Computer Graphics and Interactive Techniques, SIGGRAPH’93,page263–270,NewYork,NY,USA,1993.AssociationforComputingMachinery.ISBN 089791601...
1993
-
[43]
B. W. Silverman.Density Estimation for Statistics and Data Analysis. Monographs on Statistics and Applied Probability. Chapman and Hall, London, 1986
1986
-
[44]
Oliver Paschereit, and Kilian Oberleithner
Moritz Sieber, C. Oliver Paschereit, and Kilian Oberleithner. Spectral proper orthogonal decomposition. Journal of Fluid Mechanics, 792:798–828, April 2016. doi: 10.1017/jfm.2016.103. 23
2016 doi
-
[45]
Identification of coherent structures in the flow past a NACA0012 airfoil via proper orthogonal decomposition.Physics of Fluids, 29(8):085104, August 2017
Jean Hélder Marques Ribeiro and William Roberto Wolf. Identification of coherent structures in the flow past a NACA0012 airfoil via proper orthogonal decomposition.Physics of Fluids, 29(8):085104, August 2017. doi: 10.1063/1.4997202
2017 doi
-
[46]
Motion of an elliptical vortex in a uniform shear flow.Journal of the Physical Society of Japan, 50(10):3517–3520, 1981
Shigeo Kida. Motion of an elliptical vortex in a uniform shear flow.Journal of the Physical Society of Japan, 50(10):3517–3520, 1981
1981
-
[47]
Naveen Gupta, A. K. Alex, Rohit Johari, and Sanjeev Kumar. Excitation of frequency overtones of self-focused q-gaussian laser beam in preformed collisional parabolic plasma channels: higher harmonic generation. Journal of Optics, TBD(TBD):TBD, 2024. ISSN 0974-6900. doi: 10.100...
2024 doi
-
[48]
G. B. Scharmer, G. Narayan, T. Hillberg, J. de la Cruz Rodriguez, M. G. Löfdahl, D. Kiselman, P. Sütterlin, M. van Noort, and A. Lagg. CRISP Spectropolarimetric Imaging of Penumbral Fine Structure. The Astrophysical Journal Letters, 689(1):L69, December 2008. doi: 10.1086/595744
2008 doi
-
[49]
Scharmer, Klas Bjelksjo, Tapio K
Goran B. Scharmer, Klas Bjelksjo, Tapio K. Korhonen, Bo Lindberg, and Bertil Petterson. The 1-meter Swedish solar telescope. In Stephen L. Keil and Sergey V. Avakyan, editors,Innovative Telescopes and Instrumentation for Solar Astrophysics, volume 4853 ofSociety of Photo-Optic...
2003 doi
-
[50]
Löfdahl, Tomas Hillberg, Jaime de la Cruz Rodríguez, Gregal Vissers, Oleksii Andriienko, Göran B
Mats G. Löfdahl, Tomas Hillberg, Jaime de la Cruz Rodríguez, Gregal Vissers, Oleksii Andriienko, Göran B. Scharmer, Stein V. H. Haugan, and Terje Fredvik. SSTRED: Data- and metadata-processing pipeline for CHROMIS and CRISP.Astronomy & Astrophysics, 653:A68, September 2021. do...
2021 doi
-
[51]
Michiel Van Noort, Luc Rouppe Van Der Voort, and Mats G. Löfdahl. Solar Image Restoration By Use Of Multi-frame Blind De-convolution With Multiple Objects And Phase Diversity.Solar Physics, 228 (1-2):191–215, May 2005. doi: 10.1007/s11207-005-5782-z
2005 doi
-
[52]
Schunker and P
H. Schunker and P. S. Cally. Magnetic field inclination and atmospheric oscillations above solar active regions. Monthly Notices of the Royal Astronomical Society, 372(2):551–564, October 2006. doi: 10.1111/j.1365-2966.2006.10855.x
2006
-
[53]
P. S. Cally. What to look for in the seismology of solar active regions.Astronomische Nachrichten, 328 (3):286, March 2007. doi: 10.1002/asna.200610731
2007 doi
-
[54]
Stangalini, D
M. Stangalini, D. Del Moro, F. Berrilli, and S. M. Jefferies. MHD wave transmission in the Sun’s atmosphere. Astronomy & Astrophysics, 534:A65, October 2011. doi: 10.1051/0004-6361/201117356
2011 doi
-
[55]
Kontogiannis, G
I. Kontogiannis, G. Tsiropoula, and K. Tziotziou. Transmission and conversion of magnetoacoustic waves on the magnetic canopy in a quiet Sun region.Astronomy & Astrophysics, 567:A62, July 2014. doi: 10.1051/0004-6361/201423986. 24
2014 doi
-
[56]
Kontogiannis, G
I. Kontogiannis, G. Tsiropoula, and K. Tziotziou. Wave propagation in a solar quiet region and the influence of the magnetic canopy.Astronomy & Astrophysics, 585:A110, January 2016. doi: 10.1051/0004-6361/201527053
2016 doi
-
[57]
TheFiveMinutePeriodOscillationinMagneticallyActiveRegions
A.G.Michalitsanos. TheFiveMinutePeriodOscillationinMagneticallyActiveRegions. SolarPhysics, 30(1):47–61, May 1973. doi: 10.1007/BF00156172
1973 doi
-
[58]
In Yoji Osaki and Hiromoto Shibahashi, editors,Progress of Seismology of the Sun and Stars, volume 367, page 211
YoshinoriSuematsu.InfluenceofPhotospheric5-MinuteOscillationsontheFormationofChromospheric Fine Structures. In Yoji Osaki and Hiromoto Shibahashi, editors,Progress of Seismology of the Sun and Stars, volume 367, page 211. Springer Berlin Heidelberg, 1990. doi: 10.1007/3-540-53...
1990 doi
-
[2016]
doi: 10.1051/0004-6361/201527226
-
[2018]
doi: 10.1051/0004-6361/201833101
-
[2022]
doi: 10.1051/0004-6361/202243236
-
[2023]
doi: 10.1007/s11214-022-00946-8
- [2024]
Reviewed August 5, 2026 · model on record in the stance chip above.
Discussion (0). Sign in to comment.