REVIEW 4 major objections 6 minor 58 references
The Role of Far-side Magnetic Structures in Modeling 2024 Solar Eclipse
T0 review · 4 major / 6 minor · reviewed 2026-08-05 · deepseek-v4-flash
Pith's one-line read In simulations of the April 2024 total eclipse, filling in the Sun's hidden magnetic hemisphere with later magnetograms shifts the simulated current sheet and streamers, improving agreement with white-light observations.
desk verdict A clean controlled simulation showing far-side boundary data matter; the 'GJ2 best' claim leans on a weak metric, but the qualitative result holds. read the letter →
The pith
A machine-rendered reading of the paper's core claim, the machinery that carries it, and where it could break.
The reading
What carries the argument
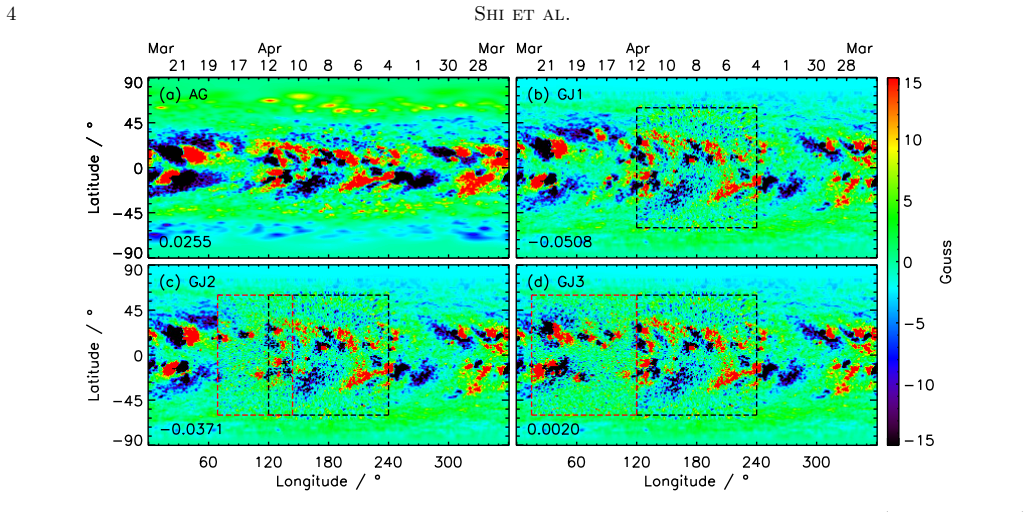
The key mechanism is a synoptic-map correction: the unseen far-side sector of the standard Carrington map is overwritten with a later full-disk magnetogram of the same region, under the assumption that the region's magnetic structure stays nearly unchanged for four to eight days. The corrected map is then used as the photospheric boundary for a global Alfvén-wave-driven MHD corona model. The work this mechanism does is to make the global flux balance and the initial potential-field extrapolation depend on the actual, time-resolved active-region field instead of an Earth-view interpolation. The downstream diagnostic carrying the comparison is the position of the heliospheric current sheet—the
What would settle it
Use an actual simultaneous far-side magnetogram from a second viewpoint for the same April 2024 active region, patch the same standard map with it, and compare the resulting streamer deflections to the four-day and eight-day runs. If the simultaneous-patch simulation does not reproduce the observed streamer directions at least as well as the four-day patch, the claimed improvement is not from recovering the true far-side field but from a time-lag-specific alteration; if it does match, the eclipse data would confirm that far-side boundary information is the controlling factor.
Extended reading notes
Core claim
The paper's central claim is that the far-side magnetic structure of an active region—one not yet visible from Earth at eclipse time—can control global coronal structure in an MHD model, chiefly by displacing the heliospheric current sheet and by changing the north-south magnetic pressure balance near the poles. To demonstrate this, the authors build composite synoptic maps from the standard daily map by splicing in full-disk magnetograms recorded four and eight days after April 8, then run the Alfvén-wave-driven coronal model to steady state. Relative to the standard map, the corrected maps shift streamer deflection directions poleward by 3.6 degrees (four-day patch) and 16.8 degrees (eight
Load-bearing premise
The load-bearing premise is that the far-side active region's magnetic structure stays nearly unchanged for the four to eight days between the eclipse and the later magnetogram used to patch the map; if the region evolves during that window, the 'correction' inserts the wrong epoch's field into the eclipse-time boundary.
Editorial extensions
If this is right
- If the central claim holds, single-view synoptic maps are a systematic source of error in global coronal and solar-wind models, and far-side knowledge is not a refinement but a boundary condition.
- The four-day patched map outperforming the eight-day patched map means the method's accuracy is bounded by magnetic evolution; the best lag could be tuned only with better knowledge of active-region lifetimes.
- The simulated current-sheet position and streamer deflection offer a remote probe of the unseen hemisphere: features on the visible limb encode far-side magnetic structure.
- The correction improves streamer directions and some in situ plasma parameters but leaves the open flux problem essentially untouched, so far-side field and polar field address different model errors.
- Success in the eclipse case supports developing multi-view or stereoscopic photospheric magnetic-field observations as routine inputs to coronal modeling.
Reading between the lines
- Editorial extension: the optimal four-day lag could be a coincidence tied to one active region's evolution; a robust version of the method would repeat the splice over many rotations and test whether the best lag tracks the region's flux emergence and decay rate.
- Editorial extension: because far-side patches move the current sheet globally, the difference between the four-day and eight-day runs could be used as a sensitivity experiment to separate how much of the April 8 corona was determined by hidden active regions versus the global polar field.
- Editorial extension: the paper's intensity comparison is weaker than its direction comparison because the eclipse-image radiometric calibration is itself uncertain; a future test could rely only on streamer positions and directions, avoiding absolute polarized-brightness values.
- Editorial extension: carrying out the same experiment with an actual simultaneous far-side magnetogram, rather than a time-lagged one, would cleanly test the stability assumption and quantify how much of the claimed gain comes from replacing the blind spot versus from using a different data source.
Editorial analysis
A structured set of objections, weighed in public.
Referee Report
Summary. The paper investigates the impact of far-side photospheric magnetic structure on global MHD coronal modeling for the 2024 April 8 total solar eclipse. Using the AWSoM-R model in SWMF, the authors compare four boundary conditions: an ADAPT-GONG map (AG), a standard GONG Janus daily synoptic map (GJ1), and two composite maps (GJ2, GJ3) where the far-side region in GJ1 is replaced by GONG full-disk magnetograms observed 4 and 8 days after the eclipse. They find that the local far-side active region affects the global coronal solution, shifting the heliospheric current sheet, streamer orientations, and plasma parameters even in polar regions. Comparisons with white-light TSE/LASCO C2 observations and PSP in-situ data lead the authors to conclude that the 4-day composite map (GJ2) provides the best agreement with observed streamer deflection directions and that composite synoptic maps improve coronal modeling accuracy.
Significance. If fully established, the result is significant for space weather modeling because routine single-view synoptic maps contain a systematic far-side blind spot, and the paper demonstrates a simple correction with potentially large global effects. The within-GJ comparison is clean: the three simulations share the same heating parameter (SA/B)_sun = 8e5, the same map family, and differ only in the replaced far-side region, so the reported sensitivity of the HCS, streamers, and open-flux fractions to this region is robust as a qualitative finding. The external validation data (TSE, LASCO C2, PSP) are independent of the boundary construction. However, the quantitative claim that GJ2 is the best and that the composite map improves accuracy currently rests on an unreported streamer-position metric and on a PSP comparison with a significant temporal mismatch. The central idea is plausible and publishable, but the validation needs to be made reproducible and temporally consistent.
major comments (4)
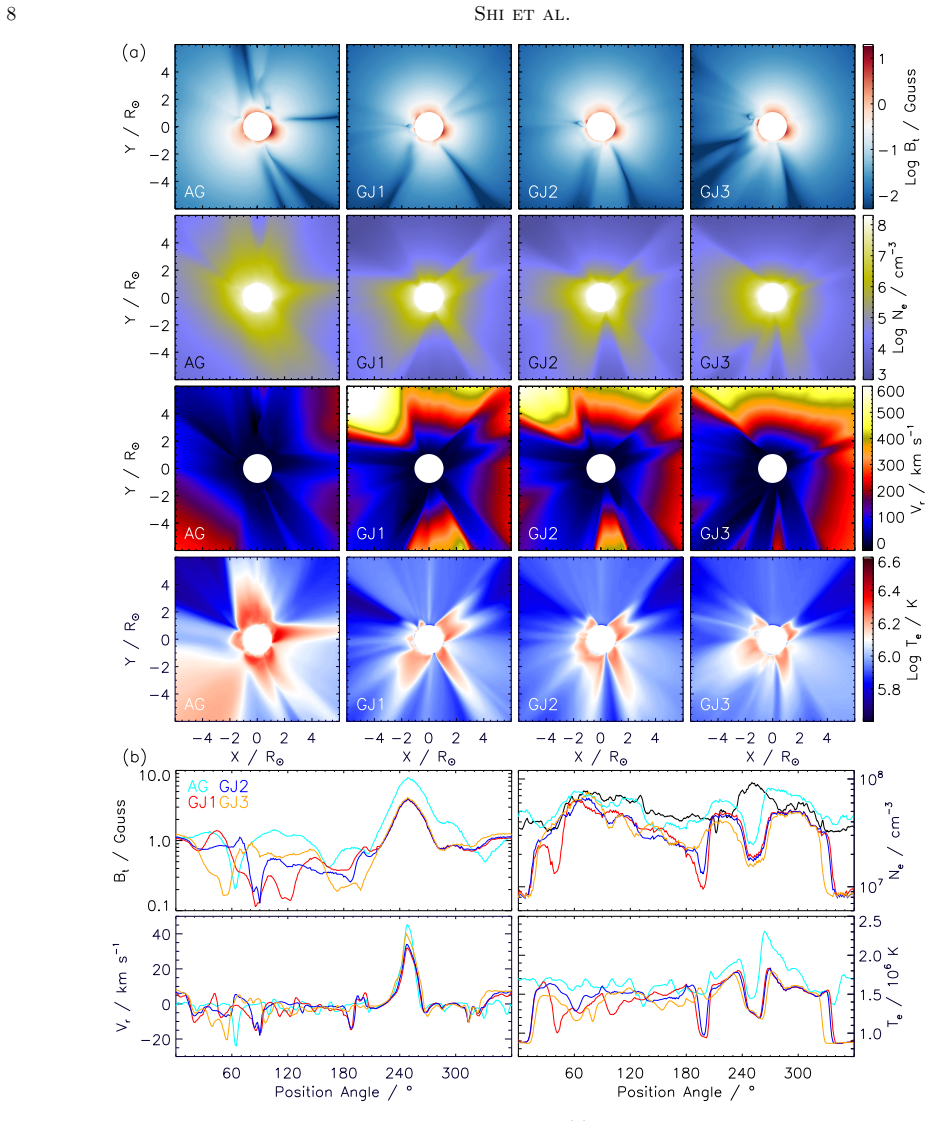
- [Sec. 3.3, Fig. 6(c)] The central quantitative conclusion that the GJ2 map 'provides the best agreement with observations in terms of streamer deflection direction' is based on mean poleward deflections of 3.6° (GJ2) and 16.8° (GJ3) relative to GJ1. However, the paper does not specify how the streamer position angles were measured from the pB profiles in Fig. 6(c), how peaks were identified (especially for S3, which shows two peaks in GJ2), or what uncertainty is attached to those positions. Given that the model angular resolution is 0.7° and the observed pB profiles are binned in position angle, a 3.6° shift may be within the combined measurement and simulation uncertainty. Without a reproducible metric (e.g., Gaussian fitting with covariance, or a quantitative PA-by-PA error norm between observed and simulated pB), the claim that GJ2 outperforms GJ1 is not falsifiable and the phrase 'improves the accuracy o
- [Sec. 3.2, Fig. 5] The PSP validation compares a steady-state simulation whose photospheric boundary is the 2024 April 8 synoptic map with in-situ measurements taken by PSP during March 29–31, 2024, i.e., roughly ten days before the boundary epoch. The solar wind observed at PSP on March 30 originated from photospheric regions that had rotated and evolved before April 8; a steady-state solution based on the April 8 map is not an appropriate simultaneous comparison unless stationarity over that interval is demonstrated and justified. The paper does not provide such a justification, and the 'time shifts between peak and trough values' acknowledged in the text suggest non-stationarity is non-negligible. Please either use PSP data contemporaneous with the simulation epoch (or map the observed solar wind back to its source region with a suitable model), or clearly state that the PSP comparison tests only the la
- [Sec. 2.2 and Sec. 4] The method assumes that far-side magnetic structures 'remain nearly stable in the next 8 days' and then interprets GJ2/GJ3 as corrections to the eclipse-time boundary. The paper's own result that GJ3 (8-day splice) is worse than GJ2 (4-day splice), together with the summary statement that 'the far-side magnetic field undergoes dynamic changes over time,' shows that the stability assumption is not generally valid. This is load-bearing because the claimed improvement of GJ2 over GJ1 could reflect a specific 4-day snapshot that accidentally produces better streamer positions, rather than an accurate reconstruction of the eclipse-time far-side field. The authors should test the assumption, e.g., by comparing with SolO/PHI far-side observations if available, by using ADAPT or a flux-transport model to evolve the earlier data forward to April 8, or by demonstrating insensitivity of the ranking
- [Sec. 2.2] The heating parameter (SA/B)_sun is set separately for the AG map (7×10^5 W m^-2 T^-1) and the GJ1–GJ3 maps (8×10^5 W m^-2 T^-1), with the statement that these values were 'determined' by comparing simulation results, but no tuning criterion, searched range, or quantitative metric is given. This makes absolute comparisons between AG and the GJ family ambiguous: differences in pB magnitude, PSP agreement, and other variables could be partly due to the different heating parameter rather than to the photospheric map. The within-GJ comparison is not affected because all three use the same value, but the broader claim that the composite map 'improves the accuracy of coronal modeling' relative to AG needs a transparent tuning protocol and, ideally, a sensitivity test showing that the ranking of maps is stable across a reasonable range of (SA/B)_sun. Please report the metric used (e.g., pB morp
minor comments (6)
- [Abstract and Sec. 2.2] The abstract and introduction describe the method as establishing a foundation for 'multi-view, stereoscopic measurements.' Since the actual correction uses time-shifted single-view GONG magnetograms rather than simultaneous multi-view data, the wording is misleading. Please clarify that the paper uses a time-shifted approximation, with true stereoscopic observations as a future prospect.
- [Sec. 2.2] The sentence 'the only viable solution for measuring the evolution of the magnetic field in the far-side active region ... is to incorporate multi-view observations from PHI' is confusing because the paper itself uses GONG data without PHI. Please rephrase to distinguish the ideal future solution from the approximate method used here.
- [Sec. 3.3] The sign convention for 'northward' and 'southward' streamer deflections and the reference frame for position angles should be defined explicitly. A reader cannot reproduce the 3.6° and 16.8° numbers without this information.
- [Sec. 3.1, Fig. 3(b)] The gravitational potential energy density Eg in Eq. (B7) is negative, but the plotted profiles appear to show positive values. Please clarify whether the absolute value is plotted or whether the convention is different from the written equation, and ensure axis labels are consistent.
- [Sec. 3.2] The Dist index values are said to be shown in the corner of each panel, but the text does not report them or state which of the four variables quantitatively favors which map. Please list the numerical Dist values and discuss their statistical significance, especially since the conclusion drawn from PSP is mixed (AG better for speed and B_r; GJ2 better for density and temperature).
- [Sec. 3.1] The open-field area fractions for GJ1–GJ3 differ by less than 0.8 percentage points (14.22%, 14.13%, 14.90%). The text calls this a significant change, but no numerical uncertainty is given. If this difference is within the numerical noise of the AMR grid or the PFSS truncation, the claim should be softened.
Circularity Check
No significant circularity: the far-side boundary comparison is a controlled MHD experiment validated against external observations.
full rationale
The paper's central claim—that replacing the far-side magnetic boundary with later GONG magnetograms changes the global coronal solution and that the 4-day composite (GJ2) best matches observed streamer deflections—is not circular by construction. The comparison among GJ1, GJ2, and GJ3 is a controlled experiment: all three simulations share the same heating parameter value (8×10^5 W m−2 T−1 for GJ1–GJ3), so differences in the resulting corona trace to the changed boundary condition, not to per-map fitting. The validation data are external to the map-construction procedure: PSP in situ measurements, 2024 TSE pB observations, and LASCO C2 white-light images. The (S_A/B)_⊙ parameter is tuned, but it is a global heating calibration, not a parameter fitted to the specific streamer-deflection metric used to rank GJ2; the paper even notes that adjusting it to match pB magnitude would degrade morphological agreement. The far-side stability assumption ('we assume their magnetic structures remain nearly stable in the next 8 days') is an empirical approximation, not a circular definition of the result. Self-citations (e.g., Shi et al. 2024 for polar-field effects, Chen et al. 2025 for FastQSL) are ancillary and not load-bearing for the paper's core inference. The lack of a precisely specified streamer-position metric and uncertainty estimates is a rigor/reproducibility concern, but it is not a circularity: the simulation outputs are not equivalent to the boundary inputs by any equation in the paper. The claim that far-side structure alters the HCS and global plasma parameters is a genuine MHD response, not a renaming of the input map. Therefore no circular step can be exhibited, and the circularity score is 0.
Assumptions & free parameters
free parameters (6)
- (S_A/B)_sun, Alfven wave Poynting flux to magnetic field ratio =
7e5 W m-2 T-1 (AG map), 8e5 W m-2 T-1 (GJ1-GJ3 maps)
- L_perp * sqrt(B), Alfven wave correlation length constant =
1.5e5 m sqrt(T)
- Stochastic heating exponent and amplitude (Chandran et al. 2011) =
0.21 and 0.18
- Inner boundary temperature and number density =
T_sun = 5e4 K, N_sun = 2e11 cm-3
- PFSS source surface radius and harmonic order =
Rss = 25 R_sun, Nmax = 180
- Magnetogram splice time offsets and longitude spans =
4 and 8 days; -60 to +15 deg (GJ2) and -60 to +45 deg (GJ3) about the central meridian, latitudes -60 to +60 deg
assumptions (6)
- ad hoc to paper Far-side magnetic structures remain nearly stable over the 4 to 8 day interval between the eclipse and the replacement magnetograms.
- domain assumption AWSoM-R describes coronal heating and solar wind acceleration faithfully (Alfven wave turbulence, stochastic heating, separate electron and proton temperatures, low-beta steady-state approximation).
- domain assumption PFSS extrapolation with Rss = 25 R_sun and Nmax = 180 gives an acceptable initial coronal magnetic field.
- domain assumption The van de Hulst inversion (axisymmetric polynomial pB fit) recovers the true radial electron density profile from eclipse pB.
- domain assumption GONG full-disk magnetograms, after 1-hour averaging and projection into the Carrington grid, faithfully represent the photospheric radial field at the inserted longitudes, including near the limb and at up to +/-60 deg latitude.
- domain assumption The eclipse pB/tB radiometric calibration is accurate despite possible attenuation error.
Cite this review
Pith. "Pith review of The Role of Far-side Magnetic Structures in Modeling 2024 Solar Eclipse." pith.science (2026). https://pith.science/paper/DVDUTLTQ
@misc{pith2026250902911,
  author       = {Pith},
  title        = {Pith review of: The Role of Far-side Magnetic Structures in Modeling 2024 Solar Eclipse},
  year         = {2026},
  howpublished = {\url{https://pith.science/paper/DVDUTLTQ}},
  note         = {Machine review of arXiv:2509.02911}
}
read the original abstract
The corona is a crucial region that connects the solar surface to the solar wind and serves as the primary site of solar activity. The 2024 total solar eclipse (TSE) provides a unique opportunity to investigate the large-scale coronal structure. Combined with TSE observations, we study the impact of the magnetic structure of the far-side active region, located in the eastern hemisphere of the Sun that has not yet rotated into the Earth Field-of-View (FoV), on a global Magnetohydrodynamic (MHD) simulation. To address the limitation of single-view measurements in the routine synoptic map, we correct the magnetic field in the far-side region by incorporating full-disk magnetograms measured several days after the TSE, allowing us to capture the temporal evolution of the photospheric magnetic field in near real-time. Simulation results demonstrate that the local magnetic field in the far-side active region can significantly influence the global coronal structure by altering the position of the heliospheric current sheet (HCS), and further affect the global distribution of plasma parameters, even in polar regions. A comparison of the simulation results with white-light (WL) TSE + LASCO C2 observations and in situ measurements by the Parker Solar Probe (PSP) reveals that the composite synoptic map improves the accuracy of coronal modeling. This work provides robust support for advancing our understanding of coronal evolution, as well as deepens the link between the photosphere and large-scale coronal structure. Furthermore, it establishes a theoretical foundation for the future development of multi-view, stereoscopic measurements of the photospheric magnetic field.
Figures


Figures from the paper (3 more)


Reference graph
Works this paper leans on
-
[1]
Altschuler, M. D., & Newkirk, G. 1969, SoPh, 9, 131, doi: 10.1007/BF00145734
-
[2]
Arge, C. N., Henney, C. J., Koller, J., et al. 2010, in American Institute of Physics Conference Series, Vol. 1216, Twelfth International Solar Wind Conference, ed. M. Maksimovic, K. Issautier, N. Meyer-Vernet, M. Moncuquet, & F. Pantellini (AIP), 343–346, doi: 10.1063/1.3395870
-
[3]
Arge, C. N., & Pizzo, V. J. 2000, JGR, 105, 10465, doi: 10.1029/1999JA000262
-
[4]
Aschwanden, M. J. 2005, Physics of the Solar Corona. An Introduction with Problems and Solutions (2nd edition) (New York: Springer) Auch` ere, F., Soubri´ e, E., Pelouze, G., & Buchlin,´E. 2023, A&A, 670, A66, doi: 10.1051/0004-6361/202245345
-
[5]
Bale, S. D., Goetz, K., Harvey, P. R., et al. 2016, SSRv, 204, 49, doi: 10.1007/s11214-016-0244-5
-
[6]
2023, ApJ, 946, 14, doi: 10.3847/1538-4357/acb8b8
Bemporad, A. 2023, ApJ, 946, 14, doi: 10.3847/1538-4357/acb8b8
-
[7]
Benavitz, L. F., Boe, B., & Habbal, S. R. 2024, ApJ, 974, 178, doi: 10.3847/1538-4357/ad71c6
-
[8]
2023, ApJ, 951, 55, doi: 10.3847/1538-4357/acd10b
Boe, B., Downs, C., & Habbal, S. 2023, ApJ, 951, 55, doi: 10.3847/1538-4357/acd10b
Show all 58 references
-
[9]
2021, ApJ, 912, 44, doi: 10.3847/1538-4357/abea79
Boe, B., Habbal, S., Downs, C., & Druckm¨ uller, M. 2021, ApJ, 912, 44, doi: 10.3847/1538-4357/abea79
2021 doi
-
[10]
2022, ApJ, 935, 173, doi: 10.3847/1538-4357/ac8101
Boe, B., Habbal, S., Downs, C., & Druckm¨ uller, M. 2022, ApJ, 935, 173, doi: 10.3847/1538-4357/ac8101
2022 doi
-
[11]
E., Howard, R
Brueckner, G. E., Howard, R. A., Koomen, M. J., et al. 1995, SoPh, 162, 357, doi: 10.1007/BF00733434
1995 doi
-
[12]
Chandran, B. D. G., Dennis, T. J., Quataert, E., & Bale, S. D. 2011, ApJ, 743, 197, doi: 10.1088/0004-637X/743/2/197
2011 doi
-
[13]
Y., Zhang, H
Deng, Y. Y., Zhang, H. Y., Yang, J. F., et al. 2019, RAA, 19, 157, doi: 10.1088/1674-4527/19/11/157
2019 doi
-
[14]
Y., Tian, H., Jiang, J., et al
Deng, Y. Y., Tian, H., Jiang, J., et al. 2025, arXiv e-prints, arXiv:2506.20502, doi: 10.48550/arXiv.2506.20502
2025 doi
-
[15]
P., Landi, E., Mason, H
Dere, K. P., Landi, E., Mason, H. E., Monsignori Fossi, B. C., & Young, P. R. 1997, A&AS, 125, 149, doi: 10.1051/aas:1997368
1997 doi
-
[16]
Domingo, V., Fleck, B., & Poland, A. I. 1995, SoPh, 162, 1, doi: 10.1007/BF00733425
1995 doi
-
[17]
A., Caplan, R
Downs, C., Linker, J. A., Caplan, R. M., et al. 2025, Science, 388, 1306, doi: 10.1126/science.adq0872
2025 doi
-
[18]
2019, Research in Astronomy and Astrophysics, 19, 059, doi: 10.1088/1674-4527/19/4/59
Feng, L., Li, H., Inhester, B., et al. 2019, Research in Astronomy and Astrophysics, 19, 059, doi: 10.1088/1674-4527/19/4/59
2019 doi
-
[19]
J., Velli, M
Fox, N. J., Velli, M. C., Bale, S. D., et al. 2016, SSRv, 204, 7, doi: 10.1007/s11214-015-0211-6
2016 doi
-
[20]
2023, SoPh, 298, 68, doi: 10.1007/s11207-023-02166-x 15
Gan, W., Zhu, C., Deng, Y., et al. 2023, SoPh, 298, 68, doi: 10.1007/s11207-023-02166-x 15
2023 doi
-
[21]
2024, Frontiers in Astronomy and Space Sciences, 11, 1458746, doi: 10.3389/fspas.2024.1458746
Hanaoka, Y., Sakai, Y., & Masuda, Y. 2024, Frontiers in Astronomy and Space Sciences, 11, 1458746, doi: 10.3389/fspas.2024.1458746
2024
-
[22]
2021, SoPh, 296, 158, doi: 10.1007/s11207-021-01907-0
Hanaoka, Y., Sakai, Y., & Takahashi, K. 2021, SoPh, 296, 158, doi: 10.1007/s11207-021-01907-0
2021 doi
-
[23]
W., Hill, F., Hubbard, R
Harvey, J. W., Hill, F., Hubbard, R. P., et al. 1996, Sci, 272, 1284, doi: 10.1126/science.272.5266.1284
1996
-
[24]
S., Godinez, H
Hickmann, K. S., Godinez, H. C., Henney, C. J., & Arge, C. N. 2015, SoPh, 290, 1105, doi: 10.1007/s11207-015-0666-3
2015 doi
-
[25]
C., Abiad, R., Austin, G., et al
Kasper, J. C., Abiad, R., Austin, G., et al. 2016, SSRv, 204, 131, doi: 10.1007/s11214-015-0206-3
2016 doi
-
[26]
2019, RAA, 19, 165, doi: 10.1088/1674-4527/19/11/165
Li, C., Fang, C., Li, Z., et al. 2019, RAA, 19, 165, doi: 10.1088/1674-4527/19/11/165
2019 doi
-
[27]
A., Miki´ c, Z., Biesecker, D
Linker, J. A., Miki´ c, Z., Biesecker, D. A., et al. 1999, JGR, 104, 9809, doi: 10.1029/1998JA900159
1999 doi
-
[28]
A., Caplan, R
Linker, J. A., Caplan, R. M., Downs, C., et al. 2017, ApJ, 848, 70, doi: 10.3847/1538-4357/aa8a70
2017 doi
-
[29]
A., & Miki´ c, Z
Lionello, R., Linker, J. A., & Miki´ c, Z. 2009, ApJ, 690, 902, doi: 10.1088/0004-637X/690/1/902
2009 doi
- [30]
-
[31]
Z., et al
Liu, Z., Xu, J., Gu, B. Z., et al. 2014, RAA, 14, 705, doi: 10.1088/1674-4527/14/6/009
2014 doi
-
[32]
E., Kasper, J
Livi, R., Larson, D. E., Kasper, J. C., et al. 2022, ApJ, 938, 138, doi: 10.3847/1538-4357/ac93f5
2022 doi
-
[33]
H., Zank, G
Matthaeus, W. H., Zank, G. P., Oughton, S., Mullan, D. J., & Dmitruk, P. 1999, ApJL, 523, L93, doi: 10.1086/312259
1999 doi
-
[34]
2022, ApJS, 262, 23, doi: 10.3847/1538-4365/ac8551
Mayank, P., Vaidya, B., & Chakrabarty, D. 2022, ApJS, 262, 23, doi: 10.3847/1538-4365/ac8551
2022 doi
-
[35]
Meng, X., van der Holst, B., T´ oth, G., & Gombosi, T. I. 2015, MNRAS, 454, 3697, doi: 10.1093/mnras/stv2249 Miki´ c, Z., Downs, C., Linker, J. A., et al. 2018, NatAs, 2, 913, doi: 10.1038/s41550-018-0562-5
2015 doi
-
[36]
E., Casini, R., Bryans, P., Berkey, B., & Tyson, K
Molnar, M. E., Casini, R., Bryans, P., Berkey, B., & Tyson, K. 2025, arXiv e-prints, arXiv:2501.01009, doi: 10.48550/arXiv.2501.01009 M¨ uller, D., St. Cyr, O. C., Zouganelis, I., et al. 2020, A&A, 642, A1, doi: 10.1051/0004-6361/202038467
-
[37]
J., & Arge, C
Odstrcil, D., Pizzo, V. J., & Arge, C. N. 2005, JGRA, 110, A02106, doi: 10.1029/2004JA010745
2005 doi
-
[38]
2022, ApJ, 936, 19, doi: 10.3847/1538-4357/ac7237
Perri, B., Leitner, P., Brchnelova, M., et al. 2022, ApJ, 936, 19, doi: 10.3847/1538-4357/ac7237
2022 doi
-
[39]
D., Thompson, B
Pesnell, W. D., Thompson, B. J., & Chamberlin, P. C. 2012, SoPh, 275, 3, doi: 10.1007/s11207-011-9841-3
2012 doi
-
[40]
2018, JSWSC, 8, A35, doi: 10.1051/swsc/2018020
Pomoell, J., & Poedts, S. 2018, JSWSC, 8, A35, doi: 10.1051/swsc/2018020
2018
-
[41]
A., Mikic, Z., et al
Riley, P., Linker, J. A., Mikic, Z., et al. 2019, ApJ, 884, 18, doi: 10.3847/1538-4357/ab3a98
2019 doi
-
[42]
R., Warner, M., Keil, S
Rimmele, T. R., Warner, M., Keil, S. L., et al. 2020, SoPh, 295, 172, doi: 10.1007/s11207-020-01736-7
2020 doi
-
[43]
B., et al
Sachdeva, N., van der Holst, B., Manchester, W. B., et al. 2019, ApJ, 887, 83, doi: 10.3847/1538-4357/ab4f5e
2019 doi
-
[44]
B., et al
Sachdeva, N., T´ oth, G., Manchester, W. B., et al. 2021, ApJ, 923, 176, doi: 10.3847/1538-4357/ac307c10.1002/essoar.10507983.3
2021 doi
-
[45]
H., Wilcox, J
Schatten, K. H., Wilcox, J. M., & Ness, N. F. 1969, SoPh, 6, 442, doi: 10.1007/BF00146478
1969 doi
-
[46]
H., Schou, J., Bush, R
Scherrer, P. H., Schou, J., Bush, R. I., et al. 2012, SoPh, 275, 207, doi: 10.1007/s11207-011-9834-2
2012 doi
-
[47]
2024, ApJ, 970, 131, doi: 10.3847/1538-4357/ad5200
Shi, G., Feng, L., Ying, B., Li, S., & Gan, W. 2024, ApJ, 970, 131, doi: 10.3847/1538-4357/ad5200
2024 doi
-
[48]
V., van der Holst, B., Oran, R., et al
Sokolov, I. V., van der Holst, B., Oran, R., et al. 2013, ApJ, 764, 23, doi: 10.1088/0004-637X/764/1/23
2013 doi
-
[49]
V., Holst, B
Sokolov, I. V., Holst, B. v. d., Manchester, W. B., et al. 2021, ApJ, 908, 172, doi: 10.3847/1538-4357/abc000
2021 doi
-
[50]
K., del Toro Iniesta, J
Solanki, S. K., del Toro Iniesta, J. C., Woch, J., et al. 2020, A&A, 642, A11, doi: 10.1051/0004-6361/201935325 T´ oth, G., van der Holst, B., Sokolov, I. V., et al. 2012, JCoPh, 231, 870, doi: 10.1016/j.jcp.2011.02.006 van de Hulst, H. C. 1950, BAN, 11, 135 van der Holst, B.,...
2020 doi
-
[51]
Kasper, J. C. 2019, ApJL, 872, L18, doi: 10.3847/2041-8213/ab04a5 van der Holst, B., Sokolov, I. V., Meng, X., et al. 2014, ApJ, 782, 81, doi: 10.1088/0004-637X/782/2/81 van der Holst, B., Huang, J., Sachdeva, N., et al. 2022, ApJ, 925, 146, doi: 10.3847/1538-4357/ac3d34
2019 doi
-
[52]
1989, PhRvL, 63, 1807, doi: 10.1103/PhysRevLett.63.1807
Velli, M., Grappin, R., & Mangeney, A. 1989, PhRvL, 63, 1807, doi: 10.1103/PhysRevLett.63.1807
1989 doi
-
[53]
G., & Pomoell, J
Wagner, A., Asvestari, E., Temmer, M., Heinemann, S. G., & Pomoell, J. 2022, A&A, 657, A117, doi: 10.1051/0004-6361/202141552
2022 doi
-
[54]
M., & Sheeley, Jr., N
Wang, Y. M., & Sheeley, Jr., N. R. 1990, ApJ, 355, 726, doi: 10.1086/168805
1990 doi
-
[55]
R., Dolch, T
Young, O. R., Dolch, T. E., Helmboldt, J. F., et al. 2025, ApJ, 979, 203, doi: 10.3847/1538-4357/ada26e
2025 doi
-
[56]
P., Dosch, A., Hunana, P., et al
Zank, G. P., Dosch, A., Hunana, P., et al. 2012, ApJ, 745, 35, doi: 10.1088/0004-637X/745/1/35
2012 doi
-
[57]
P., Matthaeus, W
Zank, G. P., Matthaeus, W. H., & Smith, C. W. 1996, JGR, 101, 17093, doi: 10.1029/96JA01275
1996 doi
-
[58]
J., Chen, J., Liu, R., & Wang, C
Zhang, P. J., Chen, J., Liu, R., & Wang, C. B. 2022, ApJ, 937, 26, doi: 10.3847/1538-4357/ac8d61
2022 doi
Reviewed August 5, 2026 · model on record in the stance chip above.
Discussion (0). Continue with ORCID to comment.