REVIEW 4 major objections 4 minor 104 references
A MUltiwavelength Study of ELAN Environments (AMUSE$^2$): The Impact of Dense Environment on Massive Dusty Star-Forming Galaxies at Cosmic Noon
T0 review · 4 major / 4 minor · reviewed 2026-08-15 · deepseek-v4-flash
Pith's one-line read Dense quasar halos deplete gas in dusty galaxies only inside the halo, at roughly 100–200 kpc scales at cosmic noon.
desk verdict Solid new CO data for 15 SMGs around quasars, but the headline claim that environment matters only inside the virial radius is carried by a pile of assumptions and sub-2sigma medians. read the letter →
The pith
A machine-rendered reading of the paper's core claim, the machinery that carries it, and where it could break.
The reading
What carries the argument
The load-bearing element is the gas-fraction estimator of Chen et al. (2021), Equation (2), which converts a measured CO line width and CO line luminosity into a gas fraction by assuming a rotation-dominated disk in dynamical equilibrium with a fixed half-light radius re=3 kpc, a CO-to-H2 conversion factor αCO=1.0, and a dark-matter fraction fDM=0.12. This estimator lets the authors compare gas fractions across samples that lack direct stellar masses. The virial radius split, which sets the boundary between 'inside halo' and 'outside halo,' assumes quasar halos of mass ~$10^{12}$.5 Msun and treats projected distances as physical separations. The comparison also relies on published field SMG samples to anchor the expected field values.
What would settle it
A direct test is deeper CO spectroscopy of dusty galaxies at projected distances just outside the virial radius, reaching the CO luminosities typical of the inside-halo sources: if those faint outer galaxies show gas fractions as low as the depleted inner ones, the boundary at the virial radius disappears. Alternatively, stellar-mass-based gas fractions or kinematic inclination measurements for a few galaxies near the boundary would reveal whether the fixed disk assumptions create the trend artificially.
Extended reading notes
Core claim
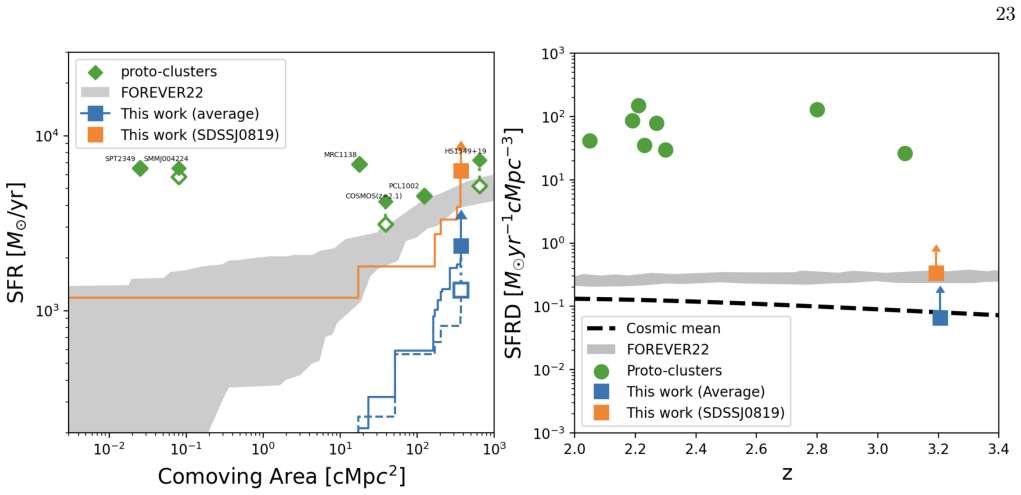
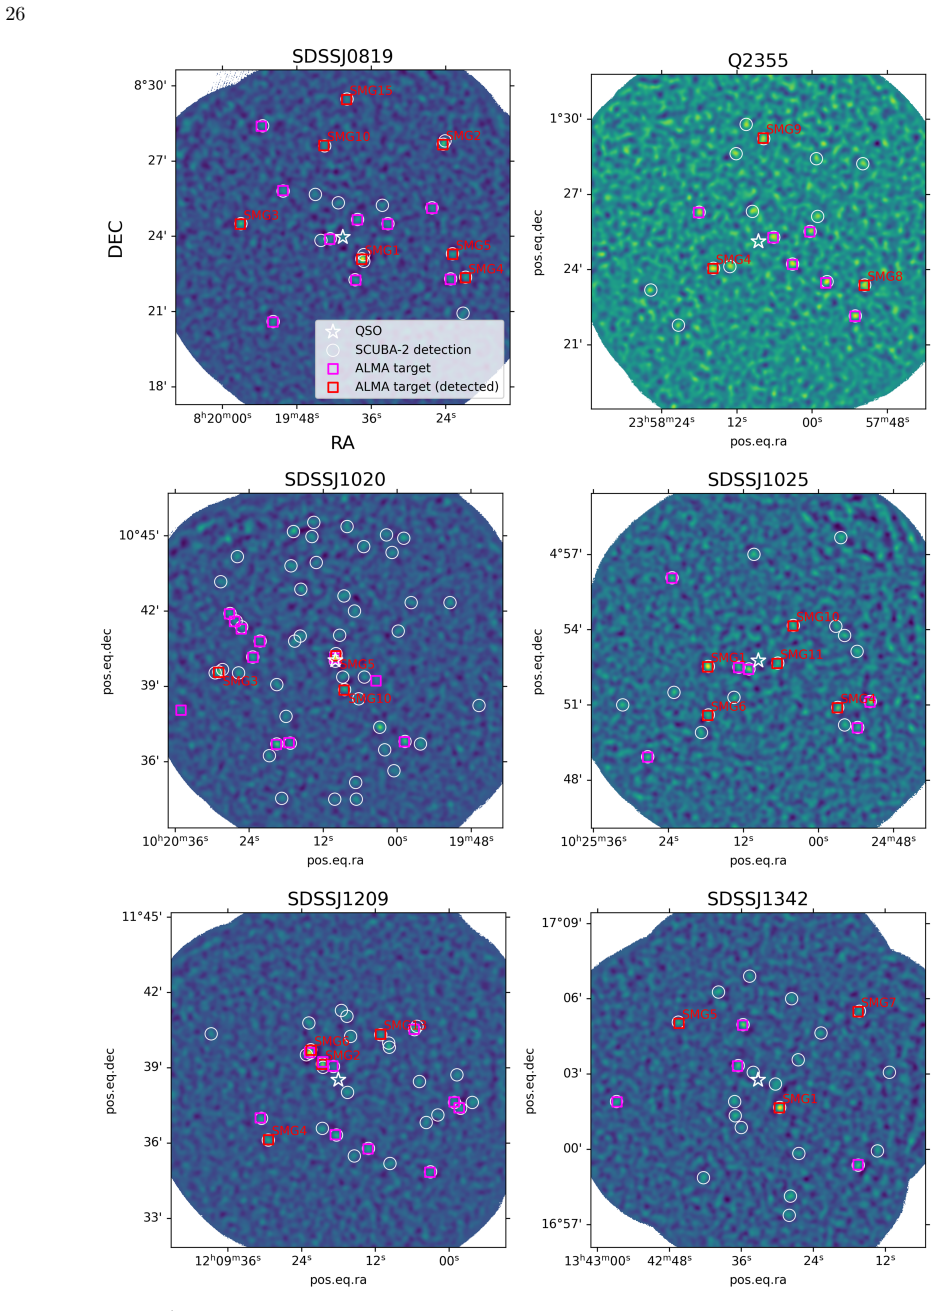
The central claim is that the molecular gas fraction of dusty star-forming galaxies depends on their distance from a quasar: galaxies inside the quasar's virial radius have depleted gas fractions comparable to the quasar hosts, while galaxies outside the virial radius are indistinguishable from field submillimeter galaxies. The evidence is a set of ALMA and NOEMA CO detections around nine quasars at z≈2–3, combined with published measurements of dusty galaxies and quasars at similar redshifts. The paper also reports that 73% of its confirmed CO emitters are better fit by double-Gaussian line profiles with a median peak separation of 350±25 km/s, consistent with rotating disks or interacting pairs, and that the spatial distribution of confirmed members traces a filament-like structure with a scale height of 2–5 comoving Mpc, though this structural detection is statistically tentative. Its cumulative star-formation rates are lower limits and agree with simulation predictions once the comparison volumes are matched.
Load-bearing premise
The result depends on converting measured CO line widths and luminosities into gas fractions with a fixed set of assumptions—rotation-dominated disks, half-light radius of 3 kpc, CO conversion factor of 1.0, and a dark-matter fraction of 0.12—and on treating the quasars as $10^{12}$.5 Msun halos with projected distances equal to true separations. If those assumptions fail, the gas-depletion trend inside virial radii is not established.
Editorial extensions
If this is right
- If the central claim is correct, the dense quasar environment stops modifying the interstellar medium of massive dusty galaxies at roughly the halo boundary (~100–200 kpc), while galaxies beyond that distance remain essentially field-like.
- Previously contradictory results would be reconciled: studies that measured galaxies at megaparsec separations would naturally see little environmental effect, while studies probing the core would see depleted gas fractions.
- Dusty galaxies inside the virial radius are consistent with being gravitationally bound to the quasar halo, while those outside are consistent with the Hubble flow, so the measured gas fractions can be mapped onto infall through the halo periphery.
- The filament-like arrangement of confirmed members, with similar widths in the sky and line-of-sight directions (λ ≈ 4.0 and 3.5 cMpc), supports a cylindrical or elongated pancake shape for the large-scale structure traced by these galaxies.
- The measured star-formation rate densities are lower limits, and once comparison volumes are matched to simulations they agree with model predictions, so future deeper surveys are needed before claiming a tension between observations and simulations.
Reading between the lines
- If the radial gas-fraction trend is real, it implies that gas loss begins at first infall through the virial radius, before cluster-core processes act; the natural mechanisms are ram-pressure stripping or strangulation by the hot halo, though the paper does not establish which one operates.
- A testable extension is to measure gas fractions for individual dusty galaxies with inclination corrections and stellar-mass-based estimates on both sides of the virial radius; the median split seen in the paper should sharpen rather than wash out if the claim is correct.
- The double-Gaussian line fraction matching field SMGs suggests that the internal kinematics of these galaxies are largely set before they enter the halo, since the environment does not yet dominate their dynamics at these separations.
- A prediction implicit in this picture is that the brightest dusty galaxies inside the virial radius should show either an elevated star-formation efficiency or a suppressed star-formation rate relative to their gas mass; existing infrared and CO measurements could test this directly.
Signed reviews
Editorial analysis
A structured set of objections, weighed in public.
Referee Report
Summary. This manuscript presents ALMA and NOEMA CO(4-3)/CO(3-2) follow-up of 101 SCUBA-2 850 micron sources in nine z~2-3 quasar fields hosting Ly-a nebulae, confirming 15 physically associated SMGs. The authors derive CO line kinematics, far-infrared SEDs, gas fractions, depletion timescales, and gas-to-dust ratios, and compare these with field SMGs and literature DSFGs around quasars. They report that SMGs outside quasar virial radii resemble field SMGs, while DSFGs inside the virial radius show depleted gas fractions, and that the SMGs trace tentative filamentary structures with scale widths of a few cMpc. Cumulative star-formation rates and SFR densities are compared with simulations and other protocluster observations and are explicitly flagged as lower limits.
Significance. If the main deduction holds, the paper provides one of the first environmental-gradient measurements for massive dusty galaxies at cosmic noon, with a separation scale set by the quasar halo virial radius. The strengths include the careful ALMA/NOEMA reduction, the Monte Carlo completeness and false-detection analyses, the AICc-based line-profile selection, and the explicit caveats about lower limits and the tentative filament detection. The main limitation is that the headline gas-fraction gradient rests on a heterogeneous comparison and on median differences whose statistical significance is not demonstrated; the conclusion is therefore plausible but not yet established at the strength claimed in the abstract and Section 4.1.6.
major comments (4)
- [§4.1.2, Eq. (2), footnote 2] The gas-fraction comparison in Figure 9 is not apples-to-apples. The inside-halo literature points are restricted to single-Gaussian fits, as stated in footnote 2, while the outside-halo sample plotted in blue includes all primary sources, 73% of which are better described by double Gaussians (§3.1.1). Equation (2) assumes a single rotation-dominated disk in dynamical equilibrium; for the double-Gaussian sources the FWHM entered in Eq. (2) is a composite width defined in §3.1.1, not the width of a single dynamically relaxed component, so the outside fgas values are not on the same footing as the inside values. I ask the authors to recompute fgas for the full sample with a uniform single-Gaussian extraction, or to restrict both sides to kinematically simple sources, and to show that the inside/outside gradient survives that restriction.
- [§4.1.2, Figure 9] The central claim of gas depletion inside the virial radius is not supported by a reported statistical test. The medians are fgas = 26±13 inside, 92±40 outside, and 50±25 for field SMGs; the inside/outside contrast is only about 1.6σ and the outside/field contrast about 0.9σ, yet no two-sample test is given. Because the conclusion is built on these medians, the authors should report bootstrap or rank-sum p-values for each pairwise comparison and for a trend of fgas with projected distance, and state how many individual sources drive the gradient.
- [§4.1.2, Figures 9-10] The inside/outside classification depends on the assumed halo mass and on treating projected separation as a 3D distance. For Mhalo = 10^12.5 Msun at z~3 the virial radius is ~100-200 kpc, but changing Mhalo by a factor of a few moves Rvir by a comparable factor, and sources near the boundary can switch bins under a mild deprojection. The authors should test the sensitivity of the median fgas gradient to Mhalo in the range 10^12-10^13 Msun and to a simple statistical deprojection, and report how many sources change classification.
- [§4.1.2, Figure 8] The outside-halo sample comes from a survey that preferentially detects high-L'CO sources, and the text acknowledges that fainter CO sources outside the virial radius may be missed. This selection effect could bias the outside median fgas upward relative to the deeper literature samples used for the inside and field comparisons. The comparison should be strengthened by applying the same L'CO/FWHM sensitivity cut to all three samples, or by computing upper limits for the non-detected sources and recomputing the gradient with those limits.
minor comments (4)
- [§5, conclusion item 5] The conclusion quotes filament widths of 4.9±2.3 cMpc (x-y) and 5.8±3.1 cMpc (x-z), whereas Section 4.2 reports λ = 4.0±2.6 cMpc (x-y) and λ = 3.5±2.2 cMpc (x-z); please reconcile the two sets of numbers.
- [§4.1.2] The text contains a typo: 'with a mdeian fgas of 26 ± 13' should read 'with a median fgas of 26 ± 13'.
- [References] The reference entry for Wang et al. (2024) reads 'arVix, 240616637W' and appears malformed; please correct it to the full arXiv identifier and journal information.
- [§3.1.2 and Figure 3] The curve-of-growth correction is applied as a single factor of 2.0 to all sources based on the median/mean convergence; please state explicitly how the scatter among individual curves is propagated into the line luminosities and the derived fgas values.
Circularity Check
No significant circularity: the headline gas-fraction comparison is a meta-analysis of new and published measurements using an independent published estimator, not a fit renamed as a prediction.
full rationale
No circularity found. The central environmental claim is a comparison: the new AMUSE^2 SMGs (located outside the expected virial radii) are compared with published field SMG samples and with published dusty galaxies around quasars, with fgas computed via Eq. (2) from Chen et al. (2021) using fixed, stated assumptions (re = 3 kpc, alpha_CO = 1.0, fDM = 0.12). Eq. (2) is an independent published dynamical-mass estimator, not derived from the present targets, and the paper explicitly says it focuses on average trends rather than individual values; it does not fit the inside/outside fgas values as free parameters. The inside-halo literature points come from other programs and were not generated by this paper's pipeline; some have overlapping authors (Chen et al. 2021; Arrigoni Battaia et al. 2022; Wang et al. 2024), but those are externally published measurements and are used as data points, not as an authority that forbids alternatives. The outside/field comparison uses independent samples (Birkin et al. 2021; Liao et al. 2024; Dudzeviciute et al. 2020), so the claimed depletion gradient is not equivalent to the paper's own inputs. The spatial filament analysis uses rotation angles from Arrigoni Battaia et al. (2023) derived from 2D sky positions, but the new x-z alignment is a different, previously untested projection and is evaluated with Monte Carlo significance tests; no quantity in that section is defined in terms of the claimed conclusion. The possible statistical weaknesses noted by a skeptic (heterogeneous double- vs single-Gaussian line-profile selection, medians differing at below ~2-sigma, projected-distance assumptions) are robustness and evidence-strength concerns, not circular derivation. Because the paper is self-contained against external benchmarks and its load-bearing comparisons rely on independent data and an external estimator, the appropriate circularity score is 0.
Assumptions & free parameters
free parameters (8)
- Dust emissivity index beta (fixed) =
2.0
- Half-light radius re =
3 kpc
- CO-to-H2 conversion factor alpha_CO =
1.0
- Dark matter fraction fDM =
0.12
- Quasar halo mass Mhalo =
10^12.5 Msun
- CO excitation ratios r31 and r41 =
0.63 +/- 0.12 and 0.34 +/- 0.04
- NFW concentration c =
3.5
- Filament scale width lambda =
4.0 +/- 2.6 cMpc (x-y) and 3.5 +/- 2.2 (x-z) in Sec 4.2; 4.9 +/- 2.3 and 5.8 +/- 3.1 in Sec 5
assumptions (8)
- standard math Planck 2014 cosmology with H0=67.8, OmegaM=0.307 and OmegaLambda=0.69
- domain assumption Optically thin modified blackbody (tau << 1) for far-infrared SED fits
- domain assumption Line identifications are CO(4-3) for ALMA detections and CO(3-2) for NOEMA detections
- domain assumption Relative velocity within +/- 7000 km/s of the quasar defines physical association with the same large-scale structure
- domain assumption Dynamical equilibrium of rotation-dominated disks holds for the SMGs
- domain assumption Exponential distribution of perpendicular distances describes filament width
- domain assumption Field comparison samples are representative and comparable to the target sample
- domain assumption NFW halo profile with concentration c=3.5 describes the quasar halo potential
Cite this review
Pith. "Pith review of A MUltiwavelength Study of ELAN Environments (AMUSE$^2$): The Impact of Dense Environment on Massive Dusty Star-Forming Galaxies at Cosmic Noon." pith.science (2026). https://pith.science/paper/UHFKNG75
@misc{pith2026250903027,
  author       = {Pith},
  title        = {Pith review of: A MUltiwavelength Study of ELAN Environments (AMUSE$^2$): The Impact of Dense Environment on Massive Dusty Star-Forming Galaxies at Cosmic Noon},
  year         = {2026},
  howpublished = {\url{https://pith.science/paper/UHFKNG75}},
  note         = {Machine review of arXiv:2509.03027}
}
abstract
To understand how massive galaxies are influenced by their surroundings, we present new ALMA and NOEMA observations as part of A MUltiwavelength Study of ELAN Environments (AMUSE$^2$). These observations target submillimeter sources discovered in single-dish surveys around nine quasars hosting Ly$\alpha$ nebulae at $z=2\sim3$, including two Enormous Ly$\alpha$ nebulae (ELANe). Through detection of mid-$J$ CO lines, we confirm physical associations of 15 SMGs, which are located outside the expected virial radii of the central dark-matter halos hosting the quasars. We find $73^{+29}_{-21}\%$ of SMGs have line profiles better described by double Gaussian models, with a median peak-to-peak separation of 350 $\pm$ 25 km/s, suggesting rotating disks or interacting pairs. Modified blackbody fits of the far-infrared photometry yield a median $\beta$ of 2.0 $\pm$ 0.2 and $T_{dust}$ of 34 $\pm$ 3 K. Overall, SMGs outside quasar halos share similar physical properties with those in the field, but combining data from other studies reveals depleted gas fractions within quasar halos. This suggests that dense environments significantly impact massive star-forming galaxies only within halo scales at cosmic noon. Additionally, spatial analyses of 15 SMGs indicate they trace large-scale structures, possibly filamentary or elongated pancake-like, with a scale height of 2-5\,cMpc. Our measured distributions and densities of star-formation rates align with models, though likely represent lower limits.
Figures


Figures from the paper (19 more)




Reference graph
Works this paper leans on
-
[1]
""""""""
thebibliography [1] 20pt to REFERENCES 6pt =0pt -12pt 10pt plus 3pt =0pt =0pt =1pt plus 1pt =0pt =0pt -12pt =13pt plus 1pt =20pt =13pt plus 1pt \@M =10000 =-1.0em =0pt =0pt 0pt =0pt =1.0em @enumiv\@empty 10000 10000 `\.\@m \@noitemerr \@latex@warning Empty `thebibliography' environment \@ifnextchar \@reference \@latexerr Missing key on reference command E...
2021
-
[2]
C., Swinbank, A
Alaghband-Zadeh, S., Chapman, S. C., Swinbank, A. M., et al. 2013, mnras, 435, 1493
2013
-
[3]
2022, ApJ, 927, 235
Alberts, S., Adams, J., Gregg, B., et al. 2022, ApJ, 927, 235
2022
-
[4]
2022, Universe, 8, 554, 10.3390/universe8110554
Alberts , S., & Noble , A. 2022, Universe, 8, 554, 10.3390/universe8110554
-
[5]
Amvrosiadis , A., Wardlow , J. L., Birkin , J. E., et al. 2025, , 536, 3757, 10.1093/mnras/stae2760
-
[6]
2019, ApJ, 882, 136
Aravena, M., Decarli, R., Gónzalez-López, J., et al. 2019, ApJ, 882, 136
2019
-
[7]
Araya-Araya , P., Cochrane , R. K., Hayward , C. C., et al. 2024, arXiv e-prints, arXiv:2408.00062, 10.48550/arXiv.2408.00062
-
[8]
Arrigoni Battaia , F., Hennawi , J. F., Prochaska , J. X., et al. 2019 a , , 482, 3162, 10.1093/mnras/sty2827
Show all 104 references
-
[9]
X., Hennawi , J
Arrigoni Battaia , F., Prochaska , J. X., Hennawi , J. F., et al. 2018, , 473, 3907, 10.1093/mnras/stx2465
2018 doi
-
[10]
X., et al
Arrigoni Battaia , F., Obreja , A., Prochaska , J. X., et al. 2019 b , , 631, A18, 10.1051/0004-6361/201936211
2019 doi
-
[11]
B., et al
Arrigoni Battaia, F., Chen, C.-C., Liu, H.-Y. B., et al. 2022, , 930, 72
2022
-
[12]
2023, A&A, 676, A51
Arrigoni Battaia, F., Obreja, A., Chen, C.-C., et al. 2023, A&A, 676, A51
2023
-
[13]
M., Nelson , D., & White , S
Ayromlou , M., Kauffmann , G., Yates , R. M., Nelson , D., & White , S. D. M. 2021, , 505, 492, 10.1093/mnras/stab1245
2021 doi
-
[14]
2020, A&A, 642, 19
Bassini, L., Rasia, E., Borgani, S., et al. 2020, A&A, 642, 19
2020
-
[15]
2020, , 642, A37, 10.1051/0004-6361/202038396
Bassini , L., Rasia , E., Borgani , S., et al. 2020, , 642, A37, 10.1051/0004-6361/202038396
2020 doi
-
[16]
2025, , 696, A193, 10.1051/0004-6361/202452894
Berta , S., Lagache , G., Beelen , A., et al. 2025, , 696, A193, 10.1051/0004-6361/202452894
2025 doi
-
[17]
E., Weiss, A., Wardlow, J
Birkin, J. E., Weiss, A., Wardlow, J. L., et al. 2021, MNRAS, 501, 3926
2021
-
[18]
2013, A&A, 645, 338
Bischetti, M., Feruglio, C., Piconcelli, E., et al. 2013, A&A, 645, 338
2013
-
[19]
A., Decarli, R., Walter, F., et al
Boogaard, L. A., Decarli, R., Walter, F., et al. 2023, , 945, 111
2023
-
[20]
S., Smail, I., Chapman, S
Bothwell, M. S., Smail, I., Chapman, S. C., et al. 2013, mnras, 429, 3047
2013
-
[21]
2017, , 837, 71, 10.3847/1538-4357/aa5d14
Cai , Z., Fan , X., Yang , Y., et al. 2017, , 837, 71, 10.3847/1538-4357/aa5d14
2017 doi
-
[22]
X., Hennawi , J
Cantalupo , S., Arrigoni-Battaia , F., Prochaska , J. X., Hennawi , J. F., & Madau , P. 2014, , 506, 63, 10.1038/nature12898
2014 doi
-
[23]
X., Hennawi, J
Cantalupo, S., Arrigoni Battaia, F., Prochaska, J. X., Hennawi, J. F., & Madau, P. 2014, nature, 506, 63
2014
-
[24]
L., & Walter, F
Carilli, C. L., & Walter, F. 2013, ARA&A, 51, 105
2013
-
[25]
Casey, C. M. 2012, MNRAS, 425, 3094
2012
-
[26]
M., Cooray, A., Capak, P., et al
Casey, C. M., Cooray, A., Capak, P., et al. 2015, , 808, 33
2015
-
[27]
M., Zavala, J
Casey, C. M., Zavala, J. A., Manning, S. M., et al. 2021, ApJ, 923, 215
2021
-
[28]
Cautun, M., van de Weygaert, R., Jones, B. J. T., & Frenk, C. S. 2014, MNRAS, 441, 2923
2014
-
[29]
C., Blain , A
Chapman , S. C., Blain , A. W., Smail , I., & Ivison , R. J. 2005, , 622, 772, 10.1086/428082
2005 doi
-
[30]
Chen, C.-C., Arrigoni Battaia, F., Emonts, B. H. C., Lehnert, M. D., & Prochaska, J. X. 2021, , 923, 200
2021
-
[31]
M., et al
Chen , C.-C., Smail , I., Swinbank , A. M., et al. 2016, , 831, 91, 10.3847/0004-637X/831/1/91
2016 doi
-
[32]
J., et al
Chen, C.-C., Smail, I., Ivison, R. J., et al. 2016, , 820, 82
2016
-
[33]
2022, , 929, 159, 10.3847/1538-4357/ac61df
Chen , C.-C., Liao , C.-L., Smail , I., et al. 2022, , 929, 159, 10.3847/1538-4357/ac61df
2022 doi
-
[34]
2022, ApJ, 929, 22
Chen, C.-C., Liao, C.-L., Smail, I., et al. 2022, ApJ, 929, 22
2022
-
[35]
2013, , 779, 127, 10.1088/0004-637X/779/2/127
Chiang , Y.-K., Overzier , R., & Gebhardt , K. 2013, , 779, 127, 10.1088/0004-637X/779/2/127
2013 doi
-
[36]
L., Braglia, F
Clements, D. L., Braglia, F. G., Hyde, A. K., et al. 2014, MNRAS, 439, 1193
2014
-
[37]
R., Casey , C
Cooper , O. R., Casey , C. M., Zavala , J. A., et al. 2022, , 930, 32, 10.3847/1538-4357/ac616d
2022 doi
-
[38]
2023, , 678, A26, 10.1051/0004-6361/202346801
Cox , P., Neri , R., Berta , S., et al. 2023, , 678, A26, 10.1051/0004-6361/202346801
2023 doi
-
[39]
A., Casey, C
da Cunha, E., Hodge, J. A., Casey, C. M., et al. 2021, ApJ, 919, 30
2021
-
[40]
D., De Breuck, C., et al
Dannerbauer, H., Kurk, J. D., De Breuck, C., et al. 2014, , 570, 55
2014
-
[41]
D., Emonts, B., et al
Dannerbauer, H., Lehnert, M. D., Emonts, B., et al. 2017, A&A, 608, 48
2017
-
[42]
2020, , 902, 110
Decarli, R., Aravena, M., Boogaard, L., et al. 2020, , 902, 110
2020
-
[43]
1980, ApJ, 236, 351
Dressler, A. 1980, ApJ, 236, 351
1980
-
[44]
e , U., Smail , I., Swinbank , A
Dudzevi c i \= u t \. e , U., Smail , I., Swinbank , A. M., et al. 2020, MNRAS, 494, 3828
2020
-
[45]
A., & Macci \`o , A
Dutton, A. A., & Macci \`o , A. V. 2014, MNRAS, 441, 3359
2014
-
[46]
Emonts , B. H. C., Lehnert , M. D., Yoon , I., et al. 2023, Science, 379, 1323, 10.1126/science.abh2150
2023 doi
-
[47]
K., Bogosavljevi \'c , M., & Steidel , C
Erb , D. K., Bogosavljevi \'c , M., & Steidel , C. C. 2011, , 740, L31, 10.1088/2041-8205/740/1/L31
2011 doi
-
[48]
K., et al
Fossati, M., Fumagalli, M., Lofthouse, E. K., et al. 2021, MNRAS, 503, 3044
2021
-
[49]
2024, , 684, A63, 10.1051/0004-6361/202347982
Gal \'a rraga-Espinosa , D., Cadiou , C., Gouin , C., et al. 2024, , 684, A63, 10.1051/0004-6361/202347982
2024 doi
-
[50]
2024, A&A, 684, 17
Galárraga-Espinosa, D., Cadiou, C., Gouin, C., et al. 2024, A&A, 684, 17
2024
-
[51]
2024, ApJ, 971, 117
Gao, Z.-K., Lim, C.-F., Wang, W.-H., et al. 2024, ApJ, 971, 117
2024
-
[52]
2022, , 927, 65
Garcia-Vergara, C., Rybak, M., Hodge, J., et al. 2022, , 927, 65
2022
-
[53]
E., Dunlop, J
Geach, J. E., Dunlop, J. S., Halpern, M., et al. 2017, MNRAS, 465, 1789
2017
-
[54]
E., Romero-Cañizales, C., et al
Gonzalez-Lopez, J., Bauer, F. E., Romero-Cañizales, C., et al. 2017, A&A, 597, 41
2017
-
[55]
2019, ApJ, 882, 139
Gonzalez-Lopez, J., Decarli, R., Pavesi, R., et al. 2019, ApJ, 882, 139
2019
-
[57]
I., Baker, A
Harris, A. I., Baker, A. J., Frayer, D. T., et al. 2012, ApJ, 752, 152
2012
-
[58]
2018, ApJ, 856, 13
Hayashi, M., Tadaki, K.-i., Kodama, T., et al. 2018, ApJ, 856, 13
2018
-
[59]
F., Prochaska , J
Hennawi , J. F., Prochaska , J. X., Cantalupo , S., & Arrigoni-Battaia , F. 2015, Science, 348, 779, 10.1126/science.aaa5397
2015 doi
-
[60]
2024, , 691, A210, 10.1051/0004-6361/202450959
Herwig , E., Arrigoni Battaia , F., Gonz \'a lez Lobos , J., et al. 2024, , 691, A210, 10.1051/0004-6361/202450959
2024 doi
-
[61]
C., Wardlow , J
Hickox , R. C., Wardlow , J. L., Smail , I., et al. 2012, , 421, 284, 10.1111/j.1365-2966.2011.20303.x
2012
-
[62]
2022, , 263, 27, 10.3847/1538-4365/ac982d
Horowitz , B., Lee , K.-G., Ata , M., et al. 2022, , 263, 27, 10.3847/1538-4365/ac982d
2022 doi
-
[63]
C., et al
Hughes , C., Hill , R., Chapman , S. C., et al. 2025, , 983, L11, 10.3847/2041-8213/adc1c9
2025 doi
-
[64]
M., Chiang, Y.-K., et al
Hung, C.-L., Casey, C. M., Chiang, Y.-K., et al. 2016, , 826, 130
2016
-
[65]
2018, ApJ, 864, 56
Jin, S., Daddi, E., Liu, D., et al. 2018, ApJ, 864, 56
2018
-
[66]
2021, A&A, 652, 11
Jin, S., Dannerbauer, H., Emonts, B., et al. 2021, A&A, 652, 11
2021
-
[67]
D., Schaye , J., Walth , G
Johnson , S. D., Schaye , J., Walth , G. L., et al. 2022, , 940, L40, 10.3847/2041-8213/aca28e
2022 doi
-
[68]
2016, MNRAS, 460, 3861
Kato, Y., Matsuda, Y., Smail, I., et al. 2016, MNRAS, 460, 3861
2016
-
[69]
1998, ARA&A, 36, 189
Kennicutt, Robert C., J. 1998, ARA&A, 36, 189
1998
-
[70]
C., & Evans , N
Kennicutt , R. C., & Evans , N. J. 2012, ARAA, 50, 531
2012
-
[71]
F., Stark , C., et al
Lee , K.-G., Hennawi , J. F., Stark , C., et al. 2014, , 795, L12, 10.1088/2041-8205/795/1/L12
2014 doi
-
[72]
M., Tanaka, I., Kawabe, R., et al
Lee, M. M., Tanaka, I., Kawabe, R., et al. 2017, ApJ, 842, 23
2017
-
[73]
Li, J., Emonts, B. H. C., Cai, Z., et al. 2023, , 950, 180
2023
-
[74]
2019, MNRAS, 490, 1425
Li, Q., Narayanan, D., & Dave, R. 2019, MNRAS, 490, 1425
2019
-
[75]
2024, ApJ, 494, 25
Liao, C.-L., Chen, C.-C., Wang, W.-H., et al. 2024, ApJ, 494, 25
2024
-
[76]
2021, , 501, 1803, 10.1093/mnras/staa3693
Lim , S., Scott , D., Babul , A., et al. 2021, , 501, 1803, 10.1093/mnras/staa3693
2021 doi
- [77]
-
[78]
2014, ARAA, 52, 415
Madau, P., & Dickinson, M. 2014, ARAA, 52, 415
2014
-
[79]
B., Chapman, S
Miller, T. B., Chapman, S. C., Aravena, M., et al. 2018, Nature, 556, 469
2018
-
[80]
F., Frenk, C
Navarro, J. F., Frenk, C. S., & White, S. D. M. 1996, , 462, 563
1996
-
[81]
B., Rudie , G
Newman , A. B., Rudie , G. C., Blanc , G. A., et al. 2020, , 891, 147, 10.3847/1538-4357/ab75ee
2020 doi
-
[82]
P., Walter, F., et al
Novak, M., Venemans, B. P., Walter, F., et al. 2020, ApJ, 904, 131
2020
-
[83]
A., et al
Nowotka , M., Chen , C.-C., Battaia , F. A., et al. 2022, , 658, A77, 10.1051/0004-6361/202040133
2022 doi
-
[84]
J., Dunne, L., et al
Oteo, I., Ivison, R. J., Dunne, L., et al. 2018, , 856, 720
2018
-
[85]
Overzier , R. A. 2016, , 24, 14, 10.1007/s00159-016-0100-3
2016 doi
-
[86]
J., Kovac, K., et al
Peng, Y.-j., Lilly, S. J., Kovac, K., et al. 2010, ApJ, 721, 193
2010
-
[87]
2024, A&A, 684, 119
Pensabene, A., Cantalupo, S., Cicone, C., et al. 2024, A&A, 684, 119
2024
-
[88]
Planck\;Collaboration, Ade, P. A. R., Aghanim, N., et al. 2014, A&A, 571, 66
2014
-
[89]
2022, ApJ, 950, 17
Remus, R.-S., Dolag, K., & Dannerbauer, H. 2022, ApJ, 950, 17
2022
-
[90]
2023, , 950, 191, 10.3847/1538-4357/accb91
Remus , R.-S., Dolag , K., & Dannerbauer , H. 2023, , 950, 191, 10.3847/1538-4357/accb91
2023 doi
-
[91]
2023, , 679, A129, 10.1051/0004-6361/202346444
Rizzo , F., Roman-Oliveira , F., Fraternali , F., et al. 2023, , 679, A129, 10.1051/0004-6361/202346444
2023 doi
-
[92]
A., Comparat, J., Prada, F., et al
Rodríguez-Torres, S. A., Comparat, J., Prada, F., et al. 2017, MNRAS, 468, 728
2017
-
[93]
M., Swinbank , A
Simpson , J. M., Swinbank , A. M., Smail , I., et al. 2014, , 788, 125, 10.1088/0004-637X/788/2/125
2014 doi
-
[94]
M., & Vanden Bout , P
Solomon , P. M., & Vanden Bout , P. A. 2005, , 43, 677, 10.1146/annurev.astro.43.051804.102221
2005 arXiv
-
[95]
M., Smail, I., Amvrosiadis, A., et al
Stach, S. M., Smail, I., Amvrosiadis, A., et al. 2021, MNRAS, 504, 172
2021
-
[96]
M., Egami , E., et al
Sun , F., Helton , J. M., Egami , E., et al. 2024, , 961, 69, 10.3847/1538-4357/ad07e3
2024 doi
-
[97]
J., Genzel, R., & Sternberg, A
Tacconi, L. J., Genzel, R., & Sternberg, A. 2020, A&A, 58, 157
2020
-
[98]
2019, , 71, 40, 10.1093/pasj/psz005
Tadaki , K.-i., Kodama , T., Hayashi , M., et al. 2019, , 71, 40, 10.1093/pasj/psz005
2019 doi
- [99]
-
[100]
2019, Science, 366, 97, 10.1126/science.aaw5949
Umehata , H., Fumagalli , M., Smail , I., et al. 2019, Science, 366, 97, 10.1126/science.aaw5949
2019 doi
-
[101]
Wang, G. C. P., Chapman, S. C., Sulzenauer, N., et al. 2024, arVix, 240616637W
2024
-
[102]
A., Eales , S
Ward , B. A., Eales , S. A., Ivison , R. J., & Arumugam , V. 2024, , 530, 4887, 10.1093/mnras/stae405
2024 doi
-
[103]
L., Simpson, J
Wardlow, J. L., Simpson, J. M., Smail, I., et al. 2018, MNRAS, 51, 105
2018
-
[104]
2017, , 464, 1380, 10.1093/mnras/stw2405
Wilkinson , A., Almaini , O., Chen , C.-C., et al. 2017, , 464, 1380, 10.1093/mnras/stw2405
2017 doi
-
[105]
2022, MNRAS, 509, 4037
Yajima, H., Abe, M., Khochfar, S., et al. 2022, MNRAS, 509, 4037
2022
Reviewed August 15, 2026 · model on record in the stance chip above.
Discussion (0). Continue with ORCID to comment.