Fault volume digital twin to reproduce the full slip spectrum, scaling and statistical laws
Pith reviewed 2026-05-18 19:07 UTC · model grok-4.3
The pith
A main fault surrounded by power-law distributed off-fault fractures reproduces the full range of slip speeds and seismic laws with uniform friction.
A machine-rendered reading of the paper's core claim, the machinery that carries it, and where it could break.
Core claim
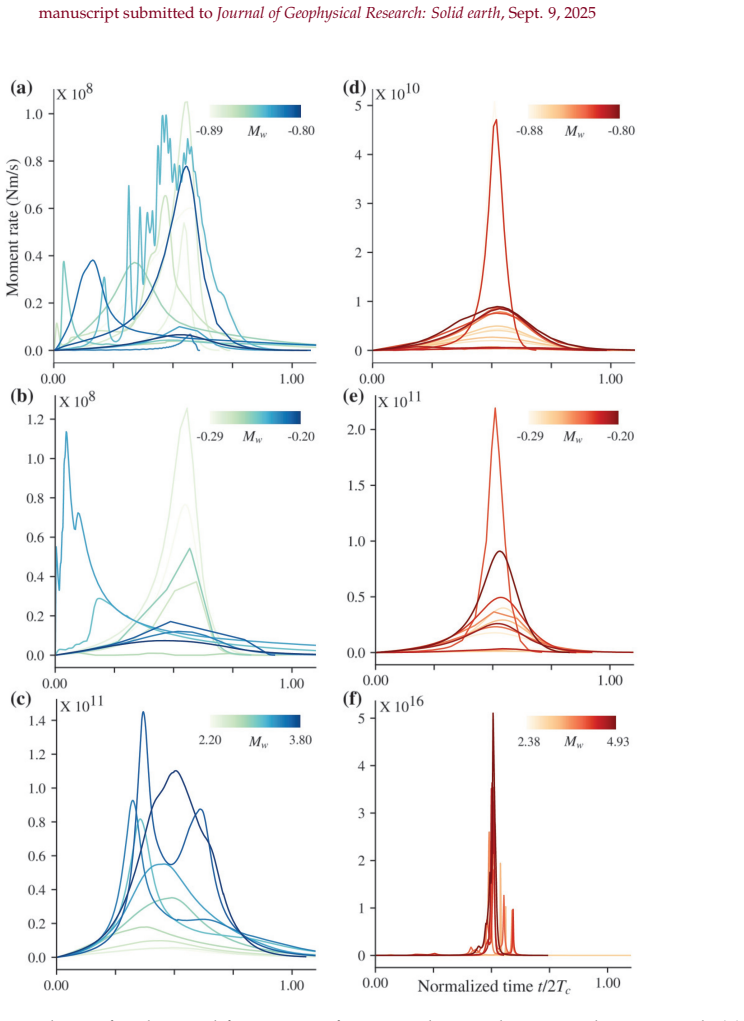
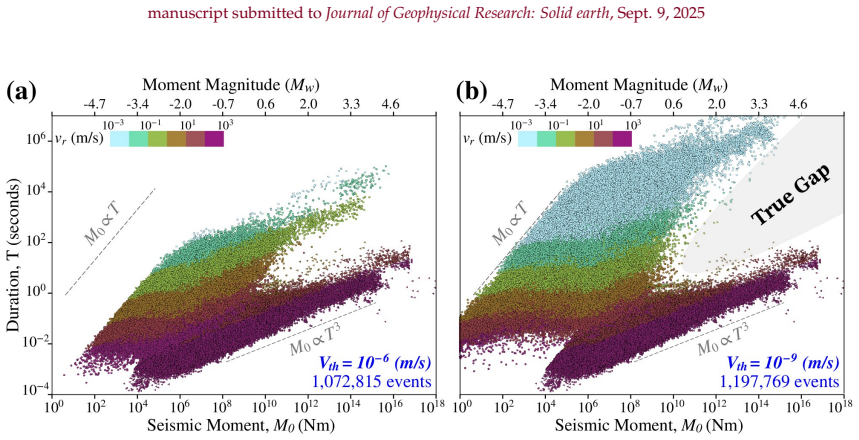
Incorporating an off-fault damage zone characterized by distributed fractures surrounding a main fault can reproduce many key features observed in seismic and geodetic data, including a natural continuum from slow to fast ruptures, Omori law, inverse Omori law, Gutenberg-Richter scaling, and moment-duration scaling, without introducing spatial heterogeneities in frictional properties. All fractures follow rate-and-state friction with parameters enabling slip instabilities, and quasi-dynamic boundary integral simulations show tremors, very low frequency earthquakes, low frequency earthquakes, slow slip events, and earthquakes emerging naturally within this framework.
What carries the argument
off-fault damage zone modeled as power-law distributed fractures surrounding the main fault, all obeying uniform rate-and-state friction
If this is right
- A natural continuum from slow to fast ruptures emerges despite spatially uniform frictional properties.
- Omori law, inverse Omori law, Gutenberg-Richter scaling, and moment-duration scaling are all reproduced by the same setup.
- Seismicity localizes toward the main fault before nucleation of main-fault events.
- During slow slip events, off-fault seismicity migrates in patterns resembling fluid diffusion fronts without any fluids present.
- Tremors, very low frequency earthquakes, low frequency earthquakes, slow slip events, and regular earthquakes all arise within the single fault-volume model.
Where Pith is reading between the lines
- The framework could serve as a controlled testbed for inverting mechanical properties that are hard to measure directly in the field.
- Similar damage-zone effects might unify slow and fast slip behaviors in other tectonic settings beyond the 2D shear fault examined here.
- Extending the model to three dimensions could reveal whether the same statistical laws persist when fracture orientations and interactions become more complex.
Load-bearing premise
Off-fault cracks must follow power-law size and density distributions, be oriented optimally or parallel to the main fault, and obey rate-and-state friction parameters that enable slip instabilities.
What would settle it
A quasi-dynamic simulation of an isolated main fault with the same uniform friction but no surrounding power-law damage zone would fail to produce the continuum of slip rates or the full set of statistical laws.
Figures


read the original abstract
Seismological and geodetic observations of fault zones reveal diverse slip dynamics, scaling, and statistical laws. Existing mechanisms explain some but not all of these behaviors. We show that incorporating an off-fault damage zone-characterized by distributed fractures surrounding a main fault-can reproduce many key features observed in seismic and geodetic data. We model a 2D shear fault zone in which off-fault cracks follow power-law size and density distributions, and are oriented either optimally or parallel to the main fault. All fractures follow rate-and-state friction with parameters enabling slip instabilities. We do not introduce spatial heterogeneities in frictional properties. Using quasi-dynamic boundary integral simulations accelerated by hierarchical matrices, we simulate slip dynamics and analyze events produced both on and off the main fault. Despite spatially uniform frictional properties, we observe a natural continuum from slow to fast ruptures, as seen in nature. Our simulations reproduce the Omori law, inverse Omori law, Gutenberg-Richter scaling, and moment-duration scaling. We observe seismicity localizing toward the main fault before nucleation of main-fault events. During slow slip events, off-fault seismicity migrates in patterns resembling fluid diffusion fronts, despite the absence of fluids. We show that tremors, Very Low Frequency Earthquakes, Low Frequency Earthquakes, Slow Slip Events, and earthquakes can all emerge naturally within this fault volume framework, making it an ideal digital twin for testing hypotheses, performing ground-truth inversions, and probing mechanical properties inaccessible with natural observations.
Editorial analysis
A structured set of objections, weighed in public.
Referee Report
Summary. The manuscript proposes a 2D fault-zone model in which a main fault is embedded in an off-fault damage zone populated by distributed fractures obeying power-law size and density distributions. Fractures are restricted to optimal or main-fault-parallel orientations and all surfaces (main fault and off-fault cracks) obey rate-and-state friction with spatially uniform parameters chosen to permit slip instabilities. Quasi-dynamic boundary-integral simulations accelerated by hierarchical matrices are used to generate slip events both on and off the main fault. The central claim is that this geometry alone, without frictional heterogeneity, produces a natural continuum from slow to fast ruptures together with Omori and inverse-Omori laws, Gutenberg-Richter scaling, moment-duration scaling, pre-nucleation seismicity localization, and fluid-like migration patterns.
Significance. If the quantitative matches and robustness claims are substantiated, the work would provide a unified mechanical explanation for the full slip spectrum and associated statistical laws emerging from off-fault damage rather than from frictional heterogeneity. The framework could serve as a useful digital twin for hypothesis testing and ground-truth inversions. The technical implementation (hierarchical-matrix acceleration of boundary-integral methods) is a positive methodological contribution.
major comments (3)
- [Results] Results section (and associated figures): the manuscript asserts reproduction of the Omori law, inverse Omori law, Gutenberg-Richter scaling, and moment-duration scaling, yet supplies no quantitative goodness-of-fit metrics, fitted exponents with uncertainties, or direct comparison statistics between simulated and target distributions. Without these measures it is impossible to judge how well the simulated catalogs actually match the claimed laws.
- [Methods, Results] Methods and Results sections: the central claim that the observed behaviors emerge generically from any off-fault damage zone depends on the specific power-law exponents for crack size and density, the restriction to optimal or parallel orientations, and the particular rate-and-state parameters. No sensitivity tests varying these exponents, densities, or randomizing orientations are reported, leaving open the possibility that the statistical laws are tied to these geometric and parametric choices rather than arising generically.
- [§3] §3 (numerical method): while hierarchical-matrix acceleration is used to handle the large number of off-fault cracks, the manuscript does not quantify the approximation error introduced by the hierarchical compression for the quasi-dynamic evolution or demonstrate convergence with respect to the number of cracks. This is load-bearing for the reliability of the reported slow-to-fast continuum and migration patterns.
minor comments (2)
- [Figures] Figure captions and text: several panels show event catalogs or migration patterns; the distinction between main-fault and off-fault events should be made visually clearer (e.g., by symbol or color) and the time windows used for each panel should be stated explicitly.
- [Methods] Notation: the symbols used for crack density, size-distribution exponent, and the rate-and-state parameters (a, b, Dc) are introduced without a consolidated table; a single parameter table would improve readability.
Simulated Author's Rebuttal
We thank the referee for the constructive and detailed review. The comments identify key areas where additional quantification and robustness checks will strengthen the manuscript. We respond to each major comment below and commit to revisions that address the concerns without altering the core claims.
read point-by-point responses
-
Referee: [Results] Results section (and associated figures): the manuscript asserts reproduction of the Omori law, inverse Omori law, Gutenberg-Richter scaling, and moment-duration scaling, yet supplies no quantitative goodness-of-fit metrics, fitted exponents with uncertainties, or direct comparison statistics between simulated and target distributions. Without these measures it is impossible to judge how well the simulated catalogs actually match the claimed laws.
Authors: We agree that quantitative metrics are necessary for rigorous evaluation. In the revised manuscript we will add fitted exponents with uncertainties (e.g., b-value for Gutenberg-Richter and p-value for Omori’s law) together with goodness-of-fit statistics such as R² for log-log regressions and Kolmogorov-Smirnov p-values comparing simulated versus theoretical distributions. These will appear in the Results section, in new table entries, and in updated figure captions. revision: yes
-
Referee: [Methods, Results] Methods and Results sections: the central claim that the observed behaviors emerge generically from any off-fault damage zone depends on the specific power-law exponents for crack size and density, the restriction to optimal or parallel orientations, and the particular rate-and-state parameters. No sensitivity tests varying these exponents, densities, or randomizing orientations are reported, leaving open the possibility that the statistical laws are tied to these geometric and parametric choices rather than arising generically.
Authors: The chosen power-law exponents and orientations are directly motivated by field observations of damage zones; the rate-and-state parameters are uniform and lie within the unstable regime. Nevertheless, we recognize the value of explicit sensitivity checks. We will add a dedicated subsection (or appendix) presenting results for modest variations in the size and density exponents (±0.2) and will explicitly discuss the physical rationale for restricting orientations to optimal and main-fault-parallel directions. Full randomization of all orientations remains computationally prohibitive for the largest catalogs but will be addressed qualitatively. revision: partial
-
Referee: [§3] §3 (numerical method): while hierarchical-matrix acceleration is used to handle the large number of off-fault cracks, the manuscript does not quantify the approximation error introduced by the hierarchical compression for the quasi-dynamic evolution or demonstrate convergence with respect to the number of cracks. This is load-bearing for the reliability of the reported slow-to-fast continuum and migration patterns.
Authors: We performed internal convergence and error analyses during code development but omitted the quantitative details for brevity. In the revision we will expand §3 with explicit error metrics (relative L2-norm differences versus direct summation on benchmark problems) and will demonstrate convergence of key observables (event rates, migration speeds, slip-rate spectra) with increasing crack number and hierarchical rank. These additions will directly support the reliability of the slow-to-fast continuum and fluid-like migration patterns. revision: yes
Circularity Check
No significant circularity; forward simulation with independent inputs
full rationale
The paper describes a forward-modeling study: off-fault cracks are assigned explicit power-law size/density distributions and fixed orientations (optimal or parallel), all fractures receive uniform rate-and-state parameters chosen to allow instabilities, and quasi-dynamic boundary-integral simulations are run. The observed continuum of slip speeds, Omori laws, GR scaling, and moment-duration scaling are reported as emergent outputs of these simulations. No parameter is fitted to the target statistics and then relabeled as a prediction; no self-citation supplies a load-bearing uniqueness theorem; no ansatz is smuggled in; and the central claim does not reduce by construction to its own inputs. The derivation chain is therefore self-contained against external benchmarks.
Axiom & Free-Parameter Ledger
free parameters (2)
- power-law exponents for crack size and density
- rate-and-state friction parameters enabling slip instabilities
axioms (2)
- domain assumption Rate-and-state friction governs slip on all fractures
- domain assumption Quasi-dynamic approximation is sufficient for the slip dynamics
invented entities (1)
-
off-fault damage zone as digital twin
no independent evidence
Lean theorems connected to this paper
-
IndisputableMonolith/Cost/FunctionalEquation.leanwashburn_uniqueness_aczel unclear?
unclearRelation between the paper passage and the cited Recognition theorem.
off-fault cracks follow power-law size and density distributions... All fractures follow rate-and-state friction with parameters enabling slip instabilities. We do not introduce spatial heterogeneities in frictional properties.
-
IndisputableMonolith/Foundation/AlexanderDuality.leanalexander_duality_circle_linking unclear?
unclearRelation between the paper passage and the cited Recognition theorem.
power-law decay of fracture density with distance... exponent of 1
What do these tags mean?
- matches
- The paper's claim is directly supported by a theorem in the formal canon.
- supports
- The theorem supports part of the paper's argument, but the paper may add assumptions or extra steps.
- extends
- The paper goes beyond the formal theorem; the theorem is a base layer rather than the whole result.
- uses
- The paper appears to rely on the theorem as machinery.
- contradicts
- The paper's claim conflicts with a theorem or certificate in the canon.
- unclear
- Pith found a possible connection, but the passage is too broad, indirect, or ambiguous to say the theorem truly supports the claim.
Reference graph
Works this paper leans on
-
[1]
Abdelmeguid, M. & A. Elbanna (2022). “Sequences of seismic and aseismic slip on bimaterial faults show dominant rupture asymmetry and potential for elevated seismic hazard”.Earth and Planetary Science Letters593, p. 117648.DOI: 10.1016/j.epsl.2022.117648. Abercrombie, R. E. & J. R. Rice (2005). “Can observations of earthquake scaling constrain slip weaken...
-
[2]
Characterization of barriers on an earthquake fault
AGU.DOI:10.1029/ME004p0566. Aki, K. (1979). “Characterization of barriers on an earthquake fault”.J. Geophys. Res.84.B11, pp. 6140–6148.DOI:10.1029 /JB084iB11p06140. Amezawa, Y., T. Maeda & M. Kosuga (2021). “Migration diffusivity as a controlling factor in the duration of earthquake swarms”.Earth, Planets and Space73.1.DOI:10.1186/s40623-021-01480-7. Amp...
-
[3]
Time-dependent case”.J. Geophys. Res.86.B11, pp. 10821–10834.DOI: 10.1029/JB086iB11p10821. Andrews, D. J. (1985). “Dynamic plane-strain shear rupture with a slip-weakening friction law calculated by a boundary integral method”.Bulletin of the Seismological Society of America75.1, pp. 1–21.DOI:10.1785/bssa0750010001. Andrews, D. J. (2005). “Rupture dynamic...
-
[4]
Earthquake nucleation on faults with rate-and state-dependent strength
Experimental results and constitutive equations”.Journal of Geophysical Research: Solid Earth84.B5, pp. 2161–2168.DOI:10.1029/jb084ib05p02161. Dieterich, J. H. (1992). “Earthquake nucleation on faults with rate-and state-dependent strength”.Tectonophysics211.1-4, pp. 115–134.DOI:10.1016/0040-1951(92)90055-b. Dor, O., Y. Ben-Zion, T. K. Rockwell & J. N. Br...
-
[5]
Slow earthquake scaling reconsidered as a boundary between distinct modes of rupture propagation
Ide, S. & G. C. Beroza (2023). “Slow earthquake scaling reconsidered as a boundary between distinct modes of rupture propagation”.Proceedings of the National Academy of Sciences120.32.DOI:10.1073/pnas.2222102120. Ide, S., G. C. Beroza, D. R. Shelly & T. Uchide (2007). “A scaling law for slow earthquakes”.Nature447.7140, pp. 76–79. DOI:10.1038/nature05780....
-
[6]
Jiang, J., B. A. Erickson, V . R. Lambert, J. Ampuero, R. Ando, S. D. Barbot, C. Cattania, L. D. Zilio, B. Duan, E. M. Dunham, A. Gabriel, N. Lapusta, D. Li, M. Li, D. Liu, Y. Liu, S. Ozawa, C. Pranger & Y. van Dinther (2022). “Community-Driven Code Comparisons for Three-Dimensional Dynamic Modeling of Sequences of Earthquakes and Aseismic Slip”.Journal o...
-
[7]
Kanamori, H. & E. E. Brodsky (2004). “The physics of earthquakes”.Reports on Progress in Physics67.8, pp. 1429–1496.DOI: 10.1088/0034-4885/67/8/r03. Kato, A. & Y. Ben-Zion (2020). “The generation of large earthquakes”.Nature Reviews Earth & Environment2.1, pp. 26–39. DOI:10.1038/s43017-020-00108-w. Kato, N., M. Ohtake & T. Hirasawa (1997). “Possible Mecha...
-
[8]
Dynamics, Radiation, and Overall Energy Budget of Earthquake Rupture With Coseismic Off-Fault Damage
Okubo, K., H. S. Bhat, E. Rougier, S. Marty, A. Schubnel, Z. Lei, E. E. Knight & Y. Klinger (2019). “Dynamics, Radiation, and Overall Energy Budget of Earthquake Rupture With Coseismic Off-Fault Damage”.Journal of Geophysical Research: Solid Earth124.11, pp. 11771–11801.DOI:10.1029/2019jb017304. Okubo, K., E. Rougier, Z. Lei & H. S. Bhat (2020). “Modeling...
-
[9]
Perez-Silva, A., Y. Kaneko, M. Savage, L. Wallace & E. Warren-Smith (2023). “Characteristics of Slow Slip Events Explained by Rate-Strengthening Faults Subject to Periodic Pore Fluid Pressure Changes”.Journal of Geophysical Research: Solid Earth128.6.DOI:10.22541/essoar.167327976.60438163/v1. Perfettini, H., J. Schmittbuhl, J. R. Rice & M. Cocco (2001). “...
-
[10]
Fault rocks and fault mechanisms
Sibson, R. H. (1977). “Fault rocks and fault mechanisms”.Journal of the Geological Society (London, United Kingdom)133.3, pp. 191–213.DOI:10.1144/gsjgs.133.3.0191. Sibson, R. H. (1986). “Rupture interaction with fault jogs”.Earthquake Source Mechanics. Ed. by S. Das, J. Boatwright & C. H. Scholz. AGU Geophys. Monogr., pp. 157–167.DOI:10.1029/gm037p0157. S...
discussion (0)
Sign in with ORCID, Apple, or X to comment. Anyone can read and Pith papers without signing in.