REVIEW 3 major objections 6 minor 44 references
Dynamics of Liquidity Surfaces in Uniswap v3
T0 review · 3 major / 6 minor · reviewed 2026-08-05 · deepseek-v4-flash
Pith's one-line read This paper claims that liquidity surfaces in 5 bps Uniswap v3 pools reduce to five fixed Legendre factors with AR(1)-GARCH scores, a Nelson-Siegel-like representation, and that the 30 bps pool lacks this stable basis.
desk verdict A careful first mapping of Uniswap v3 liquidity surfaces via FPCA, worth refereeing, but the rank-standardized tick grid is a load-bearing choice the paper never validates. read the letter →
The pith
A machine-rendered reading of the paper's core claim, the machinery that carries it, and where it could break.
The reading
What carries the argument
The rank-standardized log-liquidity surface y_t(x) on x∈[−1,1], where x is a relabeled tick distance from the current price and M=201 equally spaced grid points cover 100 jump ticks on each side. The decomposition y_t(x)=m(x)+Σ_{k=1}^K β_{t,k}u_k(x)+r_t(x) separates static shape from temporal dynamics. Subspace projection distance d(U1,U2)=½‖P1−P2‖²_F compares empirical PCA bases to each other and to a fixed Legendre basis, with the random-subspace distance K(1−K/M) serving as the no-alignment benchmark. Legendre polynomials P_0 through P_4 supply the fixed interpretable basis; AR(1)-GARCH models with heavy-tailed innovations describe the score dynamics.
What would settle it
Count the timestamps in the 5 bps pools where either side of the current tick has fewer than 100 jump ticks; if these are common, the grid assumption fails. More directly, rerun the rolling-window PCA on a high-volume 5 bps pool not studied here: if the subspace distance d(U_t, U_L) stays near the random-subspace benchmark K(1−K/M) or the squared score residuals show no GARCH autocorrelation, the paper's central claim of stable Legendre-aligned factors would be contradicted.
Extended reading notes
Core claim
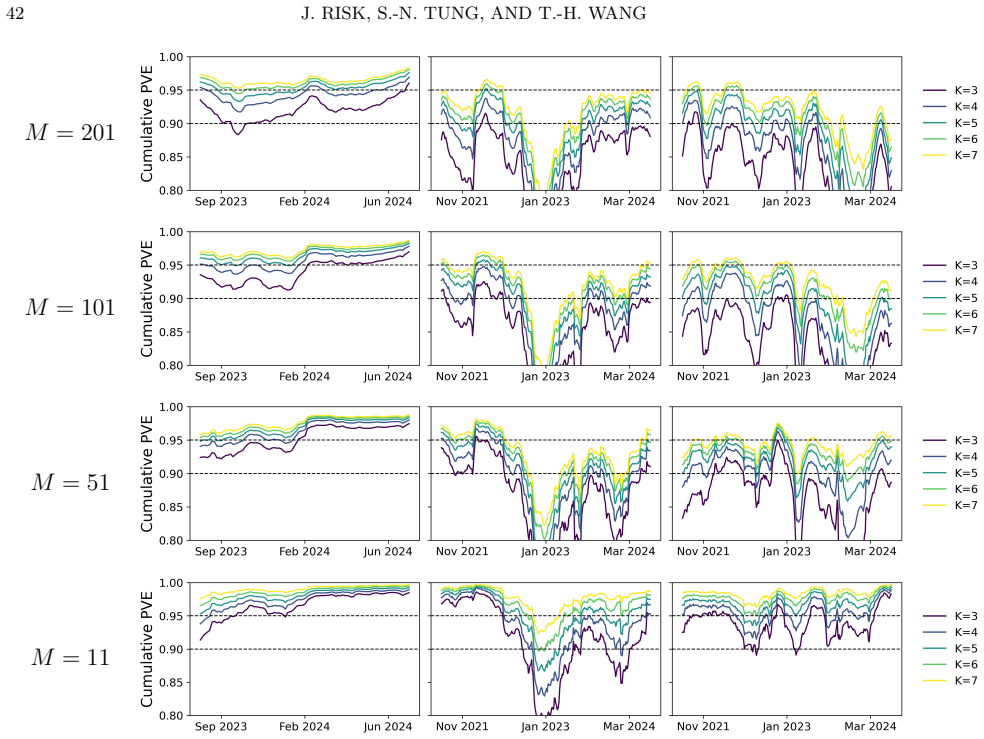
For the 5 bps (0.05% fee) pools, ETH-USDC on Ethereum and ARB-USDC on Arbitrum, the log-liquidity surface y_t(x) admits a stable, low-dimensional factor structure: rolling-window PCA eigenmodes span nearly the same subspace as the first few Legendre polynomials, as measured by projection distances, and five factors capture 90–95% of cross-tick variance. The factor scores follow AR(1) dynamics with conditional heteroskedasticity and Student-t innovations, so the surface has a dynamic Nelson-Siegel form: a fixed, interpretable basis (level, slope, curvature, and two higher-order shape terms) whose loadings are simple time series. The 30 bps ETH-USDC pool, in contrast, shows a drifting basis an
Load-bearing premise
At every sampled time, the pool must have at least 100 distinct liquidity-range boundaries on each side of the current price tick; if any window lacks enough jumps, the equally spaced grid on which the entire surface analysis runs is undefined, and the PCA results could be an artifact of the coordinate construction.
Editorial extensions
If this is right
- Five Legendre factor scores per timestamp compress the full 201-tick liquidity profile, making surface forecasting a matter of forecasting five univariate time series.
- The fixed basis allows meaningful cross-pool and cross-period comparisons of level, slope, and curvature without re-estimating the factor basis each window.
- GARCH structure on the scores yields time-varying uncertainty bands for the liquidity surface, useful for quantile risk assessment and LP capital planning.
- The 30 bps pool's nonstationary basis indicates that fee tier shapes liquidity dynamics, so factor models valid for 5 bps pools will not transfer blindly.
- The decomposition gives a direct language for stylized facts, such as the central concentration of liquidity (negative average curvature coefficient) and the flattening response to volatility shocks.
Reading between the lines
- If the Legendre alignment generalizes to other dominant 5 bps pools, the equilibrium cross-sectional liquidity shape may be effectively a smoothed bell curve: the sign pattern of average Legendre coefficients is what a concentrated unimodal profile implies, a check that does not require PCA.
- The AR(1)-GARCH score dynamics give a complete one-step predictive distribution for the surface; a direct out-of-sample test would compare quantile forecasts built from the first window's score model against empirical coverages in later windows.
- The stability contrast between 5 bps and 30 bps pools suggests a behavioral hypothesis the paper does not pursue: active, fee-sensitive LPs keep dominant pools' liquidity concentrated and stable, while passive LPs create the drifting basis; on-chain position data could test whether LP turnover explains basis drift.
- The paper's proposed SPDE with the Jacobi operator has Jacobi polynomials as eigenfunctions, and the Legendre basis is the α=β=0 special case, so calibrating the first few eigenmodes to the estimated factor scores would produce a continuous-time model that inherits the empirical basis.
Editorial analysis
A structured set of objections, weighed in public.
Referee Report
Summary. The paper studies the empirical dynamics of the Uniswap v3 liquidity surface L_t(x), where x is a relative tick distance scaled to [-1,1]. Using functional PCA / dynamic factor methods on three pools (ETH-USDC 5bps on Ethereum, ETH-USDC 30bps on Ethereum, ARB-USDC 5bps on Arbitrum) over multiple windows, it reports three main findings: (1) a low-rank structure with roughly 5 principal components explaining 90–95% of the variation in the 5bps pools; (2) stability of the empirical eigenfunctions over rolling windows and close alignment with the first five Legendre polynomials, leading to a Nelson–Siegel-like fixed-basis representation; (3) temporal factor scores that are well described by AR(1) models with GARCH-type volatility and heavy-tailed (Student-t) innovations. The ETH30 pool is shown to be much less stable and not well described by this structure. Robustness checks vary the number of ticks M, window length T, and sampling frequency. The paper is explicitly descriptive rather than formal-inferential.
Significance. If correct, the paper provides the first systematic functional-data description of Uniswap v3 concentrated liquidity and a concrete, portable basis (Legendre polynomials) for dimension reduction, analogous to the Nelson–Siegel model for yield curves. The analysis is extensive and transparent: it studies multiple pools and periods, reports rolling-window behavior, compares against a random-subspace benchmark, and includes substantial robustness checks. The main empirical claims are falsifiable and quantitatively specific (e.g., rank 5 for 90–95% variance, subspace distances below random baseline). The paper also clearly separates facts found for 5bps pools from the contrasting 30bps pool. However, the central claims rest on a particular coordinate construction (jump-rank standardization, Appendix B) and on descriptive summaries without formal uncertainty quantification, so the significance is conditional on those choices being legitimate and representative.
major comments (3)
- [Sections 4.2 and 4.5, Eq. (16)] The rank-standardized coordinate system is load-bearing for all three headline contributions. The x_j grid is equally spaced in the rank order of jump ticks, not in log price; it equals an affine transform of raw tick only when jump density is perfectly uniform. Uniswap v3 liquidity is a step function whose jump locations may cluster near the current price; if density varies with price or over time, the PCA eigenfunctions, their stability, and the Legendre subspace distance d(U_t,U_L) are properties of the jump-rank grid, not of the liquidity surface as a function of price. The paper explicitly notes this caveat in Appendix B ('jumps typically occur at each step near the current price') but provides no evidence that this holds for the datasets and windows used, and Appendix F varies M, T, and sampling frequency without testing the coordinate construction itself. The manuscript should (a)
- [Section 4.4] The central quantitative claims (e.g., 'rank-5 structure appears adequate', 'bases are highly stable and comfortably align with the Legendre basis') are presented without any uncertainty quantification. The CPVE curves in Figure 4 are point estimates with no confidence bands, despite being computed over thousands of heavily overlapping rolling windows. Likewise, the subspace distances d(U_t,U_0) and d(U_t,U_L) in Figure 8 have no standard errors or bootstrap intervals; the comparison to a random-subspace expectation is a useful benchmark but is not a statistical test. Since the paper's central claim is precisely that the empirical eigenfunctions are close to Legendre in a stable way, the absence of error bars on these distances makes it impossible to assess whether the observed alignment is within sampling variation. The authors should provide bootstrap or analytical confidence intervals
- [Section 2.2.1 and Section 4.4] The ADF tests are used informally across many factor series and windows (Tables 3, 6, 7) with a fixed p>0.1 cutoff, without multiple-comparison correction. Similarly, the BIC model-selection sweep over 45 series and 24 models yields statements like '100% preferred GARCH' and 'always preferred t/skew-t'; these are descriptive summaries but the manuscript should acknowledge the selection multiplicity and the fact that BIC differences are reported without any measure of uncertainty. This affects the stylized fact 'approximately one unit root' and the 'overwhelming' GARCH/tail claims. I do not interpret these as fatal, but they should be softened or supported by a sensitivity analysis.
minor comments (6)
- [Abstract and Section 5] The text says 'We assume the x_m are equally spaced' without mentioning the rank-standardized construction; the connection to Appendix B should be made explicit at the first introduction of the grid, since the equally spaced assumption in x is not the same as equally spaced in raw ticks.
- [Appendix F] The abstract claims 'the leading empirical eigenfunctions explain the majority of cross-tick variation and remain stable, aligning closely with a low-order Legendre polynomial basis.' This is a strong claim; I suggest adding 'for the 5 bps pools considered' explicitly in the abstract, and in the introduction the paper should not overstate the Nelson–Siegel analogy beyond what the evidence supports, given the caveats above.
- [Appendix A] The robustness checks vary M, T, and sampling frequency, but not the rank-standardized coordinate construction. Please add a sentence explaining why the coordinate system itself is not varied, or include a robustness check with actual tick spacing.
- [Throughout] The formula for the expected squared projection distance 'K(1 - K/M)' appears to be correct for the Grassmannian distance defined in Eq. (16), but the notation 'E[d_S(U_j,U)]' is ambiguous; please specify the distribution of U explicitly and cite the precise result in Meckes (2019).
- [Table 3] There are several typos and duplicated words, e.g., 'where where' in Section 1, 'the the' in Section 4.4.3, and inconsistent hyphenation of 'rank-standardized' vs 'rank standardized'. A careful proofread would improve readability.
- [Section 4.6.2] The ADF p-values are reported with three decimal places and some as 0.000; in the text they are described as 'suggestive' and 'not formal' but the table may give an impression of precision. Consider reporting p>0.001 as '<0.001' and noting the informal nature in the caption.
Circularity Check
No significant circularity: empirical FPCA/Legendre findings are measurements with a random-subspace benchmark; the only self-citation is non-load-bearing.
full rationale
The paper's central claims are empirical descriptions of the constructed liquidity surface, not derivations from a fitted parameter. PCA is computed directly from the data, and the Legendre alignment is measured via projection distance and compared to the expected distance for random subspaces, so the alignment is not imposed by construction. No parameter is fitted to force the eigenfunctions toward Legendre polynomials, and no out-of-sample prediction is claimed from fitted inputs. The only author self-citation is [TW24], cited in background motivation for where LPs concentrate capital; it does not enter the FPCA, subspace-distance, or time-series derivations. Appendix B's rank-standardized coordinate system is a modeling choice with an acknowledged caveat: 'In practice, jumps typically occur at each step near the current price, in which case x_j is simply an affine transform of the raw tick j.' This caveat affects interpretation and generalizability—the results are stated for the jump-rank grid rather than raw tick distance—but it does not reduce any claimed result to its own input by definition. The AR(1)-GARCH findings are in-sample descriptions of the score series, not forecasts generated by a fitted model and then relabeled as predictions. Therefore no circular step is exhibited; the minor self-citation is not load-bearing.
Assumptions & free parameters
free parameters (5)
- K (number of factors) =
5
- M (number of relative ticks) =
201
- T (rolling window size) =
400
- Sampling interval =
8 hours (2400 blocks ETH, 115200 ARB)
- Legendre basis degree =
5
assumptions (5)
- domain assumption The Teahouse Finance API provides an accurate record of aggregate Uniswap v3 liquidity per block.
- domain assumption At each time t there are at least (M-1)/2 jump ticks on each side of the current tick, so the rank-standardized grid is well-defined.
- ad hoc to paper PCA on the sample covariance of undifferenced, possibly nonstationary log-liquidity yields interpretable factors.
- standard math BIC selection among AR-GARCH models identifies the preferred data-generating process.
- domain assumption Legendre polynomials form an appropriate comparison basis for the liquidity surface on [-1,1].
Cite this review
Pith. "Pith review of Dynamics of Liquidity Surfaces in Uniswap v3." pith.science (2026). https://pith.science/paper/S6DP6467
@misc{pith2026250905013,
  author       = {Pith},
  title        = {Pith review of: Dynamics of Liquidity Surfaces in Uniswap v3},
  year         = {2026},
  howpublished = {\url{https://pith.science/paper/S6DP6467}},
  note         = {Machine review of arXiv:2509.05013}
}
abstract
This paper presents a comprehensive study on the empirical dynamics of Uniswap v3 liquidity, which we model as a time-tick surface, $L_t(x)$. Using a combination of functional principal component analysis (FPCA) and dynamic factor methods, we analyze three distinct pools over multiple sample periods. Our findings offer three main contributions: a statistical characterization of automated market maker liquidity, an interpretable and portable basis for dimension reduction, and a robust analysis of liquidity dynamics using rolling window metrics. For the 5 bps pools, the leading empirical eigenfunctions explain the majority of cross-tick variation and remain stable, aligning closely with a low-order Legendre polynomial basis. This alignment provides a parsimonious and interpretable structure, similar to the dynamic Nelson-Siegel method for yield curves. The factor coefficients exhibit a time series structure well-captured by AR(1) models with clear GARCH-type heteroskedasticity and heavy-tailed innovations.
Figures


Figures from the paper (18 more)



Reference graph
Works this paper leans on
-
[1]
Improved price oracles: Constant function market makers
Guillermo Angeris and Tarun Chitra. Improved price oracles: Constant function market makers. In Proceedings of the 2nd ACM Conference on Advances in Financial Technologies , AFT '20, pages 80--91, 2020
work page 2020
-
[2]
Price discovery and efficiency in uniswap liquidity pools
Carol Alexander, Xi Chen, Jun Deng, and Qi Fu. Price discovery and efficiency in uniswap liquidity pools. Journal of Futures Markets , 2025
work page 2025
-
[3]
PCA for Implied Volatility Surfaces
Marco Avellaneda, Brian Healy, Andrew Papanicolaou, and George Papanicolaou. Pca for implied volatility surfaces. arXiv preprint arXiv:2002.00085 , 2020
work page Pith review arXiv 2002
-
[4]
Hayden Adams, Noah Zinsmeister, and Dan Robinson. Uniswap v2 core. https://uniswap.org/whitepaper-v2.pdf, 2020. Accessed: July 17, 2025
work page 2020
-
[5]
Hayden Adams, Noah Zinsmeister, Moody Salem, River Keefer, and Dan Robinson. Uniswap v3 core, 2021. Accessed: July 17, 2025
work page 2021
-
[6]
Trades, Quotes and Prices: Financial Markets Under the Microscope
Jean-Philippe Bouchaud, Julius Bonart, Jonathan Donier, and Martin Gould. Trades, Quotes and Prices: Financial Markets Under the Microscope . Cambridge University Press, 2018
work page 2018
-
[7]
Dex specs: A mean field approach to defi currency exchanges
Erhan Bayraktar, Asaf Cohen, and April Nellis. Dex specs: A mean field approach to defi currency exchanges. arXiv preprint arXiv:2404.09090 , 2024
arXiv 2024
-
[8]
Decentralized finance and automated market making: Predictable loss and optimal liquidity provision
\'A lvaro Cartea, Fay c al Drissi, and Marcello Monga. Decentralized finance and automated market making: Predictable loss and optimal liquidity provision. SIAM Journal on Financial Mathematics , 15(3):931--959, 2024
work page 2024
Show all 44 references
-
[9]
Jens H. E. Christensen, Francis X. Diebold, and Glenn D. Rudebusch. The affine arbitrage-free class of nelson--siegel term structure models. Journal of Econometrics , 164(1):4--20, 2011
2011
-
[10]
Dynamics of implied volatility surfaces
Rama Cont and Jos \'e Da Fonseca. Dynamics of implied volatility surfaces. Quantitative Finance , 2(1):45, 2002
2002
-
[11]
The adoption of blockchain-based decentralized exchanges
Agostino Capponi and Ruizhe Jia. The adoption of blockchain-based decentralized exchanges. arXiv preprint arXiv:2103.08842 , 2021
2021 arXiv
-
[12]
M \"u ller
Rama Cont and Marvin S. M \"u ller. A stochastic partial differential equation model for limit order book dynamics. SIAM Journal on Financial Mathematics , 12(2):744--787, 2021
2021
-
[13]
Empirical properties of asset returns: stylized facts and statistical issues
Rama Cont. Empirical properties of asset returns: stylized facts and statistical issues. Quantitative Finance , 1(2):223, 2001
2001
-
[14]
A stochastic model for order book dynamics
Rama Cont, Sasha Stoikov, and Rishi Talreja. A stochastic model for order book dynamics. Operations Research , 58(3):549--563, 2010
2010
-
[15]
Diebold and Canlin Li
Francis X. Diebold and Canlin Li. Forecasting the term structure of government bond yields. Journal of Econometrics , 130(2):337--364, 2006
2006
-
[16]
Diebold, Canlin Li, and Vivian Z
Francis X. Diebold, Canlin Li, and Vivian Z. Yue. Global yield curve dynamics and interactions: a dynamic nelson--siegel approach. Journal of Econometrics , 146(2):351--363, 2008
2008
-
[17]
Marmolejo-Coss \' o, Ben Altschuler, He Sun, Xintong Wang, and David Parkes
Zhou Fan, Francisco J. Marmolejo-Coss \' o, Ben Altschuler, He Sun, Xintong Wang, and David Parkes. Differential liquidity provision in uniswap v3 and implications for contract design. In Proceedings of the Third ACM International Conference on AI in Finance , pages 9--17, 2022
2022
-
[18]
Moroz, Michael Neuder, Rithvik Rao, and David C
Zhou Fan, Francisco Marmolejo-Cossio, Daniel J. Moroz, Michael Neuder, Rithvik Rao, and David C. Parkes. Strategic liquidity provision in uniswap v3. arXiv preprint arXiv:2106.12033 , 2021
2021 arXiv
-
[19]
Decentralized finance & blockchain technology
Emmanuel Gobet and Anastasia Melachrinos. Decentralized finance & blockchain technology. In SIAM Financial Mathematics and Engineering 2023 , Jun 2023
2023
-
[20]
Gould, Mason A
Martin D. Gould, Mason A. Porter, Stacy Williams, Mark McDonald, Daniel J. Fenn, and Sam D. Howison. Limit order books. Quantitative Finance , 13(11):1709--1742, 2013
2013
-
[21]
Dynamic functional principal components
Siegfried H \"o rmann, ukasz Kidzi \'n ski, and Marc Hallin. Dynamic functional principal components. Journal of the Royal Statistical Society Series B: Statistical Methodology , 77(2):319--348, 2015
2015
-
[22]
Interest rate forecasting with principal component analysis based on long-run covariance matrix
Hugo Hissinaga and M \'a rcio Laurini. Interest rate forecasting with principal component analysis based on long-run covariance matrix. Annals of Financial Economics , 19(02):2450005, 2024
2024
-
[23]
Simulating and analyzing order book data: The queue-reactive model
Weibing Huang, Charles-Albert Lehalle, and Mathieu Rosenbaum. Simulating and analyzing order book data: The queue-reactive model. Journal of the American Statistical Association , 110(509):107--122, 2015
2015
-
[24]
C. R. Harvey, A. Ramachandran, J. Santoro, F. Ehrsam, and V. Buterin. DeFi and the Future of Finance . Wiley, 2021
2021
-
[25]
Spencer Hays, Haipeng Shen, and Jianhua Z. Huang. Functional dynamic factor models with application to yield curve forecasting. The Annals of Applied Statistics , 6(3):870--894, 2012
2012
-
[26]
Risks and returns of uniswap v3 liquidity providers
Lioba Heimbach, Eric Schertenleib, and Roger Wattenhofer. Risks and returns of uniswap v3 liquidity providers. In Proceedings of the 4th ACM Conference on Advances in Financial Technologies , pages 89--101, 2022
2022
-
[27]
Arbitrum: Scalable, private smart contracts
Harry Kalodner, Steven Goldfeder, Xiaoqi Chen, S Matthew Weinberg, and Edward W Felten. Arbitrum: Scalable, private smart contracts. In 27th USENIX Security Symposium (USENIX Security 18) , pages 1353--1370, 2018
2018
-
[28]
An event study of the ethereum transition to proof-of-stake
Elie Kapengut and Bruce Mizrach. An event study of the ethereum transition to proof-of-stake. Commodities , 2(2):96--110, 2023
2023
-
[29]
Bayes factors
Robert E Kass and Adrian E Raftery. Bayes factors. Journal of the american statistical association , 90(430):773--795, 1995
1995
-
[30]
Impermanent loss in uniswap v3
Stefan Loesch, Nate Hindman, Mark B Richardson, and Nicholas Welch. Impermanent loss in uniswap v3. arXiv preprint arXiv:2111.09192 , 2021
2021 arXiv
-
[31]
Common factors affecting bond returns
Robert Litterman. Common factors affecting bond returns. Journal of Fixed Income , pages 54--61, 1991
1991
-
[32]
Defi: Modeling and forecasting trading volume on uniswap v3 liquidity pools
Deborah Miori and Mihai Cucuringu. Defi: Modeling and forecasting trading volume on uniswap v3 liquidity pools. Available at SSRN 4445351 , 2023
2023
-
[33]
Clustering uniswap v3 traders from their activity on multiple liquidity pools, via novel graph embeddings
Deborah Miori and Mihai Cucuringu. Clustering uniswap v3 traders from their activity on multiple liquidity pools, via novel graph embeddings. Digital Finance , 6(1):113--143, 2024
2024
-
[34]
The random matrix theory of the classical compact groups , volume 218
Elizabeth S Meckes. The random matrix theory of the classical compact groups , volume 218. Cambridge University Press, 2019
2019
-
[35]
Moallemi, and Tim Roughgarden
Jason Milionis, Ciamac C. Moallemi, and Tim Roughgarden. Complexity-approximation trade-offs in exchange mechanisms: Amms vs. lobs. In Financial Cryptography and Data Security: 27th International Conference, FC 2023, Bol, Brač, Croatia, May 1–5, 2023, Revised Selected Papers, ...
2023
-
[36]
Nelson and Andrew F
Charles R. Nelson and Andrew F. Siegel. Parsimonious modeling of yield curves. Journal of Business , pages 473--489, 1987
1987
-
[37]
The use of principal component analysis (pca) in building yield curve scenarios and identifying relative-value trading opportunities on the romanian government bond market
Andreea Oprea. The use of principal component analysis (pca) in building yield curve scenarios and identifying relative-value trading opportunities on the romanian government bond market. Journal of Risk and Financial Management , 15(6):247, 2022
2022
-
[38]
Functional data analysis
James O Ramsay and Bernard W Silverman. Functional data analysis . Springer, 2005
2005
-
[39]
On modeling and forecasting time series of smooth curves
Haipeng Shen. On modeling and forecasting time series of smooth curves. Technometrics , 51(3):227--238, 2009
2009
-
[40]
bashtage/arch: Release 4.18 (Version v4.18)
Kevin Sheppard. bashtage/arch: Release 4.18 (Version v4.18) . Zenodo, March 2021
2021
-
[41]
Dynamic factor models
James H Stock and Mark W Watson. Dynamic factor models. 2011
2011
-
[42]
A mathematical framework for modelling clmm dynamics in continuous time
Shen-Ning Tung and Tai-Ho Wang. A mathematical framework for modelling clmm dynamics in continuous time. arXiv preprint arXiv:2412.18580 , 2024
2024 arXiv
-
[43]
Adaptive liquidity provision in uniswap v3 with deep reinforcement learning
Haochen Zhang, Xi Chen, and Lin F Yang. Adaptive liquidity provision in uniswap v3 with deep reinforcement learning. arXiv preprint arXiv:2309.10129 , 2023
2023 arXiv
-
[44]
What drives liquidity on decentralized exchanges? evidence from the uniswap protocol
Brian Z Zhu, Dingyue Liu, Xin Wan, Gordon Liao, Ciamac C Moallemi, and Brad Bachu. What drives liquidity on decentralized exchanges? evidence from the uniswap protocol. arXiv preprint arXiv:2410.19107 , 2024
2024 arXiv
Reviewed August 5, 2026 · model on record in the stance chip above.
Discussion (0). Sign in to comment.