REVIEW 3 major objections 5 minor 25 references
Reconstruction of cosmic-ray muon events with CUORE
T0 review · 3 major / 5 minor · reviewed 2026-08-05 · deepseek-v4-flash
Pith's one-line read CUORE, a segmented cryogenic calorimeter array, reconstructs the three-dimensional path of through-going cosmic-ray muons event by event and uses the resulting sample to measure the underground muon flux at Gran Sasso.
desk verdict Competent application of existing MOO tracking to real CUORE muon data; flux matches LNGS measurements, with the Z-cut on burst runs the main open question. read the letter →
The pith
A machine-rendered reading of the paper's core claim, the machinery that carries it, and where it could break.
The reading
What carries the argument
The machinery is the multi-objective optimization (MOO) track-reconstruction algorithm, implemented with the pymoo library. It assigns a straight-line track to a detector-wide cluster of coincident crystal hits by jointly minimising differentiable proxies for two topology violations: the number of 'missing' channels (energy above threshold but not intersected by the track) and 'extra' channels (intersected by the track but without energy). The algorithm exploits the full detector geometry, including channels that did not fire, which makes it more robust to accidental coincidences and stray secondaries than a simple least-squares fit. The other load-bearing element is a Geant4-based Monte Car
What would settle it
Check the burst-like events rejected by the Z-cut with a coincident fast-timing muon detector at LNGS: if they arrive in time with through-going muon bundles or have a muon-like angular distribution, the flux measurement would need to include them, changing the result. Alternatively, re-run the analysis without the Z-cut and compare the resulting flux with MACRO and Borexino.
Extended reading notes
Core claim
The central claim is that CUORE's 988-crystal segmented array can reconstruct the three-dimensional path of through-going cosmic-ray muons on an event-by-event basis without any timing information. The track is found by a multi-objective optimization that balances two penalties: 'missing' crystals, which registered energy but are not intersected by the trial track, and 'extra' crystals, which lie on the trial track but registered no energy. The resulting angular resolution is about 5 degrees in azimuth and 2 degrees in zenith, limited by the detector's small footprint and inter-crystal spacing. Applying this reconstruction to high-multiplicity (M≥5) events with energy deposits above 9 MeV yi
Load-bearing premise
The analysis assumes that the burst-like events that appear in some runs are non-muon background and that the true per-run muon rate is stationary and normally distributed, so that rejecting runs above 21.3 clusters per day and correcting with an acceptance of 0.955 gives an unbiased flux.
Editorial extensions
If this is right
- A segmented cryogenic calorimeter can act as a muon tracker without any fast timing, extending the physics reach of such detectors beyond single-site rare-event searches.
- The reconstructed muon sample provides a data-driven handle on muon-induced and cosmogenic background for CUPID, which will reuse the CUORE infrastructure at the same site.
- The measured flux validates the detector-response and simulation chain for high-energy, multi-crystal events, strengthening confidence in the earlier fractional-charge search that used the same track-like signature.
- The technique can support follow-up studies of delayed products of muon interactions and of detector response to saturated, high-energy pulses that are normally discarded.
Reading between the lines
- If the ~2-5 degree angular resolution is representative, the same reconstruction could serve as a background self-monitor in future segmented cryogenic arrays, flagging muon events without an external veto.
- The burst-like events that motivated the Z-cut could be examined against external muon-monitor data at LNGS; if they turn out to be muon bundles, the measured flux would need a small upward revision and the rejected 8.3% livetime would have to be revisited.
- The dominant systematic is the extrapolation of the effective area to shallow zenith angles (cosθ < 0.4); extending the Monte Carlo generator's angular coverage would likely reduce the reported uncertainty more than any other single improvement.
- Because the track model is a straight line, events containing two or more simultaneous muons are reconstructed as a single distorted track; a joint analysis with a fast veto layer could separate such bundles and sharpen the background model.
Editorial analysis
A structured set of objections, weighed in public.
Referee Report
Summary. The paper reports the in-situ reconstruction of through-going cosmic-ray muons in the CUORE cryogenic TeO2 calorimeter array using a multi-objective optimization algorithm applied to the segmented crystal hit pattern. After selecting high-multiplicity (M≥5) clusters with energies above 9 MeV and excluding runs with burst-like spurious events (the Z-cut, Sec. 4.2) and one low-purity dataset (dataset 1, Sec. 4.3), the authors measure the integral underground muon flux at LNGS as Φ = [3.40 ± 0.07 (stat.) ± 0.06 (syst.)] × 10^-4 s^-1 m^-2, consistent with MACRO, Borexino, LVD, and MUTEv3. The paper claims the first demonstration of 3D particle tracking and reconstruction of through-going muons with per-event angular determination in a millikelvin cryogenic detector array, and states the result will be important for validating the muon-related background in CUPID.
Significance. If the result holds, this is a notable technical milestone: it demonstrates that a low-temperature calorimeter array can reconstruct track-like events with per-event angular determination, and it provides a muon-flux measurement at the CUORE site in agreement with dedicated muon experiments. Strengths include the MC-based validation of the reconstruction (Fig. 3), the data-MC comparison of hit channels (Fig. 5, p=0.06), the explicit systematic uncertainty breakdown (Table 2), and the fact that the flux is derived from a counting formula, not from a fit to a model. The paper is candid about the unresolved origin of the burst-like events and the flat extrapolation of the effective area at shallow zenith angles, which is a positive feature.
major comments (3)
- [Sec. 4.2] The Z-cut is load-bearing for the flux. The paper assumes a normal, stationary per-run rate of true muon events and rejects all runs above 21.3 clusters/day, treating the excess as bursts of unresolved origin. The correction ε_Z = 0.955 ± 0.014 only compensates for statistical truncation of a normal distribution; it does not address the possibility that some rejected bursts contain real muons (e.g., muon bundles or short-term environmental enhancements) or that the true per-run rate is overdispersed/non-stationary. Since 8.3% of the pre-cut livetime is removed, any misclassification biases Φ through Eq. (3). Please add a robustness study: fit the per-run distribution to a Poisson or mixture model, vary the Z-cut threshold, or quantify the bias if a fraction of bursts are genuine muons. Without this, the quoted systematic uncertainty likely underestimates the risk.
- [Sec. 4.3] Dataset 1 is excluded based on an inter-arrival-time fit giving purity <85%. This is a post hoc dataset removal and its potential bias is not included in the systematic budget. Although the exposure is small (~1%), the same unresolved burst population motivated the exclusion. Either include dataset 1 with an appropriate correction or add a systematic term covering the exclusion decision; otherwise the final flux is conditioned on a data-dependent selection whose impact is not quantified.
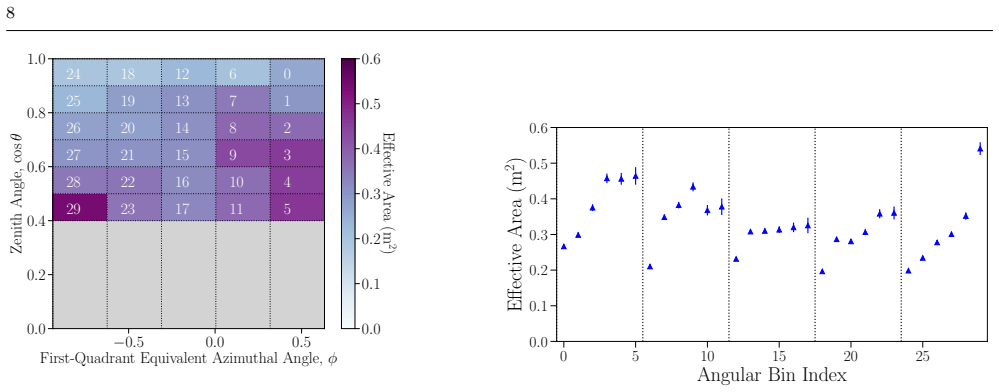
- [Sec. 5.3 / Eq. (3)] The per-event weighting in Eq. (3) uses the reconstructed direction to assign A_eff. Figure 3 shows non-Gaussian reconstruction tails (ΔAz up to tens of degrees) and Figure 6 shows that A_eff varies strongly with angle. If the reconstruction tails are angle-dependent, the estimator can be biased. No closure test is shown in which Monte Carlo events with a known flux are passed through the full selection and reconstruction and Eq. (3) recovers the input flux. Please add such a test; if a bias is found, incorporate it as a systematic uncertainty.
minor comments (5)
- [Eq. (3)] The printed formula is garbled in the text (appears as 'Φds = 1/ϵZ T n 1/n Σ ε_i A_eff'). Please typeset it unambiguously—likely the intended expression is a sum of inverse effective areas, or alternatively n/(Σ ε_i A_eff).
- [Sec. 4.2] The derivation of the ε_Z uncertainty (0.014) is not detailed. Specify whether it is the standard error of the ratio between the mean and the truncated mean of the good-run distribution.
- [Fig. 6] The left color bar appears to have duplicate tick labels in the 0–0.6 range; clean up the figure.
- [Sec. 6.1] Two occurrences of 'cosϕ = 0.4' should read 'cosθ = 0.4' (the zenith angle is θ, while ϕ is the azimuth).
- [Sec. 4.1] The statement that 'no background events from any other standard model process' contribute is stronger than the supporting argument; consider softening to 'are expected to be negligible at the current sensitivity.'
Circularity Check
No significant circularity: the flux result is a counting measurement with MC-derived acceptance; the Z-cut and impurity corrections are stated statistical assumptions, not fits renamed as predictions.
full rationale
The central flux extraction is not equivalent to its inputs by construction. Equation (3) computes the flux from the observed muon-candidate count n, the dataset livetime T, the clustering efficiency ε_i, and the MC-derived effective area A_eff(φ_i, cosθ_i), with the Z-cut acceptance ε_Z included as a correction. The effective area is determined per angular bin from Geant4 simulations (Eq. 2), i.e., it is an external detector-response input rather than a quantity fitted to the measured flux. The validation step that scales simulations to the Borexino flux is explicitly a comparison exercise and is not used in Eq. (3) for the final flux. The paper's weakest point is statistical rather than circular: the Z-cut assumes a stationary, normally distributed true muon rate, and the dataset-1 impurity rejection assumes an exponential inter-arrival distribution in a control region; the paper itself states that the origin of the burst-like spurious events 'remains unsolved.' These are modeling assumptions that could bias the flux, but they do not define the measured flux in terms of the assumed distribution, and the associated correction ε_Z = 0.955 ± 0.014 is reported as a systematic uncertainty rather than disguised as a prediction. The MOO reconstruction algorithm is cited from prior work by overlapping authors, but it is a method tool validated here against Monte Carlo truth; no uniqueness theorem or physics ansatz is imported by that self-citation. The paper is self-contained against external benchmarks (MACRO, Borexino, LVD) and the derivation chain is not circular.
Assumptions & free parameters
free parameters (5)
- Analysis energy threshold =
9 MeV
- Cluster coincidence window =
100 ms
- Multiplicity cut =
M >= 5
- Z-cut rate threshold =
21.3 clusters/run-day (~2 sigma)
- Effective area flat extrapolation below cos(theta)=0.4 =
N/A (model choice)
assumptions (6)
- domain assumption The Geant4 simulation accurately models the CUORE detector geometry, crystal energy response, and muon energy loss and secondary production.
- domain assumption The cosmic-ray muon angular distribution at LNGS follows the MACRO-measured distribution.
- ad hoc to paper True muon events follow a stationary Poisson process, and burst-like events with per-run rates above 2 sigma of the per-run distribution are spurious.
- domain assumption No standard-model process other than cosmic-ray muons produces clusters with energy above 9 MeV and multiplicity >= 5 at non-negligible rates.
- domain assumption Clustering efficiency can be estimated by resampling trigger times around identified muon candidates.
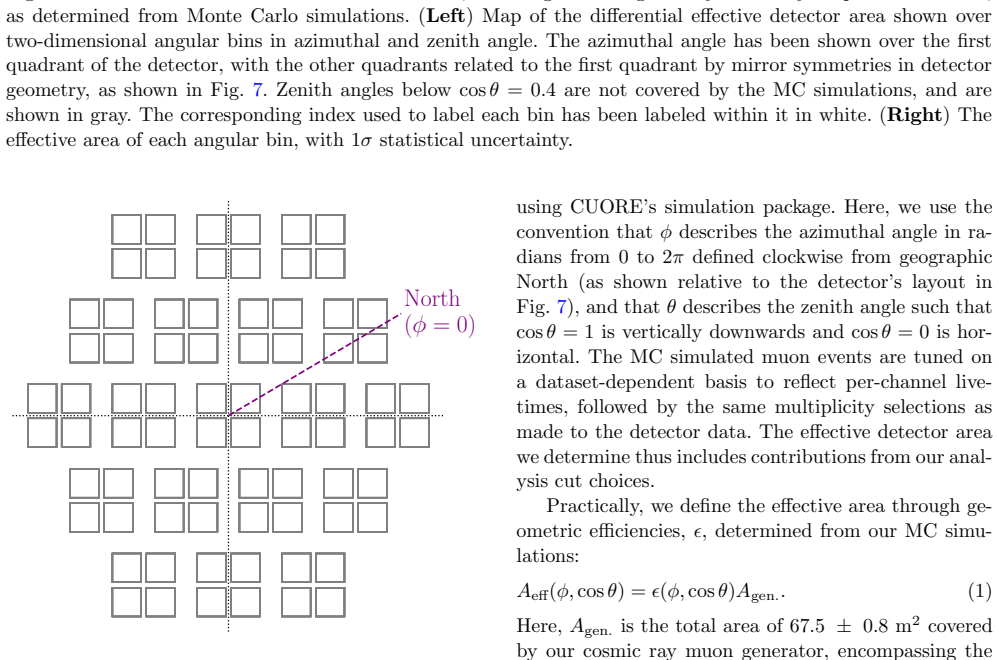
- domain assumption The detector geometry has fourfold azimuthal symmetry so the effective area can be mirrored across quadrants.
Cite this review
Pith. "Pith review of Reconstruction of cosmic-ray muon events with CUORE." pith.science (2026). https://pith.science/paper/RYKMPUAA
@misc{pith2026250905528,
  author       = {Pith},
  title        = {Pith review of: Reconstruction of cosmic-ray muon events with CUORE},
  year         = {2026},
  howpublished = {\url{https://pith.science/paper/RYKMPUAA}},
  note         = {Machine review of arXiv:2509.05528}
}
abstract
We report the in-situ 3D reconstruction of through-going muons in the CUORE experiment, a cryogenic calorimeter array searching for neutrinoless double beta ($0\nu\beta\beta$) decay, leveraging the segmentation of the detector. Due to the slow time response of the detector, time-of-flight estimation is not feasible. Therefore, the track reconstruction is performed using a multi-objective optimization algorithm that relies on geometrical information from the detector as a whole. We measure the integral flux of cosmic-ray muons underground at the {\it Laboratori Nazionali del Gran Sasso}, and find our value to be in good agreement with other experiments that have performed a similar measurement. To our knowledge, this work represents the first demonstration of 3D particle tracking and reconstruction of through-going muons with per-event angular determination in a millikelvin cryogenic detector array. The analysis performed for this work will be critical for validating the muon-related background in CUPID, a next-generation $0\nu\beta\beta$ experiment, and for follow-up studies on detector response and on delayed products induced by cosmic-ray muons.
Figures


Figures from the paper (7 more)




Reference graph
Works this paper leans on
-
[1]
Bellini, et al., JCAP05, 015 (2012)
G. Bellini, et al., JCAP05, 015 (2012). DOI 10.1088/ 1475-7516/2012/05/015
work page 2012
-
[2]
M. Ambrosio, et al., Phys. Rev. D56, 1418 (1997). DOI 10.1103/PhysRevD.56.1418. URLhttps://link. aps.org/doi/10.1103/PhysRevD.56.1418
-
[3]
D.Q. Adams, et al., Phys. Rev. Lett.133(24), 241801 (2024). DOI 10.1103/PhysRevLett.133.241801
-
[4]
K. Alfonso, et al., Eur. Phys. J. C85(7), 737 (2025). DOI 10.1140/epjc/s10052-025-14352-1
-
[5]
U.S. Geological Survey. Global multi-resolution ter- rain elevation data 2010 (GMTED2010). URLhttps: //topotools.cr.usgs.gov/gmted_viewer/index.html
work page 2010
-
[6]
D.Q. Adams, et al., Phys. Rev. D110(5), 052003 (2024). DOI 10.1103/PhysRevD.110.052003
-
[7]
Alduino, et al., Cryogenics102, 9 (2019)
C. Alduino, et al., Cryogenics102, 9 (2019). DOI 10. 1016/j.cryogenics.2019.06.011
work page 2019
-
[8]
CUORE Collaboration, arXiv e-prints arXiv:2404.04453 (2024). DOI 10.48550/arXiv.2404.04453
Show all 25 references
-
[9]
Adams, et al., Nature604(7904), 53 (2022)
D.Q. Adams, et al., Nature604(7904), 53 (2022). DOI 10.1038/s41586-022-04497-4
2022 doi
-
[10]
Vetter, et al., Eur
K.J. Vetter, et al., Eur. Phys. J. C84(3), 243 (2024). DOI 10.1140/epjc/s10052-024-12595-y
2024 doi
-
[11]
Gatti, P.F
E. Gatti, P.F. Manfredi, La Rivista del Nuovo Cimento (1978-1999)9(1), 1 (1986). DOI 10.1007/BF02822156. URLhttps://doi.org/10.1007/BF02822156
1978 doi
-
[12]
Alduino, et al., Phys
C. Alduino, et al., Phys. Rev. C93(4), 045503 (2016). DOI 10.1103/PhysRevC.93.045503
2016 doi
-
[13]
Yocum, D
J. Yocum, D. Mayer, J.L. Ouellet, L. Winslow, JINST 17(07), P07004 (2022). DOI 10.1088/1748-0221/17/07/ P07004
2022 doi
-
[14]
Blank, K
J. Blank, K. Deb, IEEE Access8, 89497 (2020)
2020
-
[15]
Ramachandran, G
P. Ramachandran, G. Varoquaux, CiSE13(2), 40–51 (2011). DOI 10.1109/mcse.2011.35. URLhttp://dx. doi.org/10.1109/MCSE.2011.35
2011 doi
-
[16]
DOI 10.1109/TNS.2006
Geant4 Collaboration, IEEE Transactions on Nuclear Science53(1), 270 (2006). DOI 10.1109/TNS.2006. 869826 13
2006 doi
-
[17]
DOI https://doi.org/10.1016/j.nima.2016.06.125
Geant4 Collaboration, NIMA835, 186 (2016). DOI https://doi.org/10.1016/j.nima.2016.06.125
2016 doi
-
[18]
Foreman-Mackey, JOSS1(2), 24 (2016)
D. Foreman-Mackey, JOSS1(2), 24 (2016). DOI 10.21105/joss.00024. URLhttps://doi.org/10.21105/ joss.00024
2016 doi
-
[19]
Bellini, et al., JINST5, P12005 (2010)
F. Bellini, et al., JINST5, P12005 (2010). DOI 10.1088/ 1748-0221/5/12/P12005
2010
-
[20]
Simonelli, J
A. Simonelli, J. Belfi, N. Beverini, G. Carelli, A.D. Vir- gilio, E. Maccioni, G.D. Luca, G. Saccorotti, Annals of Geophysics59(2016). DOI 10.4401/ag-6970. URL http://dx.doi.org/10.4401/ag-6970
2016 doi
-
[21]
Mayer, Advanced Reconstruction Techniques for CUORE: Searching Beyond the Standard Model with Cryogenic Calorimeters
D.W. Mayer, Advanced Reconstruction Techniques for CUORE: Searching Beyond the Standard Model with Cryogenic Calorimeters. Ph.D. thesis, MIT (2024). URL https://dspace.mit.edu/handle/1721.1/157595
2024
-
[22]
Agafonova, et al., Phys
N.Y. Agafonova, et al., Phys. Rev. D100, 062002 (2019). DOI 10.1103/PhysRevD.100.062002. URLhttps:// link.aps.org/doi/10.1103/PhysRevD.100.062002
2019 doi
-
[23]
Woodley, A
W. Woodley, A. Fedynitch, M.C. Piro, Phys. Rev. D 110(6), 063006 (2024). DOI 10.1103/PhysRevD.110. 063006
2024 doi
-
[24]
Agostini, et al., JCAP02, 046 (2019)
M. Agostini, et al., JCAP02, 046 (2019). DOI 10.1088/ 1475-7516/2019/02/046
2019
-
[25]
Bellini, et al., JINST6(05), P05005–P05005 (2011)
G. Bellini, et al., JINST6(05), P05005–P05005 (2011). DOI 10.1088/1748-0221/6/05/p05005. URLhttp://dx. doi.org/10.1088/1748-0221/6/05/P05005
2011 doi
Reviewed August 5, 2026 · model on record in the stance chip above.
Discussion (0). Sign in to comment.