REVIEW 3 major objections 4 minor 23 references
Eye Movement Feature-Guided Signal De-Drifting in Electrooculography Systems
T0 review · 3 major / 4 minor · reviewed 2026-08-04 · deepseek-v4-flash
Pith's one-line read Eye-movement features guide a drift-removal method that cuts EOG gaze error by up to 36 percent.
desk verdict The method is plausible but the central quantitative claim compares real-data FGD to simulation-only alternatives, so the reported superiority is not established. read the letter →
The pith
A machine-rendered reading of the paper's core claim, the machinery that carries it, and where it could break.
The reading
What carries the argument
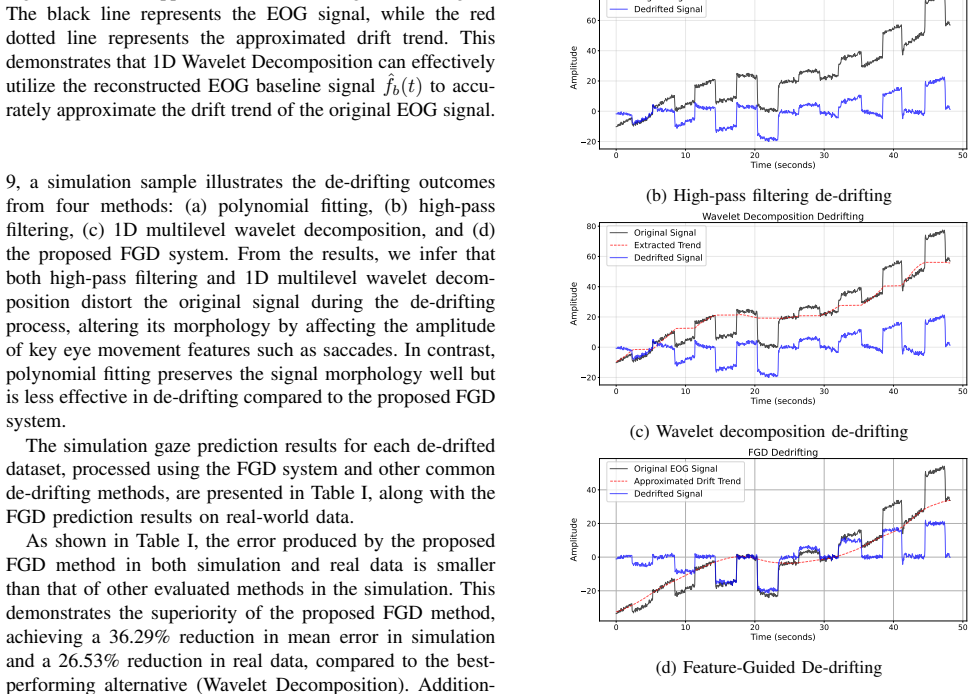
The load-bearing mechanism is the Baseline Reconstructor: it converts the saccade-excluded signal into a continuous, drift-only baseline by adding a per-segment displacement computed from the signal mean around each saccade's start and end. This removes saccade morphology from the drift estimate before the 1D multilevel wavelet decomposition (level 7) fits the low-frequency trend, so the final subtraction corrects drift without flattening the eye-movement features.
What would settle it
Take a simulated EOG signal generated as in the paper's simulation setup but add a low-frequency drift component (e.g., a 0.05 Hz ramp) that begins during the first five seconds of calibration. Run FGD and plain wavelet decomposition, and compare their reconstructed drift trends against the known injected drift. If FGD's trend estimate is no closer to the true drift than the wavelet baseline, the initial drift-free calibration assumption fails.
Extended reading notes
Core claim
The central discovery is that a drift estimate should be computed from a signal from which saccades have been actively subtracted and whose remaining segments have been reconnected, not from the raw EOG trace. Treating E(t)=f(t)+d(t)+w(t), the authors identify saccades from derivative peaks, mark each saccade's start and end with adaptive thresholds, reconstruct the baseline by shifting each non-saccade segment by a displacement that matches its endpoints, and then apply 1D multilevel wavelet decomposition to this reconstructed baseline to approximate the drift trend. Subtracting that trend from the raw signal yields a de-drifted signal whose gaze predictions are more accurate than polynomia
Load-bearing premise
The method assumes the first five seconds of recording are free of baseline drift; if drift is already present during that calibration window, the reconstructed baseline is shifted, and the drift trend estimated from it is wrong.
Editorial extensions
If this is right
- EOG-based gaze tracking can be used in free-movement scenarios where gaze targets are not pre-scripted, since FGD needs no prior trial-protocol knowledge.
- Saccade morphology survives de-drifting, so downstream analyses that rely on saccade amplitudes and timing are not corrupted by the drift removal step.
- The method's lower sampling-frequency requirement makes drift-free EOG feasible on cheaper hardware for wearable and robotic interfaces.
- The same FGD output can feed sensor-fusion pipelines for human-robot collaboration with a cleaner baseline, improving gaze prediction for intent inference.
- With further work, the offline wavelet step can be replaced by low-latency trend estimation, pointing to real-time closed-loop control.
Reading between the lines
- If the calibration-period-drift assumption is common in the target deployments, adding a drift estimate for the first five seconds (e.g., from a longer pre-recording or from electrode impedance checks) would make the method more reliable than the paper's current evaluation shows.
- The same detect-and-stitch baseline reconstruction could transfer to other biosignals with transient high-frequency events superimposed on low-frequency drift (e.g., ECG baseline wander), provided an event detector with comparable reliability exists.
- The reported error reductions combine drift removal with a fixed regression model; a reader should treat the percentages as end-to-end gaze-error gains, not as isolated measures of drift-estimation accuracy.
- A direct ablation that compares FGD against wavelet decomposition on the same reconstructed baseline without the saccade-removal step would quantify how much of the gain comes from feature guidance versus the wavelet settings.
Signed reviews
Editorial analysis
A structured set of objections, weighed in public.
Referee Report
Summary. The paper proposes a Feature-Guided De-drifting (FGD) pipeline for single-channel horizontal EOG. It detects saccades via derivative thresholds, reconstructs a saccade-free baseline by vertically aligning floating inter-saccadic segments, approximates the drift trend with level-7 1D wavelet decomposition, and subtracts the trend from the raw signal. Gaze is then predicted by regression calibrated to PtGaze reference. The authors evaluate FGD in simulation by injecting low-frequency drift into a minimally drifting real EOG sample and on real data from one subject (90 saccades). They report mean gaze-prediction error reductions to 0.896° (36.29%) in simulation and 1.033° (26.53%) on real data compared with wavelet decomposition, and claim superior morphology preservation.
Significance. If the claimed accuracy and morphology preservation were established, FGD would be a practical contribution to long-term EOG gaze tracking in free-movement HRC, with the notable advantage of not requiring a fixed cue-target protocol. The algorithmic architecture is clearly described and the idea of feature-guided baseline reconstruction is reasonable. Credit is due for reporting both simulation and pilot real-data results and for specifying the signal model, electrode configuration, and parameter choices. However, the evidence currently provided does not support the central comparative claims: the real-data comparison is not against the same methods on the same data, and key parameters were tuned on the evaluation set. No code or data are supplied, so the numerical results are not independently reproducible. The paper would need re-evaluation experiments, not just re-analysis, to support its conclusions.
major comments (3)
- [§IV-C, Table I] The central claim that FGD achieves a 26.53% reduction in real data compared with the best alternative is not supported by a same-condition comparison. In Table I, the Polynomial Fitting, High-pass Filtering, and Wavelet Decomposition columns are simulation results from the 10 injected-drift scenarios, while the Real Data column contains only the proposed FGD. The text in §IV-C nonetheless compares the real-data FGD average (1.033°) with the simulation Wavelet average (1.406°) and interprets the difference as a real-data improvement. Because the real and simulated signals contain different drift and noise characteristics, this comparison cannot establish superiority on real data. The authors should run all comparison methods on the same real recordings and report the resulting per-target and average errors, with a statistical test across saccades or subjects.
- [§IV-A parameter selection] Several key parameters are selected using the same data on which the final accuracy is reported. The text states that polynomial order 5, high-pass cutoff 0.3 Hz, wavelet decomposition level 7, and baseline reconstruction sample count m=15 were chosen 'based on performance testing with our dataset'; N=3 for the derivative is also tuned to the sampling frequency. No held-out split, cross-validation, or nested validation is described. The reported reductions are therefore optimistically biased and may not generalize. The authors should either fix parameters a priori from prior work/physical reasoning or perform selection on a training set and evaluate on a disjoint test set.
- [§III-B-2, Eq. (10)] The baseline reconstructor assumes that the first five seconds of calibration are drift-free. Equation (10) computes δ1 from the original E(t) alone, and the text says this 'assum[es] that the initial five seconds of calibration represent a drift-free true baseline.' If drift is already present during calibration, δ1 is biased, and because every later segment in Eqs. (11)-(13) is adjusted relative to the preceding adjusted values, the entire reconstructed baseline and the drift estimate are corrupted. The paper provides no evidence or test that the calibration interval is drift-free in the real data. This assumption should be either justified quantitatively or removed/replaced.
minor comments (4)
- [General] References [12] and [18] are duplicated (same Bulling et al. paper) and should be consolidated. The acknowledgment contains 'King Abudlaziz City for Science and Technology'; the spelling should be corrected.
- [IV-B] No quantitative detection accuracy is reported for the peak detector and saccade window detector; only selected plots are shown. Since the method's name and contribution rest on feature extraction, reporting true/false positive rates or comparing detected saccade boundaries against manual annotations would strengthen the paper.
- [Table I] The table reports only mean errors with standard deviations. The number of saccade events per target is not stated, and no significance tests are performed. At minimum, per-target sample sizes and confidence intervals should be given.
- [III-A] The blink removal procedure is described in prose but not formalized; the threshold and 'two consecutive oppositely directed surges' criterion would be difficult to reproduce. Consider adding an equation or pseudocode.
Circularity Check
De-drifting derivation is self-contained, but the reported performance gains are in-sample tuned and the real-data comparison is cross-condition.
-
fitted input called prediction
[Section IV-A 'Evaluation Setup' and Table I]
"a 5th-order polynomial fitting was selected for evaluation based on performance testing with our dataset. The high-pass filtering method was evaluated using a cutoff frequency of 0.3 Hz, determined through performance testing. For 1D multilevel wavelet decomposition, the decomposition level j was set to 7, as it provided the best approximation of the drift trend."
The parameters of the de-drifting methods, including the wavelet level j=7 used by FGD, are selected by performance testing on the same dataset that produces Table I's 'gaze prediction error' averages. The paper does not describe a held-out split. The reported 36.29% simulation improvement is therefore an in-sample optimized statistic rather than an independent prediction; the comparison is partly a selection artifact. This matches the pattern of fitting parameters on the evaluation data and then presenting the resulting error as a predicted reduction.
full rationale
The signal-processing chain (Eqs. 1-18) estimates the drift from the same E(t) that is de-drifted; this is inherent to de-drifting and not circular. The FGD's feature-guided baseline reconstruction is a genuine algorithmic addition, and the wavelet drift-trend extraction is standard rather than self-referential. The main circularity is in the evaluation: key parameters (polynomial order, high-pass cutoff, wavelet level j=7, and FGD's m=15) are tuned on the same data used for Table I, so the reported reductions are in-sample. The separate real-data '26.53% reduction' is additionally problematic because Table I contains only FGD real-data results; the alternatives' columns are simulation results, so the claimed real-data superiority is an arithmetic comparison across different conditions, not a same-condition measurement. This is an evaluation-validity concern rather than a derivation circle. The calibration-drift assumption in Sec. III-B-2 (initial five seconds assumed drift-free) is a limitation, not a circular step. Self-citations such as PtGaze/ETH-XGaze provide an external reference model and are not load-bearing for the de-drifting claim. Overall: no definitional circularity in the method, but partial circularity in how the performance claim is produced.
Assumptions & free parameters
free parameters (9)
- derivative lag N =
3
- peak grouping window =
500 ms
- peak threshold s_p =
not specified
- saccade window threshold s_i =
not specified
- baseline sample count m =
15
- wavelet decomposition level j =
7
- initial calibration period =
5 seconds
- polynomial order (comparison) =
5
- high-pass cutoff (comparison) =
0.3 Hz
assumptions (7)
- domain assumption EOG signal model E(t) = f(t) + d(t) + w(t)
- domain assumption Corneo-retinal potential is constant for a subject in range 0.4-1.0 mV
- domain assumption Drift frequency is below 0.1 Hz
- domain assumption Saccades are unaffected by drift due to short duration
- domain assumption All peaks detected after blink removal are saccades
- ad hoc to paper Initial five seconds of calibration are drift-free
- domain assumption Gaze behavior is linear within ±30 degrees
Cite this review
Pith. "Pith review of Eye Movement Feature-Guided Signal De-Drifting in Electrooculography Systems." pith.science (2026). https://pith.science/paper/G5KQNEWB
@misc{pith2026250907416,
  author       = {Pith},
  title        = {Pith review of: Eye Movement Feature-Guided Signal De-Drifting in Electrooculography Systems},
  year         = {2026},
  howpublished = {\url{https://pith.science/paper/G5KQNEWB}},
  note         = {Machine review of arXiv:2509.07416}
}
read the original abstract
Electrooculography (EOG) is widely used for gaze tracking in Human-Robot Collaboration (HRC). However, baseline drift caused by low-frequency noise significantly impacts the accuracy of EOG signals, creating challenges for further sensor fusion. This paper presents an Eye Movement Feature-Guided De-drift (FGD) method for mitigating drift artifacts in EOG signals. The proposed approach leverages active eye-movement feature recognition to reconstruct the feature-extracted EOG baseline and adaptively correct signal drift while preserving the morphological integrity of the EOG waveform. The FGD is evaluated using both simulation data and real-world data, achieving a significant reduction in mean error. The average error is reduced to 0.896{\deg} in simulation, representing a 36.29% decrease, and to 1.033{\deg} in real-world data, corresponding to a 26.53% reduction. Despite additional and unpredictable noise in real-world data, the proposed method consistently outperforms conventional de-drifting techniques, demonstrating its effectiveness in practical applications such as enhancing human performance augmentation.
Figures


Figures from the paper (4 more)


Reference graph
Works this paper leans on
-
[1]
How does perception affect safety: New metrics and strategy,
X. Zhang, J. Chong, and K. Youcef-Toumi, “How does perception affect safety: New metrics and strategy,” in2024 IEEE International Conference on Robotics and Automation (ICRA), 2024, pp. 13 411– 13 417
work page 2024
-
[2]
Enhanced Human-Robot Collaboration using Constrained Probabilistic Human-Motion Prediction
A. Kothari, T. Tohme, X. Zhang, and K. Youcef- Toumi, “Enhanced human-robot collaboration using constrained probabilistic human-motion prediction,” 2023. [Online]. Available: https://arxiv.org/abs/2310.03314
work page Pith review arXiv 2023
-
[3]
Human–robot collaboration: A survey,
A. BAUER, D. WOLLHERR, and M. BUSS, “Human–robot collaboration: A survey,”International Journal of Humanoid Robotics, vol. 05, no. 01, pp. 47–66, 2008. [Online]. Available: https://doi.org/10.1142/S0219843608001303
-
[4]
Relevance-driven deci- sion making for safer and more efficient human robot collaboration,
X. Zhang, D. Huang, and K. Youcef-Toumi, “Relevance-driven deci- sion making for safer and more efficient human robot collaboration,”
-
[5]
Relevance for Human Robot Collaboration
X.-T. Zhang, D.-C. Huang, and K. Youcef-Toumi, “Relevance for human robot collaboration,” 2024. [Online]. Available: https://arxiv.org/abs/2409.07753
work page Pith review arXiv 2024
-
[6]
X. Zhang, “thesis in the field of mechanical engineering: Relevance for human-robot collaboration: Definitions, systems, algorithms, and ap- plications,” Ph.D. dissertation, Massachusetts Institute of Technology, 2025
work page 2025
-
[7]
Eye gaze tracking techniques for interactive applications,
C. H. Morimoto and M. R. Mimica, “Eye gaze tracking techniques for interactive applications,”Computer Vision and Image Understanding, vol. 98, no. 1, pp. 4–24, 2005, special Issue on Eye Detection and Tracking. [Online]. Available: https://www.sciencedirect.com/science/article/pii/S1077314204001109
work page 2005
-
[8]
Bayesian Intention for Enhanced Human Robot Collaboration
V . Hernandez-Cruz, X. Zhang, and K. Youcef-Toumi, “Bayesian intention for enhanced human robot collaboration,” 2024. [Online]. Available: https://arxiv.org/abs/2410.00302
work page Pith review arXiv 2024
Show all 23 references
-
[9]
Eye-tracking capabilities of low-cost eog system,
O. V . Acu ˜na, P. Aqueveque, and E. J. Pino, “Eye-tracking capabilities of low-cost eog system,” in2014 36th annual international conference of the IEEE engineering in medicine and biology society. IEEE, 2014, pp. 610–613
2014
-
[10]
Recognition of reading activity from the saccadic samples of electrooculography data,
K. Huda, M. S. Hossain, and M. Ahmad, “Recognition of reading activity from the saccadic samples of electrooculography data,” in 2015 International Conference on Electrical & Electronic Engineering (ICEEE). IEEE, 2015, pp. 73–76
2015
-
[11]
Eog-based eye tracking protocol using baseline drift removal algorithm for long-term eye movement detection,
J. Ryu, M. Lee, and D.-H. Kim, “Eog-based eye tracking protocol using baseline drift removal algorithm for long-term eye movement detection,”Expert Systems with Applications, vol. 131, pp. 275–287, 2019
2019
-
[12]
Eye move- ment analysis for activity recognition using electrooculography,
A. Bulling, J. A. Ward, H. Gellersen, and G. Tr ¨oster, “Eye move- ment analysis for activity recognition using electrooculography,”IEEE transactions on pattern analysis and machine intelligence, vol. 33, no. 4, pp. 741–753, 2010
2010
-
[13]
Temod: Target- enabled model-based de-drifting of the eog signal baseline using a battery model of the eye,
N. Barbara, T. A. Camilleri, and K. P. Camilleri, “Temod: Target- enabled model-based de-drifting of the eog signal baseline using a battery model of the eye,” in2021 43rd Annual International Conference of the IEEE Engineering in Medicine & Biology Society (EMBC). IEEE, 2021,...
2021
-
[14]
Iris center corneal reflection method for gaze tracking using visible light,
J. Sigut and S.-A. Sidha, “Iris center corneal reflection method for gaze tracking using visible light,”IEEE Transactions on Biomedical Engineering, vol. 58, no. 2, pp. 411–419, 2011
2011
-
[15]
Head-free, remote eye-gaze detection system based on pupil-corneal reflection method with easy calibration using two stereo-calibrated video cameras,
Y . Ebisawa and K. Fukumoto, “Head-free, remote eye-gaze detection system based on pupil-corneal reflection method with easy calibration using two stereo-calibrated video cameras,”IEEE Transactions on Biomedical Engineering, vol. 60, no. 10, pp. 2952–2960, 2013
2013
-
[16]
Openface: an open source facial behavior analysis toolkit,
T. Baltru ˇsaitis, P. Robinson, and L.-P. Morency, “Openface: an open source facial behavior analysis toolkit,” in2016 IEEE winter confer- ence on applications of computer vision (WACV). IEEE, 2016, pp. 1–10
2016
-
[17]
Eth-xgaze: A large scale dataset for gaze estimation under extreme head pose and gaze variation,
X. Zhang, S. Park, T. Beeler, D. Bradley, S. Tang, and O. Hilliges, “Eth-xgaze: A large scale dataset for gaze estimation under extreme head pose and gaze variation,” inComputer Vision–ECCV 2020: 16th European Conference, Glasgow, UK, August 23–28, 2020, Proceed- ings, Part V ...
2020
-
[18]
Eye move- ment analysis for activity recognition using electrooculography,
A. Bulling, J. A. Ward, H. Gellersen, and G. Tr ¨oster, “Eye move- ment analysis for activity recognition using electrooculography,”IEEE Transactions on Pattern Analysis and Machine Intelligence, vol. 33, no. 4, pp. 741–753, 2011
2011
-
[19]
Iscev standard for clinical electro-oculography (eog) 2006,
M. Brown, M. Marmor, Vaegan, E. Zrenner, M. Brigell, and M. Bach, “Iscev standard for clinical electro-oculography (eog) 2006,”Docu- menta ophthalmologica, vol. 113, pp. 205–212, 2006
2006
-
[20]
A comparison of eog baseline drift mitigation techniques,
N. Barbara, T. A. Camilleri, and K. P. Camilleri, “A comparison of eog baseline drift mitigation techniques,”Biomedical Signal Processing and Control, vol. 57, p. 101738, 2020
2020
-
[21]
Direct gaze estimation based on nonlinearity of eog,
H. Manabe, M. Fukumoto, and T. Yagi, “Direct gaze estimation based on nonlinearity of eog,”IEEE Transactions on Biomedical Engineering, vol. 62, no. 6, pp. 1553–1562, 2015
2015
-
[22]
Algorithm for automatic analysis of electro- oculographic data,
K. Pettersson, S. Jagadeesan, K. Lukander, A. Henelius, E. Hæg- gstr¨om, and K. M ¨uller, “Algorithm for automatic analysis of electro- oculographic data,”Biomedical engineering online, vol. 12, pp. 1–18, 2013
2013
-
[2024]
Available: https://arxiv.org/abs/2409.13998
[Online]. Available: https://arxiv.org/abs/2409.13998
Reviewed August 4, 2026 · model on record in the stance chip above.
Discussion (0). Continue with ORCID to comment.