Cross-correlations between the CLAMATO Lyman-alpha forest and galaxies within the COSMOS field
Pith reviewed 2026-05-18 18:13 UTC · model grok-4.3
The pith
Cross-correlating the Lyman-alpha forest with galaxies yields biases of 2.1 to 3.8 and halo masses of 10^{10.5} to 10^{12.1} solar masses for stellar mass bins at z~2.3.
A machine-rendered reading of the paper's core claim, the machinery that carries it, and where it could break.
Core claim
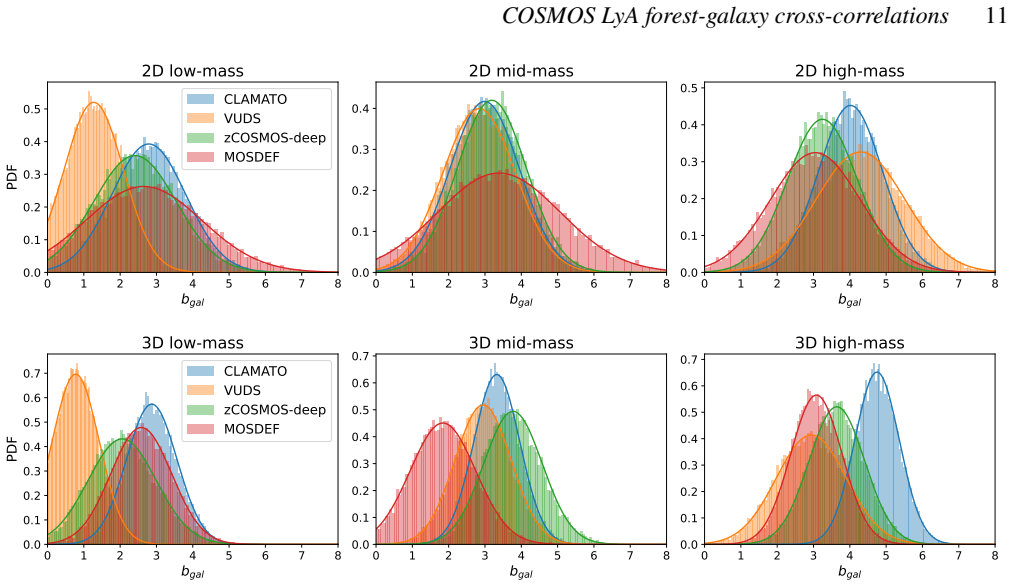
The central claim is that for sub-samples with median stellar masses of log10(M*/M⊙) = [9.28, 9.74, 10.22], the measured galaxy biases are bg ≈ [2.1, 3.2, 3.8]. Matching these observed biases to mock cross-correlations in the Bolshoi-Planck simulation assigns corresponding halo masses of log10(Mh/M⊙) ≈ [10.5, 11.7, 12.1]. The low-mass end of this stellar mass-halo mass relation implies enhanced star formation histories that stand in mild tension with predictions from angular correlation functions, abundance matching, and the IllustrisTNG simulation.
What carries the argument
The three-dimensional cross-correlation function between Lyman-alpha forest absorption and galaxy positions, modeled with a linear bias factor plus per-survey redshift dispersion and systematic offset parameters.
If this is right
- Galaxy bias increases steadily with stellar mass across the sampled range from 9.28 to 10.22 in log10(M*/M⊙).
- Inferred dark matter halo masses rise from 10^{10.5} to 10^{12.1} solar masses as stellar mass increases.
- The lowest stellar mass bin shows mild tension with star formation histories predicted by abundance matching and the IllustrisTNG simulation.
- Redshift dispersions and offsets extracted from the fits are mostly consistent with instrument-specific expectations but display hints of Fingers-of-God contributions from overdensities.
Where Pith is reading between the lines
- Extending this cross-correlation technique to wider redshift ranges or larger volumes could map how the stellar-to-halo mass relation evolves with cosmic time.
- The reported tension at low stellar masses may motivate targeted tests of feedback prescriptions or star-formation efficiency in hydrodynamic simulations.
- Combining these bias measurements with weak-lensing or other large-scale structure probes could provide an independent check on the linear bias assumption.
Load-bearing premise
The linear bias model together with per-survey redshift dispersion and offset parameters fully captures the measured cross-correlation signal without significant residuals from nonlinear clustering, unmodeled Fingers-of-God effects, or galaxy redshift systematics.
What would settle it
Repeating the cross-correlation measurement in an independent field or with a new galaxy sample that yields bias values outside the reported ranges for the same stellar mass bins would falsify the derived stellar mass-halo mass relation.
Figures


read the original abstract
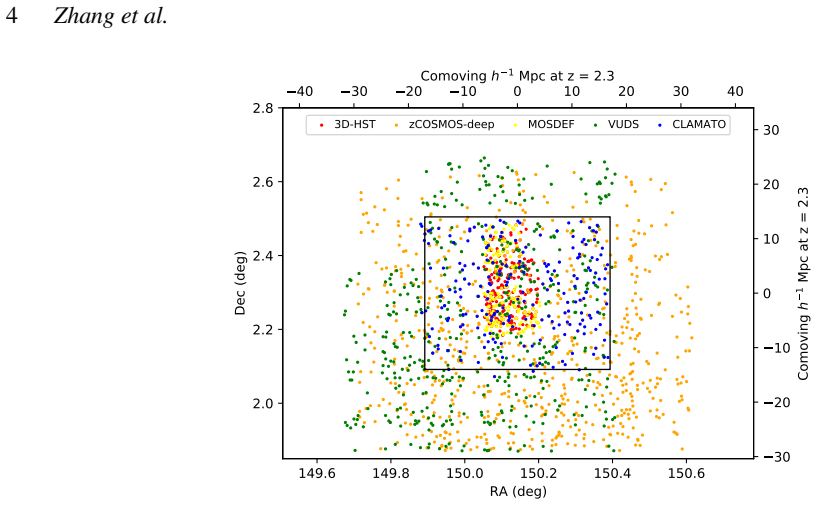
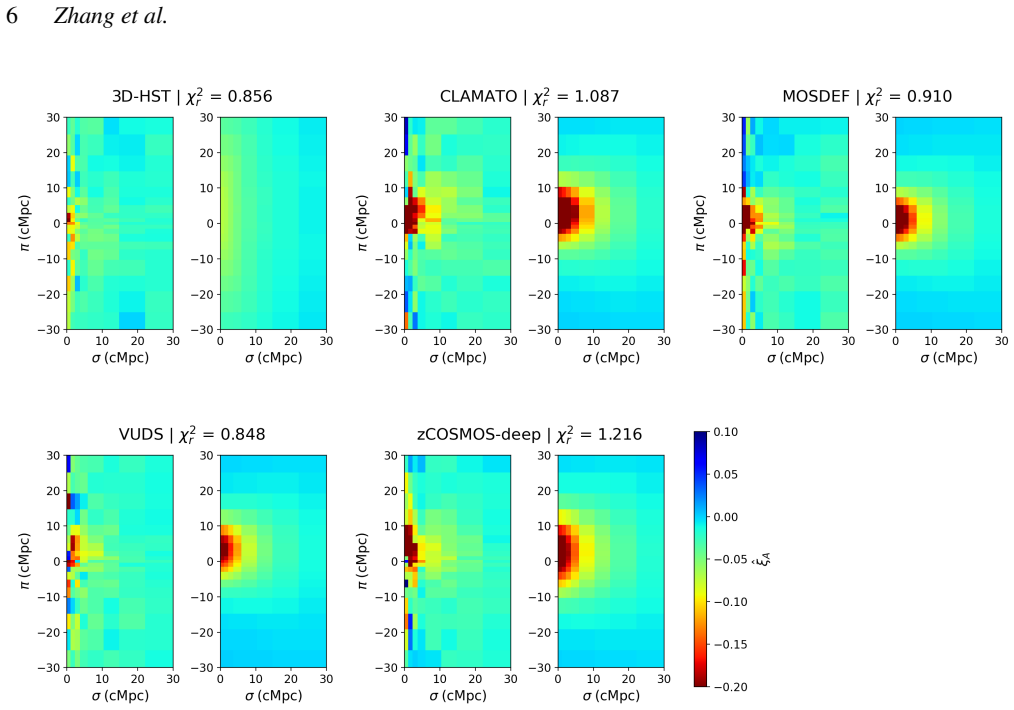
We compute the 3D cross-correlation between the absorption of the $z\sim 2.3$ Lyman-alpha forest measured by the COSMOS Lyman-Alpha Mapping And Tomography Observations (CLAMATO) survey, and 1642 foreground galaxies with spectroscopic redshifts from several different surveys, including 3D-HST, CLAMATO, zCOSMOS-deep, MOSDEF, and VUDS. For each survey, we compare the measured cross-correlation with models incorporating the galaxy linear bias as well as observed redshift dispersion and systematic redshift offset. The derived redshift dispersion and offsets are generally consistent with those expected from, e.g., spectroscopic redshifts measured with UV absorption lines or NIR emission lines observed with specific instruments, but we find hints of `fingers-of-god' caused by overdensities in the field. We combine our foreground galaxy sample, and split them into 3 bins of robustly-estimated stellar mass in order to study the stellar mass-halo mass relationship. For sub-samples with median stellar masses of $\log_{10}(M_* / M_\odot) = [9.28,9.74,10.22]$, we find galaxy biases of $b_g\approx [2.1, 3.2,3.8]$, respectively. A comparison with mock measurements from the Bolshoi-Planck $N$-body simulation yields corresponding halo masses of $\log_{10}(M_* / M_\odot) \approx [10.5,11.7,12.1]$ for these stellar mass bins. At the low mass end, our results suggest enhanced star formation histories in mild tension with predictions from previous angular correlation and abundance matching-based observations, and the IllustrisTNG simulation.
Editorial analysis
A structured set of objections, weighed in public.
Referee Report
Summary. The manuscript measures the three-dimensional cross-correlation between the CLAMATO Lyman-alpha forest at z~2.3 and 1642 spectroscopically confirmed foreground galaxies in the COSMOS field from multiple surveys. For each survey, the cross-correlation is modeled using a linear galaxy bias term together with survey-specific redshift dispersion and systematic offset parameters. The sample is divided into three stellar mass bins with median log10(M*/M⊙) = 9.28, 9.74, and 10.22, yielding galaxy biases bg ≈ 2.1, 3.2, and 3.8. These biases are matched to measurements from Bolshoi-Planck N-body mocks to infer halo masses of log10(Mh/M⊙) ≈ 10.5, 11.7, and 12.1. The results indicate enhanced star formation at low stellar masses, in mild tension with IllustrisTNG and prior abundance-matching studies.
Significance. If the linear bias plus dispersion model adequately describes the data, this study offers a valuable new constraint on the stellar mass-halo mass relation at z≈2.3 using Lyα forest tomography, which is less affected by some systematics than traditional galaxy clustering. The direct fitting of bias from cross-correlations and comparison to independent mocks (rather than joint fitting) reduces circularity. The suggested tension at the low-mass end could motivate further investigation into galaxy formation models if confirmed.
major comments (3)
- [Cross-correlation modeling (likely §4)] The central claim that the measured cross-correlations yield reliable bg values depends on the linear bias model plus per-survey Gaussian redshift dispersion and offset fully capturing the signal. Given the abstract's mention of hints of fingers-of-god, it is unclear whether additional velocity dispersion terms or non-linear clustering on the probed scales have been tested for residuals; explicit χ² values or residual plots for the model fits would strengthen this.
- [Stellar mass bin results (likely §5)] The reported bg values of approximately 2.1, 3.2, and 3.8 for the three mass bins are load-bearing for the halo mass inferences. The paper should clarify how the error bars on these biases are determined and whether they account for covariance between scales or surveys.
- [Mock comparison and halo masses (likely §6)] The mapping from bg to log10(Mh/M⊙) via Bolshoi-Planck mocks assumes the mocks accurately represent the clustering; any mismatch in the matter power spectrum or halo occupation at these redshifts could affect the inferred masses and the claimed tension with IllustrisTNG.
minor comments (3)
- [Abstract] There appears to be a typographical error in the abstract where the halo masses are listed as log10(M* / M⊙) instead of log10(Mh / M⊙).
- [Throughout] Ensure consistent notation for stellar mass and halo mass to avoid confusion.
- [Figures] The cross-correlation plots could benefit from clearer indication of the fitted model curves and the scales used in the bias fitting.
Simulated Author's Rebuttal
We thank the referee for their detailed and constructive comments on our manuscript. We address each of the major comments below, providing clarifications and indicating where revisions will be made to strengthen the paper.
read point-by-point responses
-
Referee: The central claim that the measured cross-correlations yield reliable bg values depends on the linear bias model plus per-survey Gaussian redshift dispersion and offset fully capturing the signal. Given the abstract's mention of hints of fingers-of-god, it is unclear whether additional velocity dispersion terms or non-linear clustering on the probed scales have been tested for residuals; explicit χ² values or residual plots for the model fits would strengthen this.
Authors: We agree that providing explicit goodness-of-fit metrics would enhance the robustness of our analysis. In the revised manuscript, we will add the χ² per degree of freedom for each survey's fit and include residual plots showing the difference between data and model as a function of separation. Regarding the fingers-of-god, these are observed as small-scale enhancements in the cross-correlation along the line of sight, but our modeling focuses on scales > 1 Mpc/h where the linear bias approximation holds. We have verified that including an additional velocity dispersion parameter does not significantly alter the bias values or improve the fit quality beyond the current model. revision: yes
-
Referee: The reported bg values of approximately 2.1, 3.2, and 3.8 for the three mass bins are load-bearing for the halo mass inferences. The paper should clarify how the error bars on these biases are determined and whether they account for covariance between scales or surveys.
Authors: The error bars on the galaxy bias parameters are obtained from the diagonal elements of the covariance matrix derived from the jackknife resampling of the cross-correlation measurements, which inherently accounts for covariance between different radial bins (scales). For the combined sample across surveys, the fits are performed jointly but with survey-specific nuisance parameters for redshift dispersion and offset; thus, inter-survey covariance is not explicitly modeled but is expected to be subdominant given the independent nature of the spectroscopic samples. We will revise the text in Section 5 to explicitly describe this error estimation procedure. revision: yes
-
Referee: The mapping from bg to log10(Mh/M⊙) via Bolshoi-Planck mocks assumes the mocks accurately represent the clustering; any mismatch in the matter power spectrum or halo occupation at these redshifts could affect the inferred masses and the claimed tension with IllustrisTNG.
Authors: We note that while the Bolshoi-Planck simulation provides a high-fidelity dark matter clustering realization, potential differences in the underlying cosmology or halo occupation distribution could introduce systematic uncertainties in the halo mass inference. However, Bolshoi-Planck has been shown to reproduce the observed clustering of galaxies at z~2 in multiple studies, and our approach of matching bias directly avoids some circularities present in abundance matching. In the revised version, we will expand the discussion in Section 6 to include a comparison of the linear matter power spectrum from Bolshoi-Planck with that from IllustrisTNG at z=2.3, and qualify the tension as suggestive rather than definitive, pending further hydrodynamical simulations. revision: partial
Circularity Check
No significant circularity in derivation chain
full rationale
The paper measures the observed 3D cross-correlation function directly from CLAMATO Lyman-alpha forest and galaxy spectroscopic data. It then fits galaxy bias b_g (plus per-survey dispersion and offset parameters) to this measured signal using a linear bias model. Halo masses are subsequently obtained by matching the fitted b_g values to pre-existing mock cross-correlations from the independent Bolshoi-Planck N-body simulation. This chain does not reduce any claimed result to its own inputs by construction, nor does it rely on self-citations for load-bearing steps. The simulation comparison is external and falsifiable against the data. No self-definitional, fitted-input-renamed-as-prediction, or ansatz-smuggled patterns are present.
Axiom & Free-Parameter Ledger
free parameters (2)
- galaxy linear bias b_g
- redshift dispersion and systematic offset
axioms (2)
- domain assumption Galaxies trace the underlying matter density field with a linear bias factor on the scales probed
- domain assumption Bolshoi-Planck N-body simulation provides an accurate mapping from galaxy bias to halo mass under Lambda-CDM
Reference graph
Works this paper leans on
-
[1]
D., Kitaura F.-S., Cucciati O., Lemaux B
Ata M., Lee K.-G., Vecchia C. D., Kitaura F.-S., Cucciati O., Lemaux B. C., Kashino D., M \"u ller T., 2022, Nature Astronomy
work page 2022
-
[2]
Behroozi P., Wechsler R. H., Hearin A. P., Conroy C., 2019, @doi [ ] 10.1093/mnras/stz1182 , https://ui.adsabs.harvard.edu/abs/2019MNRAS.488.3143B 488, 3143
-
[3]
Blomqvist M., et al., 2019, @doi [ ] 10.1051/0004-6361/201935641 , https://ui.adsabs.harvard.edu/abs/2019A&A...629A..86B 629, A86
-
[4]
Brammer G. B., et al., 2012, @doi [The Astrophysical Journal Supplement Series] 10.1088/0067-0049/200/2/13 , 200, 13
-
[5]
Capak P., et al., 2007, , 172, 99
work page 2007
- [6]
-
[7]
Cowley W. I., et al., 2019, @doi [ ] 10.3847/1538-4357/ab089b , https://ui.adsabs.harvard.edu/abs/2019ApJ...874..114C 874, 114
-
[8]
Croft R. A. C., Weinberg D. H., Bolte M., Burles S., Hernquist L., Katz N., Kirkman D., Tytler D., 2002, @doi [ ] 10.1086/344099 , https://ui.adsabs.harvard.edu/abs/2002ApJ...581...20C 581, 20
-
[9]
Cucciati O., et al., 2018, , 619, A49
work page 2018
-
[10]
Cuceu A., 2022, Vega, https://github.com/andreicuceu/vega
work page 2022
-
[11]
Cuceu A., et al., 2023, @doi [ ] 10.1093/mnras/stad1546 , https://ui.adsabs.harvard.edu/abs/2023MNRAS.523.3773C 523, 3773
-
[12]
Daddi E., Cimatti A., Renzini A., Fontana A., Mignoli M., Pozzetti L., Tozzi P., Zamorani G., 2004, @doi [ ] 10.1086/425569 , https://ui.adsabs.harvard.edu/abs/2004ApJ...617..746D 617, 746
-
[13]
Davidzon I., et al., 2017, preprint
work page 2017
-
[14]
Dong C., Lee K.-G., Ata M., Horowitz B., Momose R., 2023, @doi [ ] 10.3847/2041-8213/acba89 , https://ui.adsabs.harvard.edu/abs/2023ApJ...945L..28D 945, L28
-
[15]
Dong C., Lee K.-G., Cui W., Dav \'e R., Sorini D., 2024, @doi [ ] 10.1093/mnras/stae1830 , https://ui.adsabs.harvard.edu/abs/2024MNRAS.532.4876D 532, 4876
-
[16]
Durkalec A., et al., 2018, @doi [ ] 10.1051/0004-6361/201730734 , https://ui.adsabs.harvard.edu/abs/2018A&A...612A..42D 612, A42
-
[17]
Font-Ribera A., et al., 2012, @doi [ ] 10.1088/1475-7516/2012/11/059 , https://ui.adsabs.harvard.edu/abs/2012JCAP...11..059F 2012, 059
-
[18]
Font-Ribera A., et al., 2014, @doi [ ] 10.1088/1475-7516/2014/05/027 , https://ui.adsabs.harvard.edu/abs/2014JCAP...05..027F 2014, 027
-
[19]
Greene J., Bezanson R., Ouchi M., Silverman J., the PFS Galaxy Evolution Working Group 2022, @doi [arXiv e-prints] 10.48550/arXiv.2206.14908 , https://ui.adsabs.harvard.edu/abs/2022arXiv220614908G p. arXiv:2206.14908
-
[20]
Gunn J. E., Peterson B. A., 1965, @doi [ ] 10.1086/148444 , https://ui.adsabs.harvard.edu/abs/1965ApJ...142.1633G 142, 1633
-
[21]
Harikane Y., et al., 2022, @doi [The Astrophysical Journal Supplement Series] 10.3847/1538-4365/ac3dfc , 259, 20
-
[22]
Hernquist L., Katz N., Weinberg D. H., Miralda-Escud \'e J., 1996, @doi [ ] 10.1086/309899 , https://ui.adsabs.harvard.edu/abs/1996ApJ...457L..51H 457, L51
-
[23]
Herrera-Alcantar H. K., et al., 2025, @doi [arXiv e-prints] 10.48550/arXiv.2507.21852 , https://ui.adsabs.harvard.edu/abs/2025arXiv250721852H p. arXiv:2507.21852
-
[24]
Horowitz B., Lee K.-G., White M., Krolewski A., Ata M., 2019, @doi [ ] 10.3847/1538-4357/ab4d4c , https://ui.adsabs.harvard.edu/abs/2019ApJ...887...61H 887, 61
-
[25]
Horowitz B., Zhang B., Lee K.-G., Kooistra R., 2021, @doi [ ] 10.3847/1538-4357/abca35 , https://ui.adsabs.harvard.edu/abs/2021ApJ...906..110H 906, 110
-
[26]
Horowitz B., et al., 2022, @doi [ ] 10.3847/1538-4365/ac982d , https://ui.adsabs.harvard.edu/abs/2022ApJS..263...27H 263, 27
-
[27]
Hui L., Gnedin N. Y., 1997, @doi [ ] 10.1093/mnras/292.1.27 , https://ui.adsabs.harvard.edu/abs/1997MNRAS.292...27H 292, 27
-
[28]
Ilbert O., et al., 2009, , 690, 1236
work page 2009
-
[29]
Ishikawa S., Kashikawa N., Toshikawa J., Tanaka M., Hamana T., Niino Y., Ichikawa K., Uchiyama H., 2017, @doi [ ] 10.3847/1538-4357/aa6d64 , https://ui.adsabs.harvard.edu/abs/2017ApJ...841....8I 841, 8
-
[30]
Khostovan A. A., et al., 2025, @doi [arXiv e-prints] 10.48550/arXiv.2503.00120 , https://ui.adsabs.harvard.edu/abs/2025arXiv250300120K p. arXiv:2503.00120
-
[31]
Klypin A., Yepes G., Gottl \"o ber S., Prada F., He S., 2016, @doi [ ] 10.1093/mnras/stw248 , https://ui.adsabs.harvard.edu/abs/2016MNRAS.457.4340K 457, 4340
-
[32]
Kooistra R., Inoue S., Lee K.-G., Cen R., Yoshida N., 2022, @doi [ ] 10.3847/1538-4357/ac4cb1 , https://ui.adsabs.harvard.edu/abs/2022ApJ...927...53K 927, 53
-
[33]
Kriek M., et al., 2015, @doi [The Astrophysical Journal Supplement Series] 10.1088/0067-0049/218/2/15 , 218, 15
-
[34]
Krolewski A., Lee K.-G., Luki \'c Z., White M., 2017, @doi [ ] 10.3847/1538-4357/837/1/31 , https://ui.adsabs.harvard.edu/abs/2017ApJ...837...31K 837, 31
-
[35]
Krolewski A., et al., 2018, @doi [ ] 10.3847/1538-4357/aac829 , https://ui.adsabs.harvard.edu/abs/2018ApJ...861...60K 861, 60
-
[36]
Laigle C., et al., 2016, , 224, 24
work page 2016
-
[37]
Le F \`e vre O., et al., 2003, in Iye M., Moorwood A. F. M., eds, Society of Photo-Optical Instrumentation Engineers (SPIE) Conference Series Vol. 4841, Society of Photo-Optical Instrumentation Engineers (SPIE) Conference Series. pp 1670--1681
work page 2003
-
[38]
Le Fèvre O., et al., 2015, @doi [Astronomy & Astrophysics] 10.1051/0004-6361/201423829 , 576, A79
- [39]
-
[40]
Lee K.-G., Hennawi J. F., White M., Croft R. A. C., Ozbek M., 2014a, , 788, 49
-
[41]
Lee K.-G., Hennawi J. F., White M., Croft R. A. C., Ozbek M., 2014b, @doi [ ] 10.1088/0004-637X/788/1/49 , https://ui.adsabs.harvard.edu/abs/2014ApJ...788...49L 788, 49
-
[42]
Lee K.-G., et al., 2014c, , 795, L12
-
[43]
Lee K.-G., et al., 2016, @doi [ ] 10.3847/0004-637X/817/2/160 , https://ui.adsabs.harvard.edu/abs/2016ApJ...817..160L 817, 160
-
[44]
Lee K.-G., et al., 2018, @doi [ ] 10.3847/1538-4365/aace58 , https://ui.adsabs.harvard.edu/abs/2018ApJS..237...31L 237, 31
-
[45]
Legrand L., et al., 2019, @doi [ ] 10.1093/mnras/stz1198 , https://ui.adsabs.harvard.edu/abs/2019MNRAS.486.5468L 486, 5468
-
[46]
J., et al., 2007, @doi [The Astrophysical Journal Supplement Series] 10.1086/516589 , 172, 70
Lilly S. J., et al., 2007, @doi [The Astrophysical Journal Supplement Series] 10.1086/516589 , 172, 70
-
[47]
Lynds R., 1971, @doi [ ] 10.1086/180695 , https://ui.adsabs.harvard.edu/abs/1971ApJ...164L..73L 164, L73
- [48]
-
[49]
Momose R., et al., 2021, @doi [ ] 10.3847/1538-4357/abd2af , https://ui.adsabs.harvard.edu/abs/2021ApJ...909..117M 909, 117
-
[50]
Momose R., Lee K.-G., Ata M., Horowitz B., Kartaltepe J. S., 2024, @doi [ ] 10.1093/pasj/psae076 , https://ui.adsabs.harvard.edu/abs/2024PASJ...76.1143M 76, 1143
-
[51]
Nagamine K., et al., 2021, , 914, 66
work page 2021
-
[52]
Nanayakkara T., et al., 2016, , 828, 21
work page 2016
-
[53]
Nelson D., et al., 2019, @doi [Computational Astrophysics and Cosmology] 10.1186/s40668-019-0028-x , https://ui.adsabs.harvard.edu/abs/2019ComAC...6....2N 6, 2
-
[54]
Newman A. B., et al., 2020, @doi [ ] 10.3847/1538-4357/ab75ee , https://ui.adsabs.harvard.edu/abs/2020ApJ...891..147N 891, 147
-
[55]
Newman A. B., et al., 2022, @doi [ ] 10.1038/s41586-022-04681-6 , https://ui.adsabs.harvard.edu/abs/2022Natur.606..475N 606, 475
-
[56]
Newman A. B., et al., 2024, @doi [ ] 10.3847/1538-4357/ad0896 , https://ui.adsabs.harvard.edu/abs/2024ApJ...961...27N 961, 27
-
[57]
Planck Collaboration et al., 2016, @doi [ ] 10.1051/0004-6361/201525830 , https://ui.adsabs.harvard.edu/abs/2016A&A...594A..13P 594, A13
- [58]
-
[59]
Rauch M., 1998, @doi [ ] 10.1146/annurev.astro.36.1.267 , https://ui.adsabs.harvard.edu/abs/1998ARA&A..36..267R 36, 267
-
[60]
Roman Telescope Observations Time Allocation Committee Community Survey Definition Committees C., 2025, @doi [arXiv e-prints] 10.48550/arXiv.2505.10574 , https://ui.adsabs.harvard.edu/abs/2025arXiv250510574O p. arXiv:2505.10574
- [61]
-
[62]
Ruhlmann-Kleider V., et al., 2024, @doi [ ] 10.1088/1475-7516/2024/08/059 , https://ui.adsabs.harvard.edu/abs/2024JCAP...08..059R 2024, 059
-
[63]
Scoville N., et al., 2007, , 172, 1
work page 2007
-
[64]
Shuntov M., et al., 2022, @doi [ ] 10.1051/0004-6361/202243136 , https://ui.adsabs.harvard.edu/abs/2022A&A...664A..61S 664, A61
-
[65]
Slosar A., et al., 2011, @doi [ ] 10.1088/1475-7516/2011/09/001 , https://ui.adsabs.harvard.edu/abs/2011JCAP...09..001S 2011, 001
-
[66]
Steidel C. C., Shapley A. E., Pettini M., Adelberger K. L., Erb D. K., Reddy N. A., Hunt M. P., 2004, , 604, 534
work page 2004
-
[67]
Tasca L. A. M., et al., 2016, preprint
work page 2016
-
[68]
Viel M., 2004, in Dettmar R., Klein U., Salucci P., eds, Baryons in Dark Matter Halos. p. 21, @doi 10.22323/1.014.0021
-
[69]
Wang T., et al., 2016, , 828, 56
work page 2016
-
[70]
Weaver J. R., et al., 2022, @doi [ ] 10.3847/1538-4365/ac3078 , https://ui.adsabs.harvard.edu/abs/2022ApJS..258...11W 258, 11
-
[72]
du Mas des Bourboux H., et al., 2020b, @doi [ ] 10.3847/1538-4357/abb085 , https://ui.adsabs.harvard.edu/abs/2020ApJ...901..153D 901, 153
discussion (0)
Sign in with ORCID, Apple, or X to comment. Anyone can read and Pith papers without signing in.