Analysis and Control of Acoustic Emissions from Marine Energy Converters
Pith reviewed 2026-05-18 17:47 UTC · model grok-4.3
The pith
Direct-drive permanent magnet synchronous generators eliminate mechanical tonal noise in tidal current converters, while de-tuning the maximum power point tracking coefficient by a factor of 1.2 reduces marine mammal temporary threshold-shi
A machine-rendered reading of the paper's core claim, the machinery that carries it, and where it could break.
Core claim
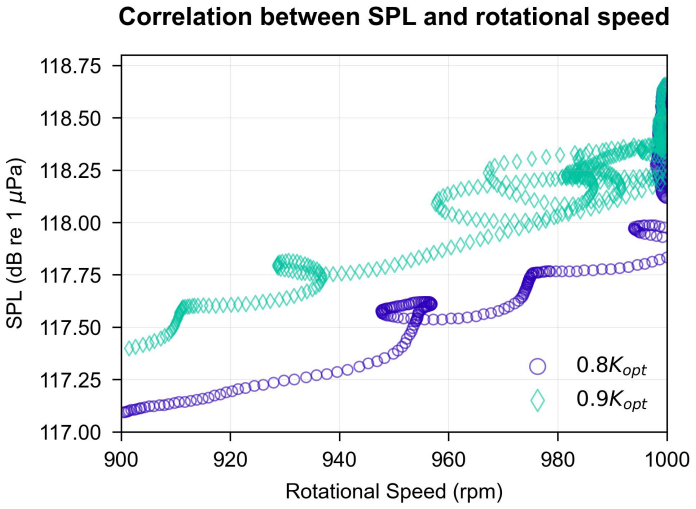
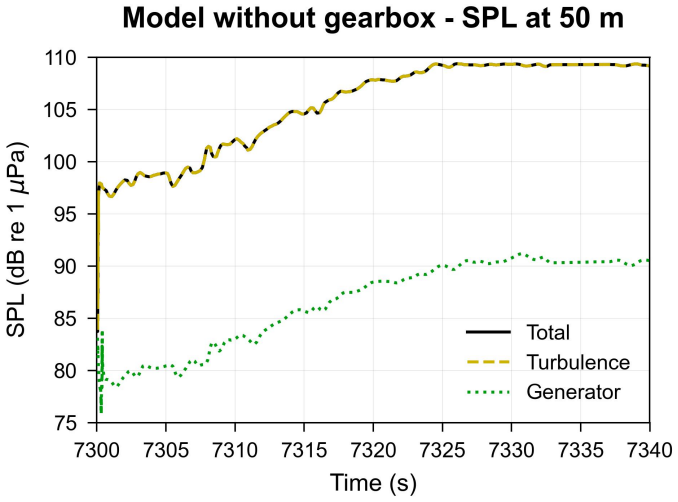
The direct-drive permanent magnet synchronous generator architecture reduces sound pressure levels and effectively eliminates mechanical tonal noise. For existing geared systems, de-tuning the maximum power point tracking coefficient by a factor of 1.2 reduces the probability of exceeding temporary threshold shift limits for marine mammals, with a quantified energy yield reduction of 3.58 percent. Lowering switching frequencies increases power electronic losses by over 2000 percent with negligible acoustic benefit.
What carries the argument
The MATLAB/Simulink model of a tidal current converter used to simulate and compare acoustic emissions across generator architectures and control settings.
If this is right
- Direct-drive permanent magnet synchronous generator topologies should be selected for acoustically sensitive deployment sites.
- Maximum power point tracking coefficient de-tuning can serve as a transient operational mode during critical biological migration periods.
- Switching frequency reduction is not a viable mitigation option because it produces large increases in power losses with no meaningful acoustic improvement.
Where Pith is reading between the lines
- Real-sea validation of the simulation results would be needed to confirm whether the modeled noise reductions translate to actual deployment conditions.
- The same hierarchical mitigation logic could be tested on wave energy converters or other marine renewable devices that produce similar tonal noise.
- Coupling the control strategy with real-time acoustic or animal-presence sensors might allow dynamic activation of the de-tuning mode only when marine mammals are nearby.
Load-bearing premise
The MATLAB/Simulink model accurately represents real-world acoustic emissions, sound propagation underwater, and the hearing thresholds of marine mammals without significant unmodeled effects.
What would settle it
Direct field measurements of sound pressure levels and tonal components from an operating direct-drive permanent magnet synchronous generator tidal converter compared with a geared induction generator unit under matched current conditions.
Figures


read the original abstract
Environmental licensing related to underwater acoustic emissions represents a critical bottleneck for the commercial deployment of marine renewable energy. This study presents a control engineering framework to mitigate acoustic risks from tidal current converters without compromising project viability. A MATLAB/Simulink model of a tidal current converter was utilised to evaluate two distinct mitigation tiers: (1) architectural modification, comparing a geared induction generator against a direct-drive permanent magnet synchronous generator, and (2) operational control, analysing the impact of switching frequencies and maximum power point tracking coefficient tuning. Results indicate that lowering switching frequencies is ineffective, increasing power electronic losses by over 2000% with negligible acoustic benefit. Conversely, the direct-drive permanent magnet synchronous generator architecture reduced sound pressure levels, effectively eliminating mechanical tonal noise. For existing geared systems, de-tuning the maximum power point tracking coefficient by a factor of 1.2 reduced the probability of exceeding temporary threshold shift limits for marine mammals, with a quantified energy yield reduction of 3.58%. These findings propose a hierarchical mitigation strategy: selecting direct-drive topologies for acoustically sensitive sites, and utilising maximum power point tracking coefficient based power curtailment as a transient operational mode during critical biological migration periods.
Editorial analysis
A structured set of objections, weighed in public.
Referee Report
Summary. The manuscript presents a MATLAB/Simulink-based control engineering study of acoustic emissions from tidal current converters. It evaluates two mitigation approaches: (1) replacing a geared induction generator with a direct-drive permanent-magnet synchronous generator (PMSG) to eliminate mechanical tonal noise, and (2) detuning the maximum-power-point-tracking (MPPT) coefficient by a factor of 1.2 in existing geared systems, which the simulations indicate reduces the probability of exceeding marine-mammal temporary threshold shift (TTS) limits at the cost of a 3.58 % energy-yield reduction. The authors conclude with a hierarchical strategy that recommends direct-drive topologies for sensitive sites and MPPT detuning as a transient operational mode.
Significance. If the simulation fidelity is later confirmed, the work supplies concrete, quantitative guidance on acoustic-risk mitigation that directly addresses a documented permitting bottleneck for marine renewable energy. The explicit energy-penalty figure (3.58 %) and the comparison of architectural versus operational controls constitute a practical contribution to the systems-and-control literature on sustainable energy devices.
major comments (2)
- [Model-validation section (likely §2 or §3)] Model-validation section (likely §2 or §3): the quantitative claims—noise elimination by the direct-drive PMSG and the 3.58 % energy loss with 1.2× MPPT detuning—rest entirely on unvalidated simulation outputs. No calibration against measured sound-pressure-level data from deployed turbines, tank tests, or field recordings is reported, nor is any sensitivity analysis to unmodeled effects such as site-specific bathymetry or nonlinear bubble noise provided. This directly undermines confidence in the central numerical results.
- [Results section (acoustic and TTS analysis)] Results section (acoustic and TTS analysis): the reported reduction in exceedance probability for TTS limits is presented without error bars, confidence intervals, or Monte-Carlo variation over uncertain propagation parameters. Because the TTS threshold and propagation-loss models are themselves taken from external literature, the robustness of the 1.2 detuning factor as an operating point cannot be assessed from the given evidence.
minor comments (2)
- [Abstract and Introduction] The abstract and introduction use the term “sound pressure levels” without specifying the reference pressure or frequency weighting; a brief clarification would improve readability.
- [Figures] Figure captions should explicitly state whether the plotted spectra are narrow-band or one-third-octave and whether they represent instantaneous or time-averaged quantities.
Simulated Author's Rebuttal
We thank the referee for the positive assessment of the significance of our work and for the constructive major comments. We address each point below, indicating planned revisions to strengthen the manuscript.
read point-by-point responses
-
Referee: Model-validation section (likely §2 or §3): the quantitative claims—noise elimination by the direct-drive PMSG and the 3.58 % energy loss with 1.2× MPPT detuning—rest entirely on unvalidated simulation outputs. No calibration against measured sound-pressure-level data from deployed turbines, tank tests, or field recordings is reported, nor is any sensitivity analysis to unmodeled effects such as site-specific bathymetry or nonlinear bubble noise provided. This directly undermines confidence in the central numerical results.
Authors: We concur that empirical validation of the simulation model against field or tank measurements would strengthen the quantitative claims. As this is a modeling and control study, the current work relies on physics-based models parameterized from literature. In the revised version, we will add a new subsection on model assumptions and limitations, and conduct a sensitivity analysis with respect to key uncertain parameters including bathymetry effects and bubble noise contributions. We will also clarify that full calibration is planned as future experimental work. revision: partial
-
Referee: Results section (acoustic and TTS analysis): the reported reduction in exceedance probability for TTS limits is presented without error bars, confidence intervals, or Monte-Carlo variation over uncertain propagation parameters. Because the TTS threshold and propagation-loss models are themselves taken from external literature, the robustness of the 1.2 detuning factor as an operating point cannot be assessed from the given evidence.
Authors: We agree that the lack of uncertainty quantification makes it difficult to assess the robustness of the reported 3.58% energy loss and the TTS exceedance reduction. We will revise the results section to include Monte Carlo simulations varying the propagation loss and TTS threshold parameters within literature-reported ranges, and will add error bars or 95% confidence intervals to the probability estimates in the figures and text. revision: yes
Circularity Check
No significant circularity; claims are direct simulation outputs
full rationale
The paper's central results—the SPL reduction from direct-drive PMSM architecture and the 3.58% energy-loss trade-off from 1.2× MPPT detuning—arise from comparative runs of a MATLAB/Simulink model. These quantities are generated as model outputs under different configurations rather than being fitted to a target acoustic metric or defined in terms of themselves. No self-citations, uniqueness theorems, or ansatzes appear as load-bearing steps in the derivation chain. The analysis remains self-contained as an evaluation of model behavior against external benchmarks of acoustic risk.
Axiom & Free-Parameter Ledger
free parameters (1)
- MPPT detuning factor =
1.2
axioms (1)
- domain assumption The simulation model accurately captures acoustic emissions from generator components and their underwater propagation.
Lean theorems connected to this paper
-
IndisputableMonolith/Foundation/RealityFromDistinction.leanreality_from_one_distinction unclear?
unclearRelation between the paper passage and the cited Recognition theorem.
A MATLAB/Simulink model of a tidal current converter was utilised to evaluate two distinct mitigation tiers: (1) architectural modification, comparing a geared induction generator against a direct-drive permanent magnet synchronous generator, and (2) operational control, analysing the impact of switching frequencies and maximum power point tracking coefficient (K opt) tuning.
-
IndisputableMonolith/Cost/FunctionalEquation.leanwashburn_uniqueness_aczel unclear?
unclearRelation between the paper passage and the cited Recognition theorem.
de-tuning the maximum power point tracking coefficient by a factor of 1.2 reduced the probability of exceeding temporary threshold shift limits
What do these tags mean?
- matches
- The paper's claim is directly supported by a theorem in the formal canon.
- supports
- The theorem supports part of the paper's argument, but the paper may add assumptions or extra steps.
- extends
- The paper goes beyond the formal theorem; the theorem is a base layer rather than the whole result.
- uses
- The paper appears to rely on the theorem as machinery.
- contradicts
- The paper's claim conflicts with a theorem or certificate in the canon.
- unclear
- Pith found a possible connection, but the passage is too broad, indirect, or ambiguous to say the theorem truly supports the claim.
Reference graph
Works this paper leans on
-
[1]
International Energy Outlook 2016,
Conti J, Holtberg P, Diefenderfer Jet al, “International Energy Outlook 2016,” USDOE Energy Information Administration (EIA), Washington, DC (United States), Tech. Rep., 2016, https: //doi.org/10.2172/1296780
-
[2]
Turning the Tide: Tidal Power in the UK,
Sustainable Development Commission, “Turning the Tide: Tidal Power in the UK,” Tech. Rep., 2007, https://www.sd-commission.org.uk/publications.php@id=607.html (20 November 2025, date last accessed). [Online]. Available: https://www.sd-commission.org.uk/publications.php@ id=607.html
work page 2007
-
[3]
Exceeding the Betz Limit with Tidal Turbines,
Vennell R, “Exceeding the Betz Limit with Tidal Turbines,”Renewable Energy, vol.55, pp. 277–285, 2013, https://doi.org/10.1016/j.renene.2012.12.016
-
[4]
Clarke AW, Trinnaman JA, “Survey of Energy Resources,” World Energy Council, Tech. Rep., 2010, https://www.worldenergy.org/publications/entry/world-energy-resources-2010-survey (20 November 2025, date last accessed). [Online]. Available: https://www.worldenergy.org/ publications/entry/world-energy-resources-2010-survey
work page 2010
-
[5]
Acoustic Noise Measurement Methodology for the Billia Croo Wave Energy Test Site,
Lepper P, Harland E, Robinson Set al, “Acoustic Noise Measurement Methodology for the Billia Croo Wave Energy Test Site,” The European Marine Energy Centre Ltd., Tech. Rep., 2012, https://www.emec.org.uk/?wpfb dl=66 (20 November 2025, date last accessed). [Online]. Available: https://www.emec.org.uk/?wpfb dl=66
work page 2012
-
[6]
Ocean Energy Development in Europe: Current Status and Future Perspectives,
Magagna D, Uihlein A, “Ocean Energy Development in Europe: Current Status and Future Perspectives,”International Journal of Marine Energy, vol.11, pp. 84–104, 2015, https://doi. org/10.1016/j.ijome.2015.05.001
-
[7]
Potential Environmental Effects of Marine Re- newable Energy Development — The State of the Science,
Copping AE, Hemery LG, Overhus DMet al, “Potential Environmental Effects of Marine Re- newable Energy Development — The State of the Science,”Journal of Marine Science and Engineering, vol.8, no. 11, 2020, https://doi.org/10.3390/jmse8110879
-
[8]
Noise in the Sea and Its Impacts on Marine Organisms,
Peng C, Zhao XG, Liu GX, “Noise in the Sea and Its Impacts on Marine Organisms,”International Journal of Environmental Research and Public Health, vol.12, no. 10, pp. 12 304–12 323, 2015, https://doi.org/10.3390/ijerph121012304
-
[9]
A hybrid model of tumor growth and angiogenesis: In silico experiments
Tougaard J, “Underwater Noise from a Wave Energy Converter is Unlikely to Affect Marine Mammals,”PLOS ONE, vol.10, no. 7, p. e0132391, 2015, https://doi.org/10.1371/journal.pone. 0132391
-
[10]
The Use of Acoustic Devices to Warn Ma- rine Mammals of Tidal-Stream Energy Devices,
Wilson B, Carter C, “The Use of Acoustic Devices to Warn Ma- rine Mammals of Tidal-Stream Energy Devices,” Scottish Association for Marine Science (SAMS), Tech. Rep., 2013, https://www.gov.scot/publications/ use-acoustic-devices-warn-marine-mammals-tidal-stream-energy-devices/ (20 November 2025, date last accessed). [Online]. Available: https://www.gov.sc...
work page 2013
-
[11]
SeaGen Environmental Monitoring Programme: Final Report,
Keenan G, Sparling C, Williams Het al, “SeaGen Environmental Monitoring Programme: Final Report,” Royal Haskoning, Tech. Rep., 2011, https://tethys. pnnl.gov/publications/seagen-environmental-monitoring-programme-final-report (20 Novem- ber 2025, date last accessed). [Online]. Available: https://tethys.pnnl.gov/publications/ seagen-environmental-monitorin...
work page 2011
-
[12]
Noise Modelling of Tidal Turbine Arrays for Environmental Impact Assessment,
Lloyd TP, Humphrey VF, Turnock SR, “Noise Modelling of Tidal Turbine Arrays for Environmental Impact Assessment,” inProceedings of the 9th European Wave and Tidal Energy Conference, Southampton, United Kingdom, 2011, https://eprints.soton.ac.uk/192959/ (20 November 2025, date last accessed). [Online]. Available: https://eprints.soton.ac.uk/192959/ 14
work page 2011
-
[13]
Wang D, Atlar M, Sampson R, “An Experimental Investigation on Cavitation, Noise, and Slip- stream Characteristics of Ocean Stream Turbines,”Proceedings of the Institution of Mechan- ical Engineers, Part A: Journal of Power and Energy, vol.221, no. 2, pp. 219–231, 2007, https://doi.org/10.1243/09576509JPE310
-
[14]
Richards SD, Harland EJ, Jones SAS, “Underwater noise study supporting scottish executive strategic environmental assessment for marine renewables,” Qinetiq, Tech. Rep., 2007, https://eprints.soton.ac.uk/65375/ (20 November 2025, date last accessed). [Online]. Available: https://eprints.soton.ac.uk/65375/
work page 2007
-
[15]
Fundamentals Applicable to the Utilisation of Marine Current Turbines for Energy Production,
Bahaj AS, Myers LE, “Fundamentals Applicable to the Utilisation of Marine Current Turbines for Energy Production,”Renewable Energy, vol.28, no. 14, pp. 2205–2211, 2003, https://doi. org/10.1016/S0960-1481(03)00103-4
-
[16]
Sousounis MC, Shek KH, Mueller MA, “Modelling, Control and Frequency Domain Analysis of a Tidal Current Conversion System with Onshore Converters,”IET Renewable Power Generation, vol.10, no. 2, pp. 158–165, 2016, https://doi.org/10.1049/iet-rpg.2014.0331
-
[17]
The Habitat Preferences of Marine Mammals West of Scotland (UK),
MacLeod CD, Weir CR, Pierpoint Cet al, “The Habitat Preferences of Marine Mammals West of Scotland (UK),”Journal of the Marine Biological Association of the United Kingdom, vol.87, no. 1, pp. 157–164, 2007, https://doi.org/10.1017/S0025315407055270
-
[18]
Field Studies of Hearing in Teleost Fish,
Chapman CJ, “Field Studies of Hearing in Teleost Fish,”Helgol¨ ander Wissenschaftliche Meere- suntersuchungen, vol.24, no. 1, pp. 371–390, 1973, https://doi.org/10.1007/BF01609527
-
[19]
Low-Frequency Underwater Hearing Sensitivity in Bel- ugas, Delphinapterus-Leucas,
Awbrey FT, Thomas JA, Kastelein RA, “Low-Frequency Underwater Hearing Sensitivity in Bel- ugas, Delphinapterus-Leucas,”The Journal of the Acoustical Society of America, vol.84, no. 6, pp. 2273–2275, 1988, https://doi.org/10.1121/1.397022
-
[20]
Audiogram of a Striped Dolphin (Stenella Coeruleoalba),
Kastelein RA, Hagedoorn M, Au WWL et al, “Audiogram of a Striped Dolphin (Stenella Coeruleoalba),”The Journal of the Acoustical Society of America, vol.113, no. 2, pp. 1130– 1137, 2003, https://doi.org/10.1121/1.1532310
-
[21]
Kastelein RA, Wensveen P, Hoek L et al, “Underwater Hearing Sensitivity of Harbor Seals (Phoca Vitulina) for Narrow Noise Bands Between 0.2 and 80 kHz,”The Journal of the Acoustical Society of America, vol.126, no. 1, pp. 476–483, 2009, https://doi.org/10.1121/1.3132522
-
[22]
Kastelein RA, Hoek L, de Jong CAFet al, “The Effect of Signal Duration on the Underwater De- tection Thresholds of a Harbour Porpoise (Phocoena Phocoena) for Single Frequency-Modulated Tonal Signals between 0.25 and 160 kHz,”The Journal of the Acoustical Society of America, vol. 128, no. 5, pp. 3211–3222, 2010, https://doi.org/10.1121/1.3493435
-
[23]
Killer Whale (Orcinus Orca) Hearing: Auditory Brain- stem Response and Behavioral Audiograms,
Szymanski MD, Bain DE, Kiehl K et al, “Killer Whale (Orcinus Orca) Hearing: Auditory Brain- stem Response and Behavioral Audiograms,”The Journal of the Acoustical Society of America, vol.106, no. 2, pp. 1134–1141, 1999, https://doi.org/10.1121/1.427121
-
[24]
Shipboard Measurements of the Hearing of the White-Beaked Dolphin Lagenorhynchus Albirostris,
Nachtigall PE, Mooney TA, Taylor KA et al, “Shipboard Measurements of the Hearing of the White-Beaked Dolphin Lagenorhynchus Albirostris,”Journal of Experimental Biology, vol.211, no. 4, pp. 642–647, 2008, https://doi.org/10.1242/jeb.014118
-
[25]
The Environmental Impact of Underwa- ter Sound,
Heathershaw, AD, Ward PD, David AM, “The Environmental Impact of Underwa- ter Sound,”Proceedings - Institute of Acoustics, vol.23, no. 4, pp. 1–12, 2001, https://www.ioa.org.uk/system/files/proceedings (20 November 2025, date last accessed). [Online]. Available: https://www.ioa.org.uk/system/files/proceedings/ad heathershaw pd ward sas jones r rogers unde...
work page 2001
-
[26]
Modelling Techniques for Underwater Noise Generated by Tidal Turbines in Shallow Waters,
Lloyd TP, Turnock SR, Humphrey VF, “Modelling Techniques for Underwater Noise Generated by Tidal Turbines in Shallow Waters,” inInternational Conference on Offshore Mechanics and Arctic Engineering, vol.44373, 2011, pp. 777–785, https://doi.org/10.1115/OMAE2011-49994. 15
-
[27]
Aero-Hydroacoustics for Ships, Technical Report No. ADA150673,
Blake WK, “Aero-Hydroacoustics for Ships, Technical Report No. ADA150673,” David W. Taylor Naval Ship Research and Development Center, Tech. Rep., 1984, https: //apps.dtic.mil/sti/citations/ADA150673 (20 November 2025, date last accessed). [Online]. Available: https://apps.dtic.mil/sti/citations/ADA150673
work page 1984
-
[28]
Wiley Online Library, 2007, ch
Bruce RD, Moritz CT, Bommer AS,Sound Power Level Predictions for Industrial Machinery. Wiley Online Library, 2007, ch. 82, pp. 1001–1009, https://doi.org/10.1002/9780470209707.ch82
-
[29]
Haikonen K, Sundberg J, Leijon M, “Characteristics of the Operational Noise from Full Scale Wave Energy Converters in the Lysekil Project: Estimation of Potential Environmental Impacts,” Energies, vol.6, no. 5, pp. 2562–2582, 2013, https://doi.org/10.3390/en6052562
-
[30]
Lee GS, Cheong CL, Shin SBet al, “A Case Study of Localization and Identification of Noise Sources From a Pitch and a Stall Regulated Wind Turbine,”Applied Acoustics, vol.73, pp. 817–827, 2012, https://doi.org/10.1016/j.apacoust.2012.03.001. 16
discussion (0)
Sign in with ORCID, Apple, or X to comment. Anyone can read and Pith papers without signing in.