REVIEW 3 major objections 5 minor 85 references
Coupled CFD-DEM model for dry powder inhalers simulation: validation and sensitivity analysis for the main model parameters
T0 review · 3 major / 5 minor · reviewed 2026-08-05 · deepseek-v4-flash
Pith's one-line read A calibrated CFD-DEM model reproduces a dry-powder inhaler's measured carrier and fine emission and attributes the breath-actuated dose protector's >10% performance gain to stronger turbulence on already detached fine particles.
desk verdict A transparent calibration study with credible fluid validation, but the powder-side agreement is a fit to an optical proxy, and the dose-protector mechanism inherits that uncertainty. read the letter →
The pith
A machine-rendered reading of the paper's core claim, the machinery that carries it, and where it could break.
The reading
What carries the argument
The load-bearing mechanism is the step-edge classifier between the swirl chamber and the outlet pipe: carrier particles orbit there, trapped by centrifugal force, and escape when radial drag overcomes the trap; the DEM parameters are calibrated so that the trapping-and-release timing matches the measured emission curve. For fines, the key objects are the hard-sphere Lagrangian tracer with a stochastic eddy-interaction model and a low restitution coefficient, plus the volumetric turbulent kinetic energy density that the detached fines experience on their way to the outlet. The paper's mechanistic conclusion rests on comparing tracer emission peaks and turbulence-weighted averages with and wit
What would settle it
Measure the carrier emission curve directly—for example, with a fast time-resolved impactor or by tracking individual particles at the outlet with high-speed imaging—and compare it with the Gaussian-renormalized curve used here. If the true carrier-emission timing or cumulative shape differs beyond the model's parameter tolerance, the calibrated DEM parameters and the dose-protector mechanism would be shown to be artifacts of the optical reconstruction.
Extended reading notes
Core claim
The paper claims that a four-way coupled CFD-DEM simulation of the NextHaler test rig, with DEM contact parameters chosen to match the measured carrier-emission curve and with Lagrangian restitution tuned to the measured fine-emission peak, reproduces the published aerosolization data. In this picture, the carrier emission time is set by how long particles remain trapped at the sharp step-edge between swirl chamber and pipe, where centrifugal force opposes the radial drag needed to escape. The paper further claims that the breath-actuated dose protector's more-than-10% improvement in fine particle fraction is mainly due to the higher turbulent kinetic energy density that already detached fin
Load-bearing premise
The results stand on the reconstructed carrier-emission curve obtained by turning brightness in the cup movies into a particle count, fitting it to a Gaussian, and rescaling it to the 10 mg dose; if that curve misstates when the carrier actually leaves the device, the calibrated collision parameters and the turbulence-based explanation do not follow.
Editorial extensions
If this is right
- A narrow region of DEM parameters—restitution around 0.5 and sliding and rolling friction between 0.5 and 0.8—is needed to reproduce the measured carrier emission, so the calibration is not arbitrary.
- The fine emission peak is reproduced with one-way Lagrangian tracing and very inelastic collisions, indicating that the main fine-emission peak is dominated by direct fluid detachment from the carrier rather than by carrier collisions.
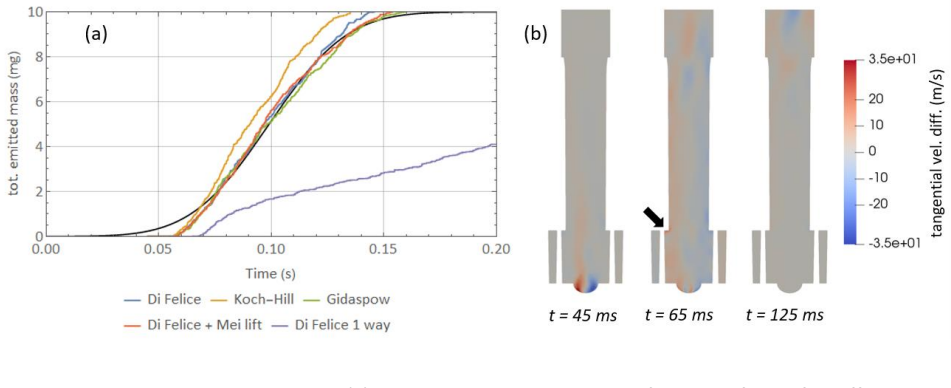
- Four-way coupling is necessary: removing the fluid slowdown caused by particles at the step-edge changes the balance between centrifugal trapping and radial drag and makes the simulated emission too slow.
- The dose protector's benefit appears to come from raising the turbulence felt by detached fines inside the device, which suggests that geometry changes that increase turbulent kinetic energy along the outlet path could also improve fine particle fraction.
- Once calibrated, the model can be applied to device-geometry optimization, formulation changes, patient-specific inspiratory profiles, and coupling with lung-deposition simulations.
Reading between the lines
- A direct experimental test would be to measure time-resolved carrier mass at the outlet with an independent method, such as a fast cascade impactor or single-particle tracking, and compare it with the Gaussian-renormalized optical curve used for calibration; disagreement in peak timing would force a re-calibration.
- If the turbulence-on-detached-fines mechanism is right, then adding deliberate turbulence promoters in the outlet pipe or swirl chamber, without changing the dose protector, should reproduce part of the fine-particle-fraction gain; this is testable in vitro.
- The Lagrangian model's reproduction of both the early escape peak and the main fine-emission peak suggests that the aggregation state of fines at detachment is the largest unmeasured uncertainty; outlet particle-size-distribution measurements during aerosolization would sharpen the model.
- Because the paper's quantitative claim of agreement with the carrier curve is anchored to a renormalized optical intensity, the safest reading is that the simulation reproduces the shape and timing of carrier emission, pending a true mass-calibrated measurement.
Editorial analysis
A structured set of objections, weighed in public.
Referee Report
Summary. The paper develops a coupled CFD-DEM model for the NextHaler dry powder inhaler and assesses its ability to reproduce published experimental data. Fluid flow is modeled with a pressure-driven RANS k-omega-SST approach, validated against PIV velocity maps and pressure-drop measurements; carrier particles are simulated with DEM (Hertz-Mindlin contacts, rolling/sliding friction, restitution) and calibrated to a reconstructed carrier emission curve; API fines are approximated by one-way Lagrangian tracers with a calibrated restitution coefficient. The calibrated model is then used to interpret the >10% fine-particle-fraction benefit of the breath-actuated dose protector in terms of turbulent kinetic energy experienced by detached fines. The paper is unusually candid about its assumptions and limitations, and includes mesh sensitivity, y+ monitoring, a posteriori compressibility checks, and 1-way vs 4-way coupling comparisons.
Significance. If the central validation claim were fully supported, the paper would be a valuable contribution to DPI CFD-DEM practice: the fluid-side validation is credible and largely independent (mesh sensitivity, y+ control, compressibility check with rhoSimpleFoam, and PIV comparison without fluid-parameter fitting). The systematic parameter sensitivity study for DEM coefficients, drag models, and coupling modes is also a useful engineering reference. However, the powder-side 'validation' is actually a calibration against a reconstructed optical-intensity proxy, not a direct mass-flow measurement, and the mechanistic conclusions about deagglomeration and the dose-protector benefit go beyond what the current model can demonstrate. The work is best positioned as an honest calibration study with clearly separated predictive and interpretive claims; in its present form the validation language overstates the strength of the evidence.
major comments (3)
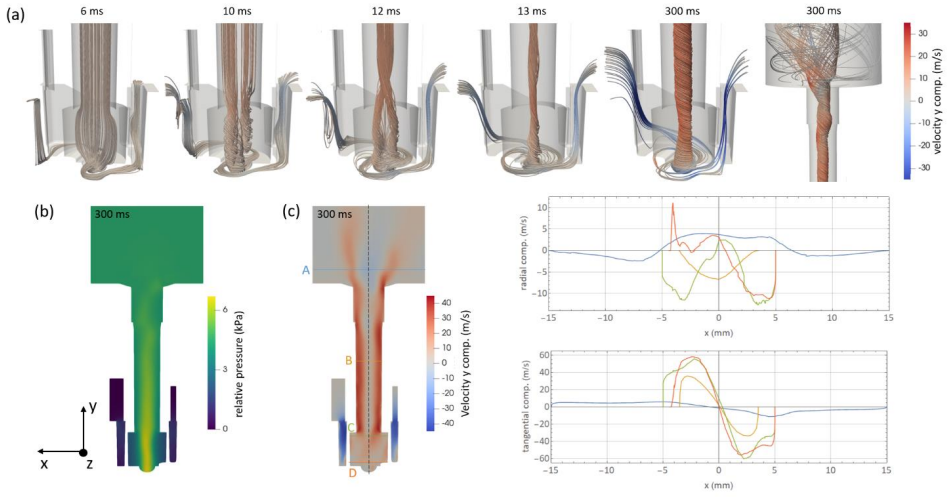
- [Section 3.4 and Appendix A (Fig. A.2(b,c), Fig. 12)] The carrier emission reference curve used to calibrate the DEM parameters e, mu_s, mu_r is not a direct mass-flow measurement. It is a Gaussian fit to the normalized top-view pixel intensity, which the authors explicitly state 'has no direct connection to the emitted carrier mass', renormalized so that its integral equals the 10 mg dose. Side-view particle counts are trusted only until crowding in the collection chamber invalidates them (Appendix A). Therefore the best-fit parameter set e≈0.5, mu_s, mu_r≈0.5–0.8 reproduces a proxy whose shape, timing, and mass normalization depend on binarization thresholds, cluster filters, and the assumed Gaussian form. The step-edge trapping/release mechanism and the dose-protector conclusions in Section 3.5 inherit this uncertainty. Please either obtain or use an independent mass-flow measurement for the calibration target, or reframe the claim from
- [Section 3.3, Fig. 11(a)] The agreement for the fines emission peak is achieved by fitting the Lagrangian restitution coefficient (e=0.05) against the experimental emission peak. The authors themselves list several compensation effects: overestimated drag in the viscous sub-layer, one-way coupling, uncertain aggregate size, and a possible trade-off between e and particle diameter. Thus the fines emission is a postdiction, not a prediction, and the statement that the main emission peak is 'almost entirely originated by direct detachment' is not uniquely supported. Please explicitly label these results as calibrated/postdicted and provide a sensitivity range for e showing whether the Fig. 16(e) turbulent-kinetic-energy difference between dose-protector conditions is robust across that range.
- [Section 3.5, Eq. (3), Fig. 16(e)] The mechanistic conclusion that the >10% FPF benefit is 'mainly due to a better chance of deagglomeration and dispersion for the already detached fines' is not directly supported by the simulations. The model contains no deagglomeration submodel and the fines are passive tracers with neither particle-particle interactions nor a detachment mechanism. The evidence is a difference in the volume-averaged turbulent kinetic energy felt by the fines, which is a plausible correlation but not a causal demonstration. Please either soften the conclusion to a clearly labeled hypothesis or add an explicit deagglomeration model to test the proposed mechanism.
minor comments (5)
- [Section 1, line 4] Typo: 'Pasquali at al.' should be 'Pasquali et al.'.
- [Section 1, abstract area] 'contests' in the introduction should be 'contexts'.
- [Appendix A, Fig. A.1 caption] Typo: 'withe background' should be 'white background'.
- [Table 3] The column header 'p value w value p-w value' is garbled; the table would benefit from a clearer layout distinguishing particle, wall, and particle-wall values, and from reporting uncertainty or provenance for the fitted DEM parameters.
- [Appendix B, Eq. (A2) and Table B.1] The pressure-drop boundary condition is fitted to measured data with no uncertainty reported for the coefficients p0, a1, a2, a3. Please state the fit quality and consider whether the pressure-driven boundary condition reduces the independence of the fluid validation, even though the PIV comparison is reassuring.
Circularity Check
The 'validated' carrier and fines emission curves are calibration targets: DEM parameters (e, mu_r, mu_s) are tuned to reproduce a Gaussian-reconstructed optical-intensity proxy renormalized to 10 mg, and the fines restitution coefficient is tuned to the measured peak; the subsequent mechanistic claims inherit these fitted inputs.
-
fitted input called prediction
[Appendix A, 'Processing of the fast camera movies' and Section 3.4, 'Validation of the coupled CFD-DEM model']
"Although this normalized optical intensity has no direct connection to the emitted carrier mass, it gives a precise measure of the duration of the overall carrier emission time. We simply renormalized the gaussian curve in such a way that its integral corresponds to the 10mg of total dose mass, in this way its cumulative distribution represent the total emitted mass in time. Such curve is shown in green in Figure A.2 (c) ... The data in Figure A.2 (c) will be used in the paper to validate the coupled CFD-DEM model."
The DEM parameters e, mu_r, mu_s are varied until the simulated carrier-emission curve matches the 'reference experiment' curve. That reference curve is not a direct mass-flow measurement: it is a Gaussian fit to normalized top-view optical intensity, renormalized so its integral equals the 10 mg dose, and the authors explicitly state it 'has no direct connection to the emitted carrier mass.' Therefore the reported agreement in Figure 12 is a calibration to a constructed proxy, not an independent validation; the 'predicted' emitted-mass curve is, by construction, the curve the parameters were tuned to reproduce. Any bias in binarization thresholds, cluster filters, or the Gaussian ansatz enters the model through the calibrated parameters.
-
fitted input called prediction
[Section 3.3, 'Considerations on aerosolization based on the pure CFD model' and Section 3.5, 'Considerations on aerosolization based on the CFD-DEM model']
"only with e < 0.15 the emission peak position start to be independent of e and to approach the measured values (black dots). ... the fact that the d = 3 µm, e = 0.05 peak matches the measurements might be both an indicator of the way particles behave during detachment from the carrier, or just the result of a compensation."
The restitution coefficient e for the Lagrangian fines is selected by matching the simulated emission-peak position to the measured fines peak; the authors even acknowledge the match could be 'just the result of a compensation' for missing physics. This calibrated e is then used in Section 3.5 to identify the small experimental peak and as 'further proof of the reliability of our calibrated model.' Since the main peak agreement was procured by tuning e, the subsequent 'prediction' of the other peak is not independent evidence; the fine-particle portion of the dose-protector mechanism rests on a parameter already fitted to the fines emission data.
full rationale
The fluid-side validation (PIV velocity maps, flow-rate onset under measured pressure drops) is genuine independent evidence, and there is no load-bearing self-citation chain: refs [17,20,73,74] are background or prior device studies, not used to forbid alternatives. The circularity is limited to the solid-phase 'validation'. Section 3.4 tunes e, mu_r, mu_s until the simulated carrier-emission curve matches a curve constructed in Appendix A by binarizing fast-camera movies, applying cluster filters, fitting the normalized optical intensity with a Gaussian, and renormalizing to the 10 mg dose; the authors explicitly state this intensity 'has no direct connection to the emitted carrier mass' and that crowding invalidates the side-view analysis at later times. The match is therefore a fit to a proxy, not a prediction. Likewise, the fines emission peak is matched by choosing e ~ 0.05-0.1, with the authors conceding the agreement may be a compensation artifact. The mechanistic conclusion about the dose protector (>10% FPF gain mainly due to better deagglomeration/dispersion of already detached fines) is an inference from this calibrated model; it is not directly fitted, but it inherits the calibration uncertainty because the same parameters and the same one-way tracer (with no deagglomeration model) are used. Hence partial circularity: the headline 'validation' claims reduce by construction, though the dose-protector mechanism itself is not literally equivalent to the calibration targets. Score 6.
Assumptions & free parameters
free parameters (6)
- Carrier DEM restitution coefficient e =
0.5
- Carrier DEM sliding friction coefficient mu_s =
0.5-0.8
- Carrier DEM rolling friction coefficient mu_r =
0.5-0.8
- Lagrangian restitution coefficient e for API fines =
0.05
- Pressure-drop boundary condition coefficients p0, a1, a2, a3 =
Vary per case, Table B.1
- Reference carrier emission curve normalization =
Gaussian renormalized so integral equals 10 mg
assumptions (8)
- domain assumption The test-rig geometry has the same internal volumes and aerodynamic resistance as the NextHaler, so simulations on it are equivalent.
- domain assumption The dose protector motion does not influence vortex formation, and bracketing release at t=0 or at 2 kPa pressure drop captures the real behavior.
- domain assumption Carrier particles can be modeled as spheres with a reduced Young modulus and no cohesion.
- domain assumption The RANS k-omega-SST eddy-viscosity model adequately captures the turbulent flow for the carrier dynamics and the mean flow structure.
- domain assumption The empirical drag correlations (Di Felice, Gidaspow) remain valid for this strongly poly-disperse, spherical-particle system over the full range of volume fraction and particle Reynolds number.
- domain assumption The fitted pressure-drop curves of eq. (A2) faithfully represent the experimental driving condition, including the dose protector release time.
- domain assumption Incompressible flow is a valid assumption for the air phase.
- domain assumption Wall functions and the unresolved CFD-DEM coupling adequately represent the near-wall fluid velocity for particles in the viscous sublayer.
Cite this review
Pith. "Pith review of Coupled CFD-DEM model for dry powder inhalers simulation: validation and sensitivity analysis for the main model parameters." pith.science (2026). https://pith.science/paper/QHC2YQRE
@misc{pith2026250909694,
  author       = {Pith},
  title        = {Pith review of: Coupled CFD-DEM model for dry powder inhalers simulation: validation and sensitivity analysis for the main model parameters},
  year         = {2026},
  howpublished = {\url{https://pith.science/paper/QHC2YQRE}},
  note         = {Machine review of arXiv:2509.09694}
}
read the original abstract
The use of computational techniques in the design of dry powder inhalers (DPI), as well as in unravelling the complex mechanisms of drug aerosolization, has increased significantly in recent years. Computational fluid dynamics (CFD) is used to study the air flow, inside the DPI, during the patient inspiratory act while discrete element methods (DEM) are used to simulate the dispersion and aerosolization of the drug product powder particles. In this work we discuss the possibility to validate a coupled CFD-DEM model for the NextHaler DPI device against previously published experimental data. The approximations and assumptions made are deeply discussed. The comparison between computational and experimental results is detailed both for fluid and powder flows. Finally, the potential and possible applications of a calibrated DPI model are discussed as well as the missing elements necessary to achieve a fully quantitatively predictive computational model.
Figures


Figures from the paper (11 more)





Reference graph
Works this paper leans on
-
[1]
Finlay, The mechanics of inhaled pharmaceutical aerosols, Academic Press, 2001
W.H. Finlay, The mechanics of inhaled pharmaceutical aerosols, Academic Press, 2001
2001
-
[2]
M. Hoppentocht, P. Hagedoorn, H.W. Frijlink, A.H. de Boer, Technological and practical challenges of dry powder inhalers and formulations, Adv. Drug Deliv. Rev. 75 (2014) 18–31. doi:10.1016/j.addr.2014.04.004
-
[3]
D. Traini, P.M. Young, Formulation of Inhalation Medicines, in: Inhal. Drug Deliv., John Wiley & Sons, Ltd, 2013: pp. 31–45. doi:10.1002/9781118397145.ch3
-
[4]
K. Berkenfeld, A. Lamprecht, J.T. McConville, Devices for Dry Powder Drug Delivery to the Lung, AAPS PharmSciTech. 16 (2015) 479–490. doi:10.1208/s12249-015-0317-x
-
[5]
A.H. de Boer, P. Hagedoorn, M. Hoppentocht, F. Buttini, F. Grasmeijer, H.W. Frijlink, Dry powder inhalation: past, present and future, Expert Opin. Drug Deliv. 14 (2017) 499–512. doi:10.1080/17425247.2016.1224846
-
[6]
A.H. De Boer, H.K. Chan, R. Price, A critical view on lactose-based drug formulation and device studies for dry powder inhalation: Which are relevant and what interactions to expect?, Adv. Drug Deliv. Rev. 64 (2012) 257–274. doi:10.1016/j.addr.2011.04.004
-
[7]
A.M. Healy, M.I. Amaro, K.J. Paluch, L. Tajber, Dry powders for oral inhalation free of lactose carrier particles, Adv. Drug Deliv. Rev. 75 (2014) 32–52. doi:10.1016/j.addr.2014.04.005
-
[8]
F. Buttini, G. Colombo, P.C.L. Kwok, W.T. Wui, Aerodynamic Assessment for Inhalation Products: Fundamentals and Current Pharmacopoeial Methods, in: Inhal. Drug Deliv., John Wiley & Sons, Ltd, 2013: pp. 91–119. doi:10.1002/9781118397145.ch6
Show all 85 references
-
[9]
Young, O
P.M. Young, O. Wood, J. Ooi, D. Traini, The influence of drug loading on formulation structure and aerosol performance in carrier based dry powder inhalers, Int. J. Pharm. 416 (2011) 129–135. doi:10.1016/j.ijpharm.2011.06.020
2011 doi
-
[10]
Pilcer, N
G. Pilcer, N. Wauthoz, K. Amighi, Lactose characteristics and the generation of the aerosol, Adv. 73 Drug Deliv. Rev. 64 (2012) 233–256. doi:10.1016/j.addr.2011.05.003
2012 doi
-
[11]
J. Shur, R. Price, D. Lewis, P.M. Young, G. Woollam, D. Singh, S. Edge, From single excipients to dual excipient platforms in dry powder inhaler products, Int. J. Pharm. 514 (2016) 374–383. doi:https://doi.org/10.1016/j.ijpharm.2016.05.057
2016 doi
-
[12]
P. Du, J. Du, H.D.C. Smyth, Evaluation of Granulated Lactose as a Carrier for DPI Formulations 1: Effect of Granule Size, Ageing Int. 15 (2014) 1417–1428. doi:10.1208/s12249-014-0166-z
2014 doi
-
[13]
Rudén, A
J. Rudén, A. Vajdi, G. Frenning, T. Bramer, Comparison Between High and Low Shear Mixers in the Formation of Adhesive Mixtures for Dry Powder Inhalers, Respir. Drug Deliv. Eur. 2019. 2 (2019) 457–460
2019
-
[14]
Kaialy, On the effects of blending, physicochemical properties, and their interactions on the performance of carrier-based dry powders for inhalation-A review, Adv
W. Kaialy, On the effects of blending, physicochemical properties, and their interactions on the performance of carrier-based dry powders for inhalation-A review, Adv. Colloid Interface Sci. 235 (2016) 70–89. doi:10.1016/j.cis.2016.05.014
2016 doi
-
[15]
Hertel, E
M. Hertel, E. Schwarz, M. Kobler, S. Hauptstein, H. Steckel, R. Scherließ, The influence of high shear mixing on ternary dry powder inhaler formulations, Int. J. Pharm. 534 (2017) 242–250. doi:10.1016/j.ijpharm.2017.10.033
2017 doi
-
[16]
Djokić, K
M. Djokić, K. Kachrimanis, L. Solomun, J. Djuriš, D. Vasiljević, S. Ibrić, A study of jet-milling and spray- drying process for the physicochemical and aerodynamic dispersion properties of amiloride HCl, Powder Technol. 262 (2014) 170–176. doi:10.1016/j.powtec.2014.04.066
2014 doi
-
[17]
Yeung, D
S. Yeung, D. Traini, A. Tweedie, D. Lewis, T. Church, P.M. Young, Effect of Dosing Cup Size on the Aerosol Performance of High-Dose Carrier-Based Formulations in a Novel Dry Powder Inhaler, J. Pharm. Sci. 108 (2019) 949–959. doi:10.1016/j.xphs.2018.09.033
2019 doi
-
[18]
Kopsch, D
T. Kopsch, D. Murnane, D. Symons, Optimizing the Entrainment Geometry of a Dry Powder Inhaler: Methodology and Preliminary Results, Pharm. Res. 33 (2016) 2668–2679. doi:10.1007/s11095-016- 1992-3. 74
2016 doi
-
[19]
Nakhaei, B
M. Nakhaei, B. Lu, Y. Tian, W. Wang, K. Dam-Johansen, H. Wu, CFD modeling of gas-solid cyclone separators at ambient and elevated temperatures, Processes. 8 (2020) 1–26. doi:10.3390/pr8020228
2020 doi
-
[20]
S. Bnà, R. Ponzini, M. Cestari, C. Cavazzoni, C. Cottini, A. Benassi, Investigation of particle dynamics and classification mechanism in a spiral jet mill through computational fluid dynamics and discrete element methods, Powder Technol. 364 (2020) 746–773. doi:10.1016/j.powte...
2020 doi
-
[21]
Sommerfeld, Y
M. Sommerfeld, Y. Cui, S. Schmalfuß, Potential and constraints for the application of CFD combined with Lagrangian particle tracking to dry powder inhalers, Eur. J. Pharm. Sci. 128 (2019) 299–324. doi:10.1016/j.ejps.2018.12.008
2019 doi
-
[22]
J. Tu, K. Inthavong, G. Ahmadi, Computational Fluid and Particle Dynamics in the Human Respiratory System, Springer Netherlands, 2013
2013
-
[23]
Wong, D.F
W. Wong, D.F. Fletcher, D. Traini, H.K. Chan, P.M. Young, The use of computational approaches in inhaler development, Adv. Drug Deliv. Rev. 64 (2012) 312–322. doi:10.1016/j.addr.2011.10.004
2012 doi
-
[24]
Ruzycki, E
C.A. Ruzycki, E. Javaheri, W.H. Finlay, The use of computational fluid dynamics in inhaler design, Expert Opin. Drug Deliv. 10 (2013) 307–323. doi:10.1517/17425247.2013.753053
2013
-
[25]
Suwandecha, W
T. Suwandecha, W. Wongpoowarak, T. Srichana, Computer-aided design of dry powder inhalers using computational fluid dynamics to assess performance, Pharm. Dev. Technol. 21 (2016) 54–60. doi:10.3109/10837450.2014.965325
2016
-
[26]
Kopsch, D
T. Kopsch, D. Murnane, D. Symons, A personalized medicine approach to the design of dry powder inhalers: Selecting the optimal amount of bypass, Int. J. Pharm. 529 (2017) 589–596. doi:10.1016/j.ijpharm.2017.07.002
2017 doi
-
[27]
Ariane, M
M. Ariane, M. Sommerfeld, A. Alexiadis, Wall collision and drug-carrier detachment in dry powder inhalers: Using DEM to devise a sub-scale model for CFD calculations, Powder Technol. 334 (2018) 65–75. doi:10.1016/j.powtec.2018.04.051. 75
2018 doi
-
[28]
Yang, C.Y
J. Yang, C.Y. Wu, M. Adams, DEM analysis of the effect of particle-wall impact on the dispersion performance in carrier-based dry powder inhalers, Int. J. Pharm. 487 (2015) 32–38. doi:10.1016/j.ijpharm.2015.04.006
2015 doi
-
[29]
Tong, R.Y
Z.B. Tong, R.Y. Yang, K.W. Chu, A.B. Yu, S. Adi, H.K. Chan, Numerical study of the effects of particle size and polydispersity on the agglomerate dispersion in a cyclonic flow, Chem. Eng. J. 164 (2010) 432–441. doi:https://doi.org/10.1016/j.cej.2009.11.027
2010 doi
-
[30]
Z.B. Tong, S. Adi, R.Y. Yang, H.K. Chan, A.B. Yu, Numerical investigation of the de-agglomeration mechanisms of fine powders on mechanical impaction, J. Aerosol Sci. 42 (2011) 811–819. doi:https://doi.org/10.1016/j.jaerosci.2011.07.004
2011 doi
-
[31]
Z. Tong, W. Zhong, A. Yu, H.K. Chan, R. Yang, CFD-DEM investigation of the effect of agglomerate- agglomerate collision on dry powder aerosolisation, J. Aerosol Sci. 92 (2016) 109–121. doi:10.1016/j.jaerosci.2015.11.005
2016 doi
-
[32]
Y. Cui, M. Sommerfeld, Forces on micron-sized particles randomly distributed on the surface of larger particles and possibility of detachment, Int. J. Multiph. Flow. 72 (2015) 39–52. doi:https://doi.org/10.1016/j.ijmultiphaseflow.2015.01.006
2015 doi
-
[33]
Nguyen, J
D. Nguyen, J. Remmelgas, I.N. Björn, B. van Wachem, K. Thalberg, Towards quantitative prediction of the performance of dry powder inhalers by multi-scale simulations and experiments, Int. J. Pharm. 547 (2018) 31–43. doi:10.1016/j.ijpharm.2018.05.047
2018 doi
-
[34]
Z. Tong, H. Kamiya, A. Yu, H.K. Chan, R. Yang, Multi-scale modelling of powder dispersion in a carrier- based inhalation system, Pharm. Res. 32 (2015) 2086–2096. doi:10.1007/s11095-014-1601-2
2015 doi
-
[35]
Z. Qiao, Z. Wang, C. Zhang, S. Yuan, Y. Zhu, J. Wang, Simulation of Dry Powder Inhalers: Combining Micro-Scale, Meso-Scale and Macro-Scale Modeling, AIChE J. 59 (2012) 215–228. doi:10.1002/aic
2012 doi
-
[36]
Casey, T
M. Casey, T. Wintergerste, Special interest group on quality and trust in industrial CFD, best practice guidelines, version 1. ERCOFTAC Qinetiq; Farnborough, Hampshire, UK: 2000, Farnborough, 76 Hampshire, UK, 2000
2000
-
[37]
Sommerfeld, B
M. Sommerfeld, B. van Wachem, R. Oliemans, Best practice guidelines for computational fluid dynamics of dispersed multiphase flows, ERCOFTAC SIAMUF, Gothenburg, Sweden, 2008
2008
-
[38]
Assessing Credibility of Computational Modeling through Verification and Validation: Application to Medical Devices, V&V 40, ASME, New York, NY, 2018
2018
-
[39]
Pasquali, C
I. Pasquali, C. Merusi, G. Brambilla, E.J. Long, G.K. Hargrave, H.K. Versteeg, Optical diagnostics study of air flow and powder fluidisation in Nexthaler® - Part I: Studies with lactose placebo formulation, Int. J. Pharm. 496 (2015) 780–791. doi:10.1016/j.ijpharm.2015.10.072
2015 doi
-
[40]
Merusi, G
C. Merusi, G. Brambilla, E.J. Long, G.K. Hargrave, H.K. Versteeg, Optical diagnostics studies of air flow and powder fluidisation in Nexthaler®. Part II: Use of fluorescent imaging to characterise transient release of fines from a dry powder inhaler, Int. J. Pharm. 549 (2018) ...
2018 doi
-
[41]
Corradi, H
M. Corradi, H. Chrystyn, B.G. Cosio, M. Pirozynski, S. Loukides, R. Louis, M. Spinola, O.S. Usmani, NEXThaler, an innovative dry powder inhaler delivering an extrafine fixed combination of beclometasone and formoterol to treat large and small airways in asthma, Expert Opin. Dr...
2014
-
[42]
Yeung, D
S. Yeung, D. Traini, A. Tweedie, D. Lewis, T. Church, P.M. Young, Assessing Aerosol Performance of a Dry Powder Carrier Formulation with Increasing Doses Using a Novel Inhaler, AAPS PharmSciTech. 20 (2019) 1–12. doi:10.1208/s12249-019-1302-6
2019 doi
-
[43]
Hager, C
A. Hager, C. Kloss, S. Pirker, C. Goniva, Parallel Resolved Open Source CFD-DEM: Method, Validation and Application, J. Comput. Multiph. Flows. 6 (2014) 13–27. doi:10.1260/1757-482X.6.1.13
2014 doi
-
[44]
Goniva, C
C. Goniva, C. Kloss, N. Deen, H. Kuipers, S. Pirker, Influence of rolling friction on single spout fluidized bed simulation, Particuology. 10 (2012) 582–591. doi:10.1016/j.partic.2012.05.002
2012 doi
-
[45]
https://www.aspherix-dem.com/
DCS Computing, (n.d.). https://www.aspherix-dem.com/. 77
-
[46]
https://openfoam.org/
The OpenFOAM Foundation, (n.d.). https://openfoam.org/
-
[47]
Weller, G
H.G. Weller, G. Tabor, H. Jasak, C. Fureby, A tensorial approach to computational continuum mechanics using object-oriented techniques, Comput. Phys. 12 (1998) 620–631
1998
-
[48]
Kloss, C
C. Kloss, C. Goniva, A. Hager, S. Amberger, S. Pirker, Models, algorithms and validation for opensource DEM and CFD-DEM, Prog. Comput. Fluid Dyn. An Int. J. 12 (2012) 140. doi:10.1504/PCFD.2012.047457
2012 arXiv
-
[49]
Cengel, J
Y. Cengel, J. Cimbala, Fluid Mechanics: Fundamentals and Applications, McGraw Hill Education, 2018
2018
-
[50]
Menter, Two-equation eddy-viscosity turbulence models for engineering applications, AIAA J
F.R. Menter, Two-equation eddy-viscosity turbulence models for engineering applications, AIAA J. 32 (1994) 1598–1605. doi:10.2514/3.12149
1994 doi
-
[51]
Salim, S.C
S.M. Salim, S.C. Cheah, Wall y+ Strategy for Dealing with Wall-bounded Turbulent Flows Vol II, Proc. Int. MultiConference Eng. Comput. Sci. 2009. (2009)
2009
-
[52]
Schlichting, K
H. Schlichting, K. Gersten, Boundary Layer Theory, Springer-Verlag, 2017
2017
-
[53]
Norouzi, R
H.R. Norouzi, R. Zarghami, R. Sotudeh-Gharebagh, N. Mostoufi, Coupled CFD-DEM Modeling, John Wiley & Sons, 2016
2016
-
[54]
Paulick, M
M. Paulick, M. Morgeneyer, A. Kwade, Review on the influence of elastic particle properties on DEM simulation results, Powder Technol. 283 (2015) 66–76. doi:10.1016/j.powtec.2015.03.040
2015 doi
-
[55]
Brosh, H
T. Brosh, H. Kalman, A. Levy, Accelerating CFD-DEM simulation of processes with wide particle size distributions, Particuology. 12 (2014) 113–121. doi:10.1016/j.partic.2013.04.008
2014 doi
-
[56]
Dehbi, Turbulent particle dispersion in arbitrary wall-bounded geometries: A coupled CFD- Langevin-equation based approach, Int
A. Dehbi, Turbulent particle dispersion in arbitrary wall-bounded geometries: A coupled CFD- Langevin-equation based approach, Int. J. Multiph. Flow. 34 (2008) 819–828. doi:https://doi.org/10.1016/j.ijmultiphaseflow.2008.03.001
2008 doi
-
[57]
Di Renzo, F.P
A. Di Renzo, F.P. Di Maio, Comparison of contact-force models for the simulation of collisions in 78 DEM-based granular flow codes, Chem. Eng. Sci. 59 (2004) 525–541. doi:https://doi.org/10.1016/j.ces.2003.09.037
2004 doi
-
[58]
Ai, J.-F
J. Ai, J.-F. Chen, J.M. Rotter, J.Y. Ooi, Assessment of rolling resistance models in discrete element simulations, Powder Technol. 206 (2011) 269–282. doi:https://doi.org/10.1016/j.powtec.2010.09.030
2011 doi
-
[59]
Barthel, Adhesive elastic contacts: JKR and more, J
E. Barthel, Adhesive elastic contacts: JKR and more, J. Phys. D. Appl. Phys. 41 (2008) 163001. doi:10.1088/0022-3727/41/16/163001
2008 doi
-
[60]
Zhou, S.B
Z.Y. Zhou, S.B. Kuang, K.W. Chu, A.B. Yu, Discrete particle simulation of particle-fluid flow: Model formulations and their applicability, J. Fluid Mech. 661 (2010) 482–510. doi:10.1017/S002211201000306X
2010 doi
-
[61]
Zhu, Z.Y
H.P. Zhu, Z.Y. Zhou, R.Y. Yang, A.B. Yu, Discrete particle simulation of particulate systems: Theoretical developments, Chem. Eng. Sci. 62 (2007) 3378–3396. doi:10.1016/j.ces.2006.12.089
2007 doi
-
[62]
Koch, D.L
R.J. Koch, D.L. Hill, INERTIAL EFFECTS IN SUSPENSION AND POROUS-MEDIA FLOWS, Annu. Rev. Fluid Mech. 33 (2001) 619–647
2001
-
[63]
Haider, O
A. Haider, O. Levenspiel, Drag coefficient and terminal velocity of spherical and nonspherical particles, Powder Technol. 58 (1989) 63–70. doi:https://doi.org/10.1016/0032-5910(89)80008-7
1989 doi
-
[64]
Sweeney, W.H
L.G. Sweeney, W.H. Finlay, Lift and drag forces on a sphere attached to a wall in a Blasius boundary layer, J. Aerosol Sci. 38 (2007) 131–135. doi:10.1016/j.jaerosci.2006.09.006
2007 doi
-
[65]
Mclaughlin, Inertial migration of a small sphere in linear shear flows, J
J.B. Mclaughlin, Inertial migration of a small sphere in linear shear flows, J. Fluid Mech. 224 (1991) 261–274. doi:10.1017/S0022112091001751
1991 doi
-
[66]
Loth, A.J
E. Loth, A.J. Dorgan, An equation of motion for particles of finite Reynolds number and size, Environ. Fluid Mech. 9 (2009) 187–206. doi:10.1007/s10652-009-9123-x
2009 doi
-
[67]
Cherukat, J.B
P. Cherukat, J.B. McLaughlin, A.L. Graham, The inertial lift on a rigid sphere translating in a linear 79 shear flow field, Int. J. Multiph. Flow. 20 (1994) 339–353. doi:https://doi.org/10.1016/0301- 9322(94)90086-8
1994 doi
-
[68]
Leighton, A
D. Leighton, A. Acrivos, The lift on a small sphere touching a plane in the presence of a simple shear flow, Z. Angew. Math. Phys. 36 (1985) 174–178. doi:https://doi.org/10.1007/BF00949042
1985 doi
-
[69]
Boyce, D.J
C.M. Boyce, D.J. Holland, S.A. Scott, J.S. Dennis, Limitations on Fluid Grid Sizing for Using Volume- Averaged Fluid Equations in Discrete Element Models of Fluidized Beds, Ind. Eng. Chem. Res. 54 (2015) 10684–10697. doi:10.1021/acs.iecr.5b03186
2015 doi
-
[70]
Pirker, D
S. Pirker, D. Kahrimanovic, C. Goniva, Improving the applicability of discrete phase simulations by smoothening their exchange fields, Appl. Math. Model. 35 (2011) 2479–2488. doi:10.1016/j.apm.2010.11.066
2011 doi
-
[71]
S. Radl, B. Capa Gonzales, C. Goniva, S. Pirker, State of the Art in Mapping Schemes for Dilute and Dense Euler-Lagrange Simulations, in: Prog. Appl. CFD, SINTEF Academic Press, 2015: pp. 103–112
2015
-
[72]
Gosman, E
A.D. Gosman, E. loannides, Aspects of Computer Simulation of Liquid-Fueled Combustors, J. Energy. 7 (1983) 482–490. doi:10.2514/3.62687
1983 doi
-
[73]
Tweedie, F
A. Tweedie, F. Mason, D. Lewis, Investigating the Effect of Modified Breath Actuated Mechanisms on the Dispersion Performance of the NEXThaler®, Drug Deliv. to Lungs 26. (2015)
2015
-
[74]
Tweedie, D
A. Tweedie, D. Lewis, Enhancing the Performance of Dry Powder Inhalers: Breath Actuated Mechanisms, ONdrugDelivery Mag. (2016) 34–38
2016
-
[75]
Kaye, Particle Shape Characterization, in: M.E
B.H. Kaye, Particle Shape Characterization, in: M.E. Fayed, L. Otten (Eds.), Handb. Powder Sci. Technol., Springer, Boston, MA, 1997. doi:https://doi.org/10.1007/978-1-4615-6373-0_2
1997 doi
-
[76]
De Boer, D
A.H. De Boer, D. Gjaltema, P. Hagedoorn, M. Schaller, W. Witt, H.W. Frijlink, Design and application of a new modular adapter for laser diffraction characterization of inhalation aerosols, Int. J. Pharm. 249 (2002) 233–245. doi:10.1016/S0378-5173(02)00527-6. 80
2002 doi
-
[77]
K. Bass, D. Farkas, W. Longest, Optimizing Aerosolization Using Computational Fluid Dynamics in a Pediatric Air-Jet Dry Powder Inhaler, AAPS PharmSciTech. 20 (2019) 1–19. doi:10.1208/s12249-019- 1535-4
2019 doi
-
[78]
Tibbatts, P
J. Tibbatts, P. Mendes, P. Villax, Understanding the Power Requirements for Efficient Dispersion in Powder Inhalers: Comparing CFD Predictions and Experimental Measurements, Respir. Drug Deliv
-
[79]
Yeung, D
S. Yeung, D. Traini, D. Lewis, P.M. Young, Dosing challenges in respiratory therapies, Int. J. Pharm. 548 (2018) 659–671. doi:https://doi.org/10.1016/j.ijpharm.2018.07.007
2018 doi
-
[80]
Young, A
P.M. Young, A. Tweedie, D. Lewis, T. Church, D. Traini, Limitations of high dose carrier based formulations, Int. J. Pharm. 544 (2018) 141–152. doi:10.1016/j.ijpharm.2018.04.012
2018 doi
-
[81]
Longest, L.T
P.W. Longest, L.T. Holbrook, In silico models of aerosol delivery to the respiratory tract - Development and applications, Adv. Drug Deliv. Rev. 64 (2012) 296–311. doi:10.1016/j.addr.2011.05.009
2012 doi
-
[82]
Y. Feng, Z. Xu, A. Haghnegahdar, Computational Fluid-Particle Dynamics Modeling for Unconventional Inhaled Aerosols in Human Respiratory Systems, in: K. Volkov (Ed.), Aerosols - Sci. Case Stud., IntechOpen, London, UK, 2016. doi:10.5772/65361
2016 doi
-
[83]
Lin, M.H
C.-L. Lin, M.H. Tawhai, E.A. Hoffman, Multiscale image-based modeling and simulation of gas flow and particle transport in the human lungs, Interdiscip Rev Syst Biol Med. 5 (2013) 643. doi:10.1038/jid.2014.371
2013 doi
-
[84]
Dolovich, A
M.B. Dolovich, A. Kuttler, T.J. Dimke, O.S. Usmani, Biophysical model to predict lung delivery from a dual bronchodilator dry-powder inhaler, Int. J. Pharm. X. 1 (2019) 100018. doi:10.1016/j.ijpx.2019.100018
2019
-
[85]
extrafine
A.H. De Boer, D. Gjaltema, P. Hagedoorn, H.W. Frijlink, Can “extrafine” dry powder aerosols improve lung deposition?, Eur. J. Pharm. Biopharm. 96 (2015) 143–151. doi:10.1016/j.ejpb.2015.07.016
2015 doi
Reviewed August 5, 2026 · model on record in the stance chip above.
Discussion (0). Continue with ORCID to comment.