REVIEW 4 major objections 4 minor 23 references
Network Meta-Analysis of survival outcomes with non-proportional hazards using flexible M-splines
T0 review · 4 major / 4 minor · reviewed 2026-08-04 · deepseek-v4-flash
Pith's one-line read A weighted random-walk prior makes flexible M-spline network meta-analysis insensitive to knot choice and timescale, so analysts can fit one large-knot model and let shrinkage do the work.
desk verdict A genuinely useful M-spline NMA, well implemented and tested, but the headline claim of knot/timescale invariance is stronger than the evidence supports. read the letter →
The pith
A machine-rendered reading of the paper's core claim, the machinery that carries it, and where it could break.
The reading
What carries the argument
The central mechanism is the M-spline basis for the baseline hazard (integrated to I-splines for survival), with coefficients mapped through a softmax transform to the unit simplex. A weighted random-walk prior is placed on the inverse-softmax coefficients, with step variances weighted by normalized inter-knot distances (Equation 9). These weights make the prior on the baseline hazard invariant to knot spacing, knot count, and timescale, while centering the prior on a constant hazard provides shrinkage. For non-proportional hazards, a multivariate weighted random-walk prior on treatment-specific spline-coefficient effects plays the same role, symmetrically across treatments.
What would settle it
Run the M-spline NMA on the same dataset with two very different knot placements (e.g., quantile-based vs. evenly spaced) and with 5 vs. 20 internal knots, then compare posterior estimates of the baseline hazard and treatment effects; material differences would indicate the invariance claim fails. Alternatively, compute the prior covariance function of the log hazard under the weighted random-walk prior for two different knot vectors with the same number of knots; if the covariances differ, the prior is not strictly invariant.
Extended reading notes
Core claim
On the paper's own terms, the discovery is that a weighted random-walk prior on inverse-softmax transformed M-spline coefficients induces a prior on the baseline hazard that is invariant to knot locations, number of knots, and timescale. The prior is centered on a constant hazard and provides shrinkage, preventing overfitting even when many knots are used. This invariance is achieved by normalizing the random-walk step variances by inter-knot distances and total follow-up time. The paper extends the same prior to treatment effects on spline coefficients, yielding a symmetric non-proportional hazards model that shrinks toward proportional hazards when data are sparse, and it demonstrates that
Load-bearing premise
The invariance of the weighted random-walk prior to knot placement and timescale is the load-bearing premise; it is demonstrated only by prior predictive simulation for selected configurations, not derived analytically, and is acknowledged to be only approximate for degree-zero M-splines.
Editorial extensions
If this is right
- Analysts no longer need to run model selection over fractional polynomial powers; a single M-spline model with a sufficiently large number of knots suffices.
- Bayesian fitting is tractable because the M-spline formulation ensures the cumulative hazard is monotonically increasing by construction, avoiding the sampling difficulties of Royston-Parmar models.
- Non-proportional hazards can be modeled with treatment effects on spline coefficients, enabling predictions for all treatments in any target population, with automatic shrinkage toward proportional hazards where data are sparse.
- The method is implemented in the multinma R package, which supports aggregate data, individual participant data, or mixtures of both, making the approach readily available.
- Extrapolation beyond the observed follow-up shrinks toward a constant proportional hazard, avoiding the unrealistic polynomial tails of fractional polynomial models.
Reading between the lines
- If the invariance property holds generally, it is a portable tool: the same weighted random-walk prior could be applied to other Bayesian spline-based survival models outside network meta-analysis, such as single-arm extrapolation models or joint modeling.
- The symmetry of the non-proportionality effects suggests a way to define consistency equations that do not depend on the choice of reference treatment; this could inspire new diagnostic tools for networks with multi-arm trials.
- A formal analytic derivation of the prior's invariance—for instance, computing the induced prior covariance of the log hazard between two time points under different knot vectors—would turn the simulation-based evidence into a theorem and could provide guidance on how many knots are 'large enough'.
- The method's local fit property (a spline fit between knots is informed only by data up to a few knots later) could be exploited to combine RCT evidence with external long-term data smoothly, potentially improving extrapolation in health technology assessment.
Editorial analysis
A structured set of objections, weighed in public.
Referee Report
Summary. The paper develops a Bayesian network meta-analysis (NMA) model for survival outcomes in which the baseline hazard is modelled with M-splines and a weighted random walk prior is placed on the inverse-softmax transformed spline coefficients. The prior is designed to shrink towards a constant baseline hazard and to be invariant to the number, location, and timescale of knots, so that the analyst need only choose a sufficiently large number of knots. Non-proportional hazards are handled either by stratifying the baseline hazard by treatment arm or by adding treatment-specific coefficients to the spline coefficients under a symmetric multivariate random walk prior. The method is implemented in the multinma R package and applied to a four-study network of progression-free survival in non-small cell lung cancer, with model comparison by LOOIC and an assessment of sensitivity to the number of knots.
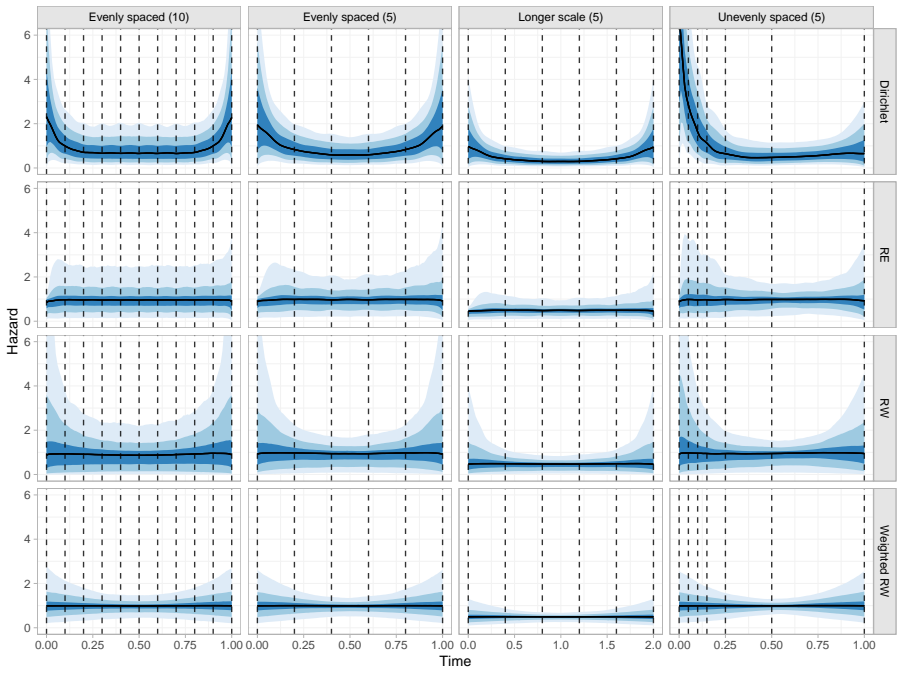
Significance. If the claimed invariance holds, this is a practically important contribution: it would remove model selection from flexible survival NMA and make non-proportional-hazards models routinely usable in Bayesian decision-making contexts. The manuscript is strengthened by a fully implemented R package, reproducible code and data, a realistic case study, and careful LOOIC-based model comparisons. The prior-predictive simulations in Figure 4 are informative and clearly demonstrate a deficiency in previously proposed priors. However, the central invariance claim is supported mainly by prior simulation rather than by analytic derivation or posterior sensitivity analysis, and the non-proportionality part of the model is not checked for invariance. These gaps are load-bearing for the paper's main practical message and need to be addressed before the claims can be accepted as stated.
major comments (4)
- [Random walk shrinkage prior, Eqs. (5)-(9), Fig. 4] The invariance of the prior to knot number, location, and timescale is demonstrated only by prior-predictive simulation, not derived analytically. More importantly, a prior-invariant property does not imply posterior insensitivity: changing the knot vector changes the M-spline function space, and the likelihood can only represent structure expressible by that basis. The single posterior comparison in the case study (8 vs 11 knots, Table A.1 and Fig. A.7) is reassuring but limited to one dataset and does not vary timescale or knot locations. I recommend adding a posterior sensitivity study, either simulated or on the case study, varying L, knot placement rules, and time units, and reporting differences in survival curves, time-varying hazard ratios, and LOOIC. Without such evidence, the abstract's unqualified claim of invariance is overstated.
- [Treatment effects on spline coefficients, Eq. (12)] The multivariate weighted random walk prior on the non-proportionality effects gamma_k is the main new capability of the paper, yet no invariance check, either prior or posterior, is provided for these parameters. The weights and normalisation in Eq. (9) were designed for the baseline hazard coefficients, and their behaviour on the inverse-softmax treatment effect vectors is not self-evident. I ask for at least a prior-predictive figure analogous to Fig. 4 for the implied time-varying hazard ratios under varying knot configurations and timescales, and ideally posterior sensitivity results for the gamma_k estimates in the case study.
- [Appendix A.2] The paper concedes that for degree-zero M-splines (piecewise exponential hazards) the invariance is only approximate, but it does not quantify how close the approximation is. Since piecewise exponential hazards are a common practical choice, the abstract's blanket statement that the weighted random walk prior 'is invariant to the choice of knots and timescale' is too strong. Please either prove the invariance for kappa=1 under the modified weights (Eq. A.4) or state the qualified claim in the abstract and assess the approximation error across uneven knot placements and short intervals.
- [Case study, Fig. A.2 vs A.3] The default common knot vector produced by the proposed quantile-based rule led to sampling problems, and the authors had to manually add a knot at the end of follow-up in the ERACLE study. This manual adjustment undercuts the practical message that the analyst simply needs to specify a sufficiently large number of knots with no tuning. The discussion acknowledges this limitation, but it deserves to be raised as a major point because it directly affects the central usability claim. A robust automatic knot-placement algorithm, or at least a clear warning in the abstract and methods about when manual adjustment is needed, would resolve this.
minor comments (4)
- [Treatment effects on spline coefficients] Typo: 'symetrically' should be 'symmetrically'.
- [Case study] In the text comparing ERACLE with the other study, 'PROSPECT' appears to be a typo for 'PRONOUNCE'.
- [Including covariates, Eq. (13)] The notation \eta_{jk}(\mathbf{x}_{ijk}) uses subscript i, but the linear predictor was defined without an individual subscript. Please clarify how individual-level covariates enter the log hazard rate, especially when only aggregate data are available.
- [Discussion] The claim that this is 'the first time that M-splines have been incorporated within the NMA framework' may be stronger than necessary and could be softened, given prior work on M-splines in related multilevel settings (e.g., Phillippo et al.) and the possibility of unpublished or parallel work.
Circularity Check
No significant circularity: the prior is explicitly constructed and its invariance is demonstrated by prior simulation, not by reusing fitted values or self-citation.
full rationale
The paper's central derivation chain is self-contained. The weighted random walk prior is defined in Eqs (5)-(9) with explicit formulae for the prior mean (Eq 8) and weights (Eq 9); the invariance claim is a property of this prior, verified by prior predictive simulation (Figure 4), not a fitted quantity repackaged as a prediction. The posterior knot-insensitivity claim is supported by an 8-vs-11 knot comparison using LOOIC and survival curves (Table A.1, Fig A.7); LOOIC is a leave-one-out predictive criterion computed from the posterior, not a parameter fitted to the outcome being predicted. Self-citations (Phillippo, Dias, et al. 2024) point to earlier use of the same prior and to the ML-NMR framework, but the prior is fully described and evaluated in this paper, so the citation is not load-bearing. The paper explicitly notes residual limitations—knot placement near end of follow-up can cause sampling problems (Discussion) and piecewise-exponential invariance is only approximate (Appendix A.2)—which are honest caveats, not circular steps. No equation in the paper is equivalent to its inputs by construction.
Assumptions & free parameters
free parameters (6)
- Number of internal knots L =
7 (default)
- M-spline order kappa =
4 (cubic)
- Prior SD for random walk sigma_j =
half-N(0, 1/2)
- Common smoothing SD sigma^(alpha) prior =
half-N(0, 1/2)
- Correlation matrix P off-diagonal =
0.5
- Knot placement rule =
quantiles of observed event times
assumptions (6)
- standard math Ramsay (1988) M-spline recursion yields non-negative basis functions with integral 1 between boundary knots
- standard math Softmax and inverse-softmax transformations map between real space and the unit simplex
- domain assumption NMA consistency equations d_ab = d_b - d_a and exchangeability of relative effects
- domain assumption Reconstructed IPD from digitised K-M curves via Guyot et al. (2012) are treated as the true event and censoring times
- ad hoc to paper Normalising the random walk weights to sum to 1 makes the prior total variation independent of knot number and timescale
- domain assumption A common knot vector across all studies is required for the non-proportional hazards model with treatment effects on spline coefficients
Cite this review
Pith. "Pith review of Network Meta-Analysis of survival outcomes with non-proportional hazards using flexible M-splines." pith.science (2026). https://pith.science/paper/5DZDJAGO
@misc{pith2026250910383,
  author       = {Pith},
  title        = {Pith review of: Network Meta-Analysis of survival outcomes with non-proportional hazards using flexible M-splines},
  year         = {2026},
  howpublished = {\url{https://pith.science/paper/5DZDJAGO}},
  note         = {Machine review of arXiv:2509.10383}
}
read the original abstract
Network meta-analysis (NMA) is widely used in healthcare decision-making, where estimates of the effect of multiple treatments on outcomes are required. For time-to-event outcomes such as survival or disease progression the most common approach is to model log hazard ratios; however, this relies on the proportional hazards assumption. Novel treatments such as immunotherapies are expected to display complex hazard functions that cannot be captured by standard parametric models, which results in non-proportional hazards when comparing treatments from different classes. As a result, alternative models such as fractional polynomials or restricted cubic splines are often used. These allow substantial flexibility on the shape of the baseline hazard, but require time-consuming model selection or are intractable for Bayesian analysis. We propose a flexible NMA model using M-splines on the baseline hazard, with a novel weighted random walk prior distribution that provides shrinkage to avoid overfitting and is invariant to the choice of knots and timescale. Non-proportional hazards are modelled either by stratifying by treatment or by introducing treatment effects on the spline coefficients, and covariates may be included on the log hazard rate and spline coefficients. Treatment and covariate effects on the spline coefficients are given random walk prior distributions to smoothly model departures from proportionality over time. The methods are implemented in the user-friendly R package multinma, which supports analyses with aggregate data, individual participant data, or mixtures of both. We apply the methods to a NMA of progression-free survival with treatments for non-small cell lung cancer.
Figures


Figures from the paper (3 more)


Reference graph
Works this paper leans on
-
[1]
BayesianSurvivalAnalysisUsingtherstanarmRPackage
Brilleman,S.L.etal.(Feb.22,2020).“BayesianSurvivalAnalysisUsingtherstanarmRPackage”. In:doi:10.48550/ARXIV.2002.09633. arXiv:2002.09633 [stat.CO]. Carpenter,B.etal.(2017).“Stan:AProbabilisticProgrammingLanguage”.In:JournalofStatistical Software76.1.doi:10.18637/jss.v076.i01
-
[2]
Dias, S., N. J. Welton, A. J. Sutton, and A. E. Ades (2011).NICE DSU Technical Support Document 2: A generalised linear modelling framework for pair-wise and network meta-analysis of randomised controlled trials. Tech. rep. National Institute for Health and Care Excellence.url:http: //www.nicedsu.org.uk
2011
-
[3]
Dias, S., N. J. Welton, A. J. Sutton, D. M. Caldwell, et al. (2011).NICE DSU Technical Support Document 4: Inconsistency in networks of evidence based on randomised controlled trials. Tech. rep. National Institute for Health and Care Excellence.url:http://www.nicedsu.org.uk
2011
-
[4]
Dias, S., A. E. Ades, et al. (Jan. 2018).Network Meta-Analysis for Decision Making. Statistics in Practice. Hoboken, NJ: Wiley.isbn: 9781118647509.doi:10.1002/9781118951651. 23
-
[5]
Bayesian one-step IPD network meta-analysis of time-to-event data using Royston-Parmar models
Freeman, S. C. and J. R. Carpenter (July 2017). “Bayesian one-step IPD network meta-analysis of time-to-event data using Royston-Parmar models”. In:Research Synthesis Methods8.4, pp. 451–464.doi:10.1002/jrsm.1253
-
[6]
Guyot, P. et al. (Feb. 2012). “Enhanced secondary analysis of survival data: reconstructing the data from published Kaplan-Meier survival curves”. In:BMC Medical Research Methodology 12.1.doi:10.1186/1471-2288-12-9
-
[7]
Borrowing strength from external trials in a meta-analysis
Higgins, J. P. T. and A. Whitehead (Dec. 1996). “Borrowing strength from external trials in a meta-analysis”. In:Statistics in Medicine15.24, pp. 2733–2749.doi:10.1002/(sici)1097- 0258(19961230)15:24<2733::aid-sim562>3.0.co;2-0. Incerti,D.etal.(May2019).“RYouStillUsingExcel?TheAdvantagesofModernSoftwareTools for Health Technology Assessment”. In:Value in ...
-
[8]
survextrap: a package for flexible and transparent survival extrapo- lation
Jackson, C. H. (Nov. 2023). “survextrap: a package for flexible and transparent survival extrapo- lation”. In:BMC Medical Research Methodology23.1.issn: 1471-2288.doi:10.1186/s12874- 023-02094-1
doi:10.1186/s12874- 2023
Show all 23 references
-
[9]
Network meta-analysis of survival data with fractional polynomials
Jansen, J. P. (May 2011). “Network meta-analysis of survival data with fractional polynomials”. In:BMC Medical Research Methodology11.1.doi:10.1186/1471-2288-11-61
2011 doi
-
[10]
Additive and multiplicative covariate regression models for relative survival incorporating fractional polynomials for time-dependent effects
Lambert, P. C. et al. (Nov. 2005). “Additive and multiplicative covariate regression models for relative survival incorporating fractional polynomials for time-dependent effects”. In: Statistics in Medicine24.24, pp. 3871–3885.issn: 1097-0258.doi:10.1002/sim.2399
2005 doi
-
[11]
General P-Splines for Non-Uniform B-Splines
Li, Z. and J. Cao (Jan. 2022). “General P-Splines for Non-Uniform B-Splines”. In:doi:10.48550/ ARXIV.2201.06808. arXiv:2201.06808 [stat.ME]. Lu,G.B.andA.E.Ades(2004).“Combinationofdirectandindirectevidenceinmixedtreatment comparisons”. In:Statistics in Medicine23.20, pp. 3105–...
-
[12]
Network meta-analysis of parametricsurvivalcurves
Ouwens, M. J. N. M., Z. Philips, and J. P. Jansen (July 2010). “Network meta-analysis of parametricsurvivalcurves”.In:ResearchSynthesisMethods1.3–4,pp.258–271.issn:1759-2887. doi:10.1002/jrsm.25
2010 doi
-
[13]
A Guide to Selecting Flexible Survival Models to Inform Economic EvaluationsofCancerImmunotherapies
Palmer, S. et al. (Feb. 2023). “A Guide to Selecting Flexible Survival Models to Inform Economic EvaluationsofCancerImmunotherapies”.In:ValueinHealth26.2,pp.185–192.issn:1098-3015. doi:10.1016/j.jval.2022.07.009. 24
2023 doi
-
[14]
Phillippo, D. M., A. E. Ades, et al. (2016).NICE DSU Technical Support Document 18: Methods for population-adjusted indirect comparisons in submission to NICE. Tech. rep. National Institute for Health and Care Excellence.url:http://www.nicedsu.org.uk
2016
-
[15]
Multilevel network meta-regression for general likelihoods:synthesisofindividualandaggregatedatawithapplicationstosurvivalanalysis
Phillippo, D. M., S. Dias, et al. (Jan. 2024). “Multilevel network meta-regression for general likelihoods:synthesisofindividualandaggregatedatawithapplicationstosurvivalanalysis”. In:arXiv.doi:10.48550/arXiv.2401.12640. arXiv:2401.12640 [stat.ME]
-
[16]
Phillippo, D. M. (2024).multinma: Network Meta-Analysis of Individual and Aggregate Data in Stan. Version 0.7.2. R package.doi:10 . 5281 / zenodo . 3904454.url: https : / / cran . r - project.org/package=multinma. R Core Team (2024).R: A Language and Environment for Statistica...
2024
-
[17]
Monotone Regression Splines in Action
Ramsay, J. O. (Nov. 1988). “Monotone Regression Splines in Action”. In:Statistical Science3.4. doi:10.1214/ss/1177012761
1988
-
[18]
Regression Using Fractional Polynomials of Continuous Covariates: Parsimonious Parametric Modelling
Royston, P. and D. G. Altman (1994). “Regression Using Fractional Polynomials of Continuous Covariates: Parsimonious Parametric Modelling”. In:Applied Statistics43.3, p. 429.issn: 0035-9254.doi:10.2307/2986270
1994 doi
-
[19]
Flexible parametric proportional-hazards and proportional-odds models for censored survival data, with application to prognostic mod- elling and estimation of treatment effects
Royston, P. and M. K. B. Parmar (July 2002). “Flexible parametric proportional-hazards and proportional-odds models for censored survival data, with application to prognostic mod- elling and estimation of treatment effects”. In:Statistics in Medicine21.15, pp. 2175–2197.issn: ...
2002 doi
-
[20]
Rutherford, M. J. et al. (2020).NICE DSU Technical Support Document 21: Flexible Methods for Survival Analysis. Tech. rep. National Institute for Health and Care Excellence.url: http://www.nicedsu.org.uk
2020
-
[21]
Therneau, T. M. and P. M. Grambsch (Sept. 2000).Modeling Survival Data: Extending the Cox Model. Statistics for Biology and Health. New York: Springer-Verlag.isbn: 0387987843
2000
-
[22]
Practical Bayesian model evaluation using leave-one-out cross-validation and WAIC
Vehtari, A., A. Gelman, and J. Gabry (Aug. 2016). “Practical Bayesian model evaluation using leave-one-out cross-validation and WAIC”. In:Statistics and Computing27.5, pp. 1413–1432. doi:10.1007/s11222-016-9696-4. 25
2016 doi
-
[23]
Shape-Restricted Regression Splines with R Package splines2
Wang, W. and J. Yan (2021). “Shape-Restricted Regression Splines with R Package splines2”. In: Journal of Data Science, pp. 498–517.doi:10.6339/21-jds1020. 26 A Appendix A.1 Definition of M-spline basis The M-spline and I-spline bases are constructed using the recursive formul...
2021 doi
Reviewed August 4, 2026 · model on record in the stance chip above.
Discussion (0). Continue with ORCID to comment.