LubDubDecoder: Bringing Micro-Mechanical Cardiac Monitoring to Hearables
Pith reviewed 2026-05-18 17:27 UTC · model grok-4.3
The pith
Built-in speakers in hearables can capture coarse heart sounds and reconstruct subtle micro-cardiac vibrations for valve timing.
A machine-rendered reading of the paper's core claim, the machinery that carries it, and where it could break.
Core claim
The central claim is that the built-in speaker common to all hearables can be operated as an acoustic sensor to record coarse lub-dub heart sounds, which share enough temporal and spectral structure with the finer mechanical vibrations to allow reconstruction of seismocardiography and gyrocardiography waveforms and extraction of micro-cardiac event timings.
What carries the argument
LubDubDecoder system that converts the built-in speaker into an acoustic sensor and reconstructs SCG and GCG waveforms from shared structure in lub-dub sounds.
If this is right
- Any hearable device can add micro-cardiac monitoring without new transducers or batteries.
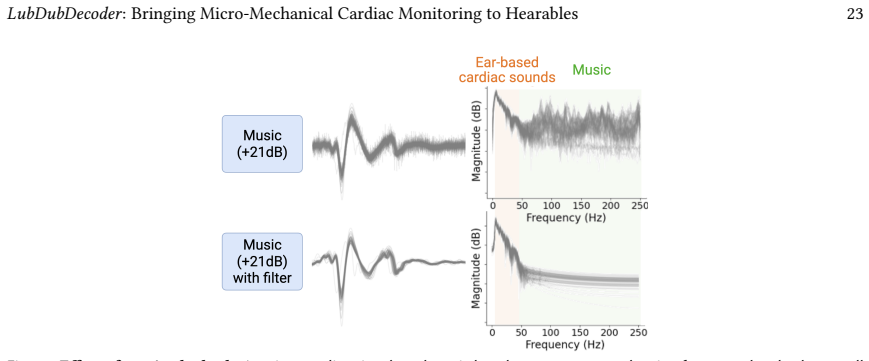
- Key heart-valve opening and closing times become available during normal wear, including while music plays.
- The same reconstruction works across different hearable models after a simple zero-effort adaptation step.
- Remounting the device does not break the signal quality in repeated daily use.
Where Pith is reading between the lines
- The same speaker-to-sensor trick could be tested on other body sounds such as breathing or joint motion.
- Integration with existing audio health features in earbuds might create always-on cardiac dashboards for users.
- If the reconstruction holds in larger populations, it could reduce reliance on separate chest-worn monitors for routine checks.
Load-bearing premise
Coarse heart sounds recorded by the speaker contain enough shared timing and frequency information to accurately rebuild the subtle chest-level mechanical vibrations.
What would settle it
A controlled test in which reconstructed waveforms from the hearable show correlation below 0.7 with simultaneous chest-mounted reference SCG and GCG signals across multiple users and sessions.
Figures


read the original abstract
We present LubDubDecoder, a system that enables fine-grained monitoring of micro-cardiac vibrations associated with the opening and closing of heart valves across a range of hearables. Our system transforms the built-in speaker, the only transducer common to all hearables, into an acoustic sensor that captures the coarse "lub-dub" heart sounds, leverages their shared temporal and spectral structure to reconstruct the subtle seismocardiography (SCG) and gyrocardiography (GCG) waveforms, and extract the timing of key micro-cardiac events. In an IRB-approved feasibility study with 25 users, our system achieves correlations of 0.88-0.95 compared to chest-mounted reference measurements in within-user and cross-user evaluations, and generalizes to unseen hearables using a zero-effort adaptation scheme with a correlation of 0.91. Our system is robust across remounting sessions and music playback.
Editorial analysis
A structured set of objections, weighed in public.
Referee Report
Summary. The paper presents LubDubDecoder, a system that repurposes the built-in speaker in hearables as an acoustic sensor to capture coarse 'lub-dub' heart sounds. It leverages assumed shared temporal and spectral structure between these sounds and micro-mechanical cardiac vibrations to reconstruct seismocardiography (SCG) and gyrocardiography (GCG) waveforms, then extracts timing of key events. In an IRB-approved feasibility study with 25 users, the system reports correlations of 0.88-0.95 against chest-mounted reference sensors for within-user and cross-user cases, plus 0.91 correlation for generalization to unseen hearables via zero-effort adaptation; robustness to remounting and music playback is also claimed.
Significance. If the reconstruction claims hold with rigorous validation, the work could enable practical micro-cardiac monitoring on ubiquitous consumer hearables without extra hardware, advancing accessible health sensing in HCI and wearable computing. The zero-effort adaptation and use of a common transducer are practical strengths that could support broader deployment if the underlying signal fidelity is confirmed.
major comments (3)
- [Reconstruction method] Reconstruction method (Section 3 / equivalent): The central claim rests on transforming coarse acoustic lub-dub signals into subtle SCG/GCG waveforms via 'shared temporal and spectral structure,' yet no explicit mapping, basis functions, loss term, or architectural details are provided to establish that the inversion is unique rather than a learned correlation on the study cohort. This directly affects whether the 0.88-0.95 correlations demonstrate true waveform fidelity or primarily valve-event alignment.
- [Results and evaluation] Results and evaluation (Section 4 / equivalent): The reported correlations of 0.88-0.95 (within/cross-user) and 0.91 (unseen devices) are presented without accompanying details on the full signal-processing pipeline, model training procedure, error bars, statistical tests, or data exclusion criteria from the 25-user IRB study. These omissions are load-bearing for assessing whether the numbers support the reconstruction and generalization claims.
- [Zero-effort adaptation] Zero-effort adaptation for unseen hearables (Section 5 / equivalent): The hardware-invariance assumption underlying the 0.91 correlation requires concrete evidence (e.g., feature invariance analysis or cross-device spectral comparison) that the acoustic channel preserves sufficient SCG/GCG content across different speaker transducers; without it, the adaptation result risks being cohort-specific rather than general.
minor comments (2)
- [Abstract] The abstract would benefit from briefly naming the specific hearable models or form factors tested in the generalization experiment.
- [Figures] Figure captions for any waveform comparison plots should explicitly state the time and amplitude scales used for visual assessment of reconstruction quality.
Simulated Author's Rebuttal
We thank the referee for their constructive and detailed feedback. We address each major comment point by point below, providing clarifications from the manuscript and committing to revisions that strengthen the presentation of methods, results, and generalization claims without altering the core findings.
read point-by-point responses
-
Referee: [Reconstruction method] Reconstruction method (Section 3 / equivalent): The central claim rests on transforming coarse acoustic lub-dub signals into subtle SCG/GCG waveforms via 'shared temporal and spectral structure,' yet no explicit mapping, basis functions, loss term, or architectural details are provided to establish that the inversion is unique rather than a learned correlation on the study cohort. This directly affects whether the 0.88-0.95 correlations demonstrate true waveform fidelity or primarily valve-event alignment.
Authors: We appreciate this observation on the reconstruction approach. Section 3 describes a convolutional encoder-decoder network that exploits shared temporal alignments (e.g., S1/S2 timing) and spectral bands (10-100 Hz overlap between acoustic and micro-mechanical signals) via learned filters and attention layers. The training objective combines Pearson correlation loss on the full waveform with an auxiliary peak-detection loss for event timing. To directly address uniqueness versus event alignment, the revised manuscript will add the complete architecture specification (layer counts, kernel sizes, activation functions), the exact weighted loss formulation, and an ablation study demonstrating that spectral and temporal components contribute to morphology preservation beyond peak alignment alone (measured via dynamic time warping and frequency-domain correlation). revision: yes
-
Referee: [Results and evaluation] Results and evaluation (Section 4 / equivalent): The reported correlations of 0.88-0.95 (within/cross-user) and 0.91 (unseen devices) are presented without accompanying details on the full signal-processing pipeline, model training procedure, error bars, statistical tests, or data exclusion criteria from the 25-user IRB study. These omissions are load-bearing for assessing whether the numbers support the reconstruction and generalization claims.
Authors: We agree that expanded evaluation details are essential for assessing the reported correlations. The current Section 4 summarizes the 25-user IRB-approved study but will be revised to include: the complete preprocessing pipeline (band-pass filtering parameters, segmentation windows, normalization); training procedure (5-fold cross-validation splits, Adam optimizer with learning rate 1e-4, batch size 32, 150 epochs, early stopping); error bars as mean ± standard deviation across users and folds; statistical significance via paired Wilcoxon signed-rank tests with p-values; and exclusion criteria (2 users excluded for SNR < 10 dB due to motion artifacts, per pre-registered protocol). These additions will be incorporated to support reproducibility and claim validity. revision: yes
-
Referee: [Zero-effort adaptation] Zero-effort adaptation for unseen hearables (Section 5 / equivalent): The hardware-invariance assumption underlying the 0.91 correlation requires concrete evidence (e.g., feature invariance analysis or cross-device spectral comparison) that the acoustic channel preserves sufficient SCG/GCG content across different speaker transducers; without it, the adaptation result risks being cohort-specific rather than general.
Authors: The 0.91 correlation was obtained by training on data from one hearable model and evaluating zero-shot on a distinct unseen model in the 25-user cohort. To substantiate the hardware-invariance assumption, the revision will add a cross-device analysis: spectral power density plots demonstrating overlap in the 5-50 Hz cardiac band across the two transducers, plus t-SNE visualizations and cosine similarity metrics on learned embeddings showing feature distribution invariance. This evidence will confirm that the acoustic channel retains sufficient micro-mechanical content for generalization beyond the specific cohort. revision: yes
Circularity Check
No circularity: central claims validated against independent chest-mounted references
full rationale
The paper describes transforming a built-in speaker into an acoustic sensor to capture coarse lub-dub sounds and reconstruct SCG/GCG waveforms by leveraging shared temporal and spectral structure. However, the reported correlations (0.88-0.95 within/cross-user, 0.91 for unseen hearables) are obtained via direct comparison to external chest-mounted reference sensors in a 25-user IRB study, not derived from fitted parameters or self-citations within the same data. No equations, self-citation chains, or uniqueness theorems are presented that reduce any prediction to its inputs by construction. The derivation chain remains self-contained against external benchmarks.
Axiom & Free-Parameter Ledger
Lean theorems connected to this paper
-
IndisputableMonolith/Cost/FunctionalEquation.leanwashburn_uniqueness_aczel unclear?
unclearRelation between the paper passage and the cited Recognition theorem.
leverages their shared temporal and spectral structure to reconstruct the subtle seismocardiography (SCG) and gyrocardiography (GCG) waveforms
-
IndisputableMonolith/Foundation/RealityFromDistinction.leanreality_from_one_distinction unclear?
unclearRelation between the paper passage and the cited Recognition theorem.
zero-effort adaptation scheme with a correlation of 0.91
What do these tags mean?
- matches
- The paper's claim is directly supported by a theorem in the formal canon.
- supports
- The theorem supports part of the paper's argument, but the paper may add assumptions or extra steps.
- extends
- The paper goes beyond the formal theorem; the theorem is a base layer rather than the whole result.
- uses
- The paper appears to rely on the theorem as machinery.
- contradicts
- The paper's claim conflicts with a theorem or certificate in the canon.
- unclear
- Pith found a possible connection, but the passage is too broad, indirect, or ambiguous to say the theorem truly supports the claim.
Forward citations
Cited by 1 Pith paper
-
DropleX: Liquid sensing on tablet touchscreens
DropleX disables tablet touchscreen adaptive filters via a physics-informed approach and uses signal processing plus learning to detect microliter liquids and adulterants in beverages with 86-99% accuracy under lab co...
Reference graph
Works this paper leans on
-
[1]
Avantree Resolve – Wired Open-Ear Earbuds
2025. Avantree Resolve – Wired Open-Ear Earbuds. https://www.amazon.com/dp/B0B4JV5K4B
work page 2025
-
[2]
2025. AWR1443BOOST. https://www.digikey.com/en/products/detail/texas-instruments/AWR1443BOOST/9860052
- [3]
-
[4]
Get help in an emergency with Google Pixel Watch safety features
2025. Get help in an emergency with Google Pixel Watch safety features. https://support.google.com/googlepixelwatch/answer/12663810
-
[5]
2025. Hearing aid brands & models. https://www.hearinglife.com/hearing-aids/models-and-brands
work page 2025
-
[6]
2025. How Do I Recalibrate the Galaxy Watch? https://www.samsung.com/sg/support/apps-services/how-do-i-recalibrate-the-galaxy-watch/
work page 2025
-
[7]
The rise of open earbuds: challenges and opportunities
2025. The rise of open earbuds: challenges and opportunities. https://www.canalys.com/insights/rise-of-open-earbuds-challenges-and-opportunities
work page 2025
-
[8]
Use Fall Detection with Apple Watch
2025. Use Fall Detection with Apple Watch. https://support.apple.com/en-us/108896
work page 2025
-
[9]
Use the Detect fall feature on your Samsung smart watch
2025. Use the Detect fall feature on your Samsung smart watch. https://www.samsung.com/us/support/answer/ANS10003423/
work page 2025
-
[10]
Use the Hearing Aid feature on your AirPods Pro 2
2025. Use the Hearing Aid feature on your AirPods Pro 2. https://support.apple.com/en-us/120992
work page 2025
-
[11]
Wafik Farah Andrawes, Caroline Bussy, and Joël Belmin. 2005. Prevention of cardiovascular events in elderly people.Drugs & aging22, 10 (2005), 859–876
work page 2005
-
[12]
Rachael R Baiduc, Joshua W Sun, Caitlin M Berry, Melinda Anderson, and Eric A Vance. 2023. Relationship of cardiovascular disease risk and hearing loss in a clinical population.Scientific reports13, 1 (2023), 1642
work page 2023
-
[13]
Pierre Boutouyrie, Patrick Lacolley, Marie Briet, Véronique Regnault, Alice Stanton, Stéphane Laurent, and Azra Mahmud. 2011. Pharmacological modulation of arterial stiffness.Drugs71 (2011), 1689–1701
work page 2011
-
[14]
Kayla-Jade Butkow, Ting Dang, Andrea Ferlini, Dong Ma, and Cecilia Mascolo. 2023. hEARt: Motion-resilient heart rate monitoring with in-ear microphones. In2023 IEEE International Conference on Pervasive Computing and Communications (PerCom). IEEE, 200–209
work page 2023
-
[15]
Alvin Cao, Ken Christofferson, Parker Ruth, Naveed Rabbani, Yuanchun Shi, Alex Mariakakis, Yuntao Wang, and Shwetak Patel. 2024. EarSteth: Cardiac Auscultation Audio Reconstruction Using Earbuds. In2024 46th Annual International Conference of the IEEE Engineering in Medicine and Biology Society (EMBC). IEEE, 1–4
work page 2024
-
[16]
Tao Chen, Yongjie Yang, Xiaoran Fan, Xiuzhen Guo, Jie Xiong, and Longfei Shangguan. 2024. Exploring the feasibility of remote cardiac auscultation using earphones. InProceedings of the 30th Annual International Conference on Mobile Computing and Networking. 357–372
work page 2024
-
[17]
Wade Chien and Frank R Lin. 2012. Prevalence of hearing aid use among older adults in the United States.Archives of internal medicine172, 3 (2012), 292–293
work page 2012
-
[18]
M Di Rienzo, E Vaini, P Castiglioni, G Merati, P Meriggi, G Parati, A Faini, and F Rizzo. 2013. Wearable seismocardiography: Towards a beat-by-beat assessment of cardiac mechanics in ambulant subjects.Autonomic Neuroscience178, 1-2 (2013), 50–59
work page 2013
-
[19]
Xiaoran Fan, David Pearl, Richard Howard, Longfei Shangguan, and Trausti Thormundsson. 2023. APG: Audioplethysmography for cardiac monitoring in hearables. InProceedings of the 29th Annual International Conference on Mobile Computing and Networking. 1–15. Manuscript submitted to ACM LubDubDecoder: Bringing Micro-Mechanical Cardiac Monitoring to Hearables 27
work page 2023
-
[20]
Xiaoran Fan, Longfei Shangguan, Siddharth Rupavatharam, Yanyong Zhang, Jie Xiong, Yunfei Ma, and Richard Howard. 2021. HeadFi: bringing intelligence to all headphones. InProceedings of the 27th Annual International Conference on Mobile Computing and Networking. 147–159
work page 2021
-
[21]
Stanley S Franklin, Lutgarde Thijs, Tine W Hansen, Eoin O’brien, and Jan A Staessen. 2013. White-coat hypertension: new insights from recent studies.Hypertension62, 6 (2013), 982–987
work page 2013
- [22]
-
[23]
Francis Roosevelt Gilliam III, Robert Ciesielski, Karlen Shahinyan, Pratistha Shakya, John Cunsolo, Jal Mahendra Panchal, Bartlomiej Król-Józaga, Monika Król, Olivia Kierul, Charles Bridges, et al. 2022. In-ear infrasonic hemodynography with a digital health device for cardiovascular monitoring using the human audiome.NPJ Digital Medicine5, 1 (2022), 189
work page 2022
-
[24]
Guilherme Veiga Guimarães, Emmanuel Gomes Ciolac, Vitor Oliveira Carvalho, Veridiana Moraes D’Avila, Luiz Aparecido Bortolotto, and Edimar Alcides Bocchi. 2010. Effects of continuous vs. interval exercise training on blood pressure and arterial stiffness in treated hypertension. Hypertension Research33, 6 (2010), 627–632
work page 2010
-
[25]
Shikha Gupta, Jafreezal Jaafar, WF Wan Ahmad, and Arpit Bansal. 2013. Feature extraction using MFCC.Signal & Image Processing: An International Journal4, 4 (2013), 101–108
work page 2013
-
[26]
Viatcheslav Gurev, Kouhyar Tavakolian, Jason Constantino, Bozena Kaminska, Andrew P Blaber, and Natalia A Trayanova. 2012. Mechanisms underlying isovolumic contraction and ejection peaks in seismocardiogram morphology.Journal of medical and biological engineering32, 2 (2012), 103
work page 2012
-
[27]
Unsoo Ha, Salah Assana, and Fadel Adib. 2020. Contactless seismocardiography via deep learning radars. InProceedings of the 26th annual international conference on mobile computing and networking. 1–14
work page 2020
-
[28]
Amin Hossein, Elza Abdessater, Paniz Balali, Elliot Cosneau, Damien Gorlier, Jérémy Rabineau, Alexandre Almorad, Vitalie Faoro, and Philippe Van De Borne. 2024. Smartphone-Derived Seismocardiography: Robust Approach for Accurate Cardiac Energy Assessment in Patients with Various Cardiovascular Conditions.Sensors24, 7 (2024), 2139
work page 2024
-
[29]
Zuhair Iftikhar, Olli Lahdenoja, Mojtaba Jafari Tadi, Tero Hurnanen, Tuija Vasankari, Tuomas Kiviniemi, Juhani Airaksinen, Tero Koivisto, and Mikko Pänkäälä. 2018. Multiclass classifier based cardiovascular condition detection using smartphone mechanocardiography.Scientific reports8, 1 (2018), 9344
work page 2018
-
[30]
Omer T Inan, Maziyar Baran Pouyan, Abdul Q Javaid, Sean Dowling, Mozziyar Etemadi, Alexis Dorier, J Alex Heller, A Ozan Bicen, Shuvo Roy, Teresa De Marco, et al. 2018. Novel wearable seismocardiography and machine learning algorithms can assess clinical status of heart failure patients. Circulation: Heart Failure11, 1 (2018), e004313
work page 2018
-
[31]
Mojtaba Jafari Tadi, Eero Lehtonen, Antti Saraste, Jarno Tuominen, Juho Koskinen, Mika Teräs, Juhani Airaksinen, Mikko Pänkäälä, and Tero Koivisto
-
[32]
Gyrocardiography: A new non-invasive monitoring method for the assessment of cardiac mechanics and the estimation of hemodynamic variables.Scientific reports7, 1 (2017), 6823
work page 2017
-
[33]
Milan Jilek, Daniel Šuta, and Josef Syka. 2014. Reference hearing thresholds in an extended frequency range as a function of age.The Journal of the Acoustical Society of America136, 4 (2014), 1821–1830
work page 2014
-
[34]
Daniel W Jones, Lawrence J Appel, Sheldon G Sheps, Edward J Roccella, and Claude Lenfant. 2003. Measuring blood pressure accurately: new and persistent challenges.Jama289, 8 (2003), 1027–1030
work page 2003
-
[35]
Iwona Korzeniowska-Kubacka, Maria Bilińska, and Ryszard Piotrowicz. 2005. Usefulness of seismocardiography for the diagnosis of ischemia in patients with coronary artery disease.Annals of noninvasive electrocardiology10, 3 (2005), 281–287
work page 2005
-
[36]
Hyoung Youn Lee, Yong Hun Jung, Kyung Woon Jeung, Dong Hun Lee, Byung Kook Lee, Geuk Young Jang, Tong In Oh, Najmiddin Mamadjonov, and Tag Heo. 2021. Discrimination between the presence and absence of spontaneous circulation using smartphone seismocardiography: A preliminary investigation.Resuscitation166 (2021), 66–73
work page 2021
-
[37]
Kaylee Yaxuan Li, Yasha Iravantchi, Hyunmin Park, Yiming Liu, and Alanson Sample. [n. d.]. ECG Signal Construction From Heart Sounds via Single Node, Surface Acoustic Sensing. InEMBC ’24
-
[38]
Kaylee Yaxuan Li, Yasha Iravantchi, Hyunmin Park, Yiming Liu, and Alanson Sample. 2024. ECG Signal Construction From Heart Sounds via Single Node, Surface Acoustic Sensing. In2024 46th Annual International Conference of the IEEE Engineering in Medicine and Biology Society (EMBC). IEEE, 1–4
work page 2024
-
[39]
Mavuto M Mukaka. 2012. A guide to appropriate use of correlation coefficient in medical research.Malawi medical journal24, 3 (2012), 69–71
work page 2012
-
[40]
Keya Pandia, Omer T Inan, Gregory TA Kovacs, and Laurent Giovangrandi. 2012. Extracting respiratory information from seismocardiogram signals acquired on the chest using a miniature accelerometer.Physiological measurement33, 10 (2012), 1643
work page 2012
-
[41]
Mikko Pänkäälä, Tero Koivisto, Olli Lahdenoja, Tuomas Kiviniemi, Antti Saraste, Tuija Vasankari, and Juhani Airaksinen. 2016. Detection of atrial fibrillation with seismocardiography. In2016 38th Annual International Conference of the IEEE Engineering in Medicine and Biology Society (EMBC). IEEE, 4369–4374
work page 2016
-
[42]
Jonathan P Piccini, Bradley G Hammill, Moritz F Sinner, Adrian F Hernandez, Allan J Walkey, Emelia J Benjamin, Lesley H Curtis, and Susan R Heckbert. 2014. Clinical course of atrial fibrillation in older adults: the importance of cardiovascular events beyond stroke.European heart journal 35, 4 (2014), 250–256
work page 2014
-
[43]
Thomas G Pickering, William Gerin, and Amy R Schwartz. 2002. What is the white-coat effect and how should it be measured?Blood pressure monitoring7, 6 (2002), 293–300. Manuscript submitted to ACM 28 Zhang et al
work page 2002
-
[44]
Deepak Rai, Hiren Kumar Thakkar, Shyam Singh Rajput, Jose Santamaria, Chintan Bhatt, and Francisco Roca. 2021. A comprehensive review on seismocardiogram: current advancements on acquisition, annotation, and applications.Mathematics9, 18 (2021), 2243
work page 2021
-
[45]
Prasan Kumar Sahoo, Hiren Kumar Thakkar, Wen-Yen Lin, Po-Cheng Chang, and Ming-Yih Lee. 2018. On the design of an efficient cardiac health monitoring system through combined analysis of ECG and SCG signals.Sensors18, 2 (2018), 379
work page 2018
-
[46]
David M Salerno and John Zanetti. 1991. Seismocardiography for monitoring changes in left ventricular function during ischemia.Chest100, 4 (1991), 991–993
work page 1991
-
[47]
David M Salerno, John M Zanetti, Liviu C Poliac, Richard S Crow, Peter J Hannan, Kyuhyun Wang, Irvin F Goldenberg, and Robert A Van Tassel
-
[48]
Exercise seismocardiography for detection of coronary artery disease.American journal of noninvasive cardiology6, 5 (1992), 321–330
work page 1992
-
[49]
Richard H Sandler, Md Khushidul Azad, John D’Angelo, Peshala Gamage, Nirav Y Raval, Robert J Mentz, and Hansen A Mansy. 2020. Documenting spatial variation of SCG signals for optimal sensor placement.Journal of Cardiac Failure26, 10 (2020), S92
work page 2020
-
[50]
Mobashir Md Hasan Shandhi, Joanna Fan, J Alex Heller, Mozziyar Etemadi, Omer T Inan, and Liviu Klein. 2019. Seismocardiography and machine learning algorithms to assess clinical status of patients with heart failure in cardiopulmonary exercise testing.Journal of Cardiac Failure25, 8 (2019), S64–S65
work page 2019
-
[51]
Shigeki Shibata, Naoki Fujimoto, Jeffrey L Hastings, Graeme Carrick-Ranson, Paul S Bhella, Christopher M Hearon Jr, and Benjamin D Levine. 2018. The effect of lifelong exercise frequency on arterial stiffness.The Journal of physiology596, 14 (2018), 2783–2795
work page 2018
-
[52]
Szymon Sieciński, Paweł S Kostka, and Ewaryst J Tkacz. 2020. Gyrocardiography: A review of the definition, history, waveform description, and applications.Sensors20, 22 (2020), 6675
work page 2020
-
[53]
Brian E Solar, Amirtaha Taebi, and Hansen A Mansy. 2017. Classification of seismocardiographic cycles into lung volume phases. In2017 IEEE Signal Processing in Medicine and Biology Symposium (SPMB). IEEE, 1–2
work page 2017
-
[54]
Michael A Stone, Anna M Paul, Patrick Axon, and Brian CJ Moore. 2014. A technique for estimating the occlusion effect for frequencies below 125 Hz.Ear and hearing35, 1 (2014), 49–55
work page 2014
-
[55]
Xue Sun, Jie Xiong, Chao Feng, Wenwen Deng, Xudong Wei, Dingyi Fang, and Xiaojiang Chen. 2023. EarMonitor: In-ear motion-resilient acoustic sensing using commodity earphones.Proceedings of the ACM on Interactive, Mobile, Wearable and Ubiquitous Technologies6, 4 (2023), 1–22
work page 2023
-
[56]
Mojtaba Jafari Tadi, Eero Lehtonen, Tero Hurnanen, Juho Koskinen, Jonas Eriksson, Mikko Pänkäälä, Mika Teräs, and Tero Koivisto. 2016. A real-time approach for heart rate monitoring using a Hilbert transform in seismocardiograms.Physiological measurement37, 11 (2016), 1885
work page 2016
-
[57]
Amirtaha Taebi and Hansen A Mansy. 2017. Grouping similar seismocardiographic signals using respiratory information. In2017 IEEE signal processing in medicine and biology symposium (SPMB). IEEE, 1–6
work page 2017
-
[58]
Amirtahà Taebi, Brian E Solar, Andrew J Bomar, Richard H Sandler, and Hansen A Mansy. 2019. Recent advances in seismocardiography.Vibration 2, 1 (2019), 64–86
work page 2019
-
[59]
Kouhyar Tavakolian. 2010. Characterization and analysis of seismocardiogram for estimation of hemodynamic parameters. (2010)
work page 2010
-
[60]
Kouhyar Tavakolian, Andrew P Blaber, Alireza Akhbardeh, Brandon Ngai, and Bozena Kaminska. 2010. Estimating cardiac stroke volume from the seismocardiogram signal.CMBES Proceedings33 (2010)
work page 2010
-
[61]
Fadime Tokmak and Beren Semiz. 2023. Investigating the effect of body composition differences on seismocardiogram characteristics. In2023 IEEE 36th International Symposium on Computer-Based Medical Systems (CBMS). IEEE, 323–328
work page 2023
-
[62]
Paolo Verdecchia, Giuseppe Schillaci, Claudia Borgioni, Antonella Ciucci, Ivano Zampi, Roberto Gattobigio, Nicola Sacchi, and Carlo Porcellati. 1995. White coat hypertension and white coat effect similarities and differences.American journal of hypertension8, 8 (1995), 790–798
work page 1995
-
[63]
Anna C. Voyatzoglou. 2022. An Introduction to the Comparison of Seismocardiography and Phonocardiography. https://stars.library.ucf.edu/ honorstheses/1217 Honors Undergraduate Theses, No. 1217, University of Central Florida
work page 2022
-
[64]
Anna Vybornova, Erietta Polychronopoulou, Arlène Wurzner-Ghajarzadeh, Sibylle Fallet, Josep Sola, and Gregoire Wuerzner. 2021. Blood pressure from the optical Aktiia Bracelet: a 1-month validation study using an extended ISO81060-2 protocol adapted for a cuffless wrist device.Blood pressure monitoring26, 4 (2021), 305–311
work page 2021
-
[65]
Edward Jay Wang, Junyi Zhu, Mohit Jain, Tien-Jui Lee, Elliot Saba, Lama Nachman, and Shwetak N Patel. 2018. Seismo: Blood pressure monitoring using built-in smartphone accelerometer and camera. InProceedings of the 2018 CHI conference on human factors in computing Systems. 1–9
work page 2018
-
[66]
Kapil Wattamwar, Z Jason Qian, Jenna Otter, Matthew J Leskowitz, Francesco F Caruana, Barbara Siedlecki, Jaclyn B Spitzer, and Anil K Lalwani
-
[67]
Association of cardiovascular comorbidities with hearing loss in the older old.JAMA Otolaryngology–Head & Neck Surgery144, 7 (2018), 623–629
work page 2018
-
[68]
2022.Vander’s human physiology
Eric Widmaier, Hershel Raff, and Kevin T Strang. 2022.Vander’s human physiology. McGraw-Hill US Higher Ed USE
work page 2022
-
[69]
Richard A Wilson, Virinderjit S Bamrah, Joseph Lindsay Jr, Markus Schwaiger, and Joel Morganroth. 1993. Diagnostic accuracy of seismocardiography compared with electrocardiography for the anatomic and physiologic diagnosis of coronary artery disease during exercise testing.The American journal of cardiology71, 7 (1993), 536–545
work page 1993
-
[70]
Chenxi Yang, Sunli Tang, and Negar Tavassolian. 2016. Annotation of seismocardiogram using gyroscopic recordings. In2016 IEEE Biomedical Circuits and Systems Conference (BioCAS). IEEE, 204–207
work page 2016
-
[71]
Vahid Zakeri, Alireza Akhbardeh, Nasim Alamdari, Reza Fazel-Rezai, Mikko Paukkunen, and Kouhyar Tavakolian. 2016. Analyzing seismocardiogram cycles to identify the respiratory phases.IEEE Transactions on Biomedical Engineering64, 8 (2016), 1786–1792
work page 2016
-
[72]
John M Zanetti and Kouhyar Tavakolian. 2013. Seismocardiography: Past, present and future. In2013 35th annual international conference of the IEEE engineering in medicine and biology society (EMBC). IEEE, 7004–7007. Manuscript submitted to ACM
work page 2013
discussion (0)
Sign in with ORCID, Apple, or X to comment. Anyone can read and Pith papers without signing in.