Integrating Conductor Health into Dynamic Line Rating and Unit Commitment under Wind Uncertainty
Pith reviewed 2026-05-18 06:16 UTC · model grok-4.3
The pith
By internalizing conductor wear costs from dynamic line ratings, unit commitment decisions reduce total expenses and renewable waste under wind forecast errors.
A machine-rendered reading of the paper's core claim, the machinery that carries it, and where it could break.
Core claim
The Conductor Health-Aware Unit Commitment model quantifies risk-based depreciation costs from elevated temperature operation caused by dynamic line rating under wind power forecast errors, and internalizes these costs in the optimization objective using a robust linear approximation of conductor temperature, leading to safer line flows that adapt to uncertainty correlations.
What carries the argument
The Conductor Health-Aware Unit Commitment (CHA-UC) model, which integrates expected depreciation costs due to hourly elevated temperature operation into the unit commitment objective function.
If this is right
- Total operating cost falls 0.75 percent relative to static line rating on the Texas 123-bus system.
- Renewable curtailment falls 82 percent relative to static line rating.
- Line flows tighten when forecast errors amplify temperature risk and relax when errors hedge risk, producing safer utilization.
- Ignoring depreciation costs leads to higher overall expense because of excessive elevated-temperature operation.
Where Pith is reading between the lines
- The same risk-internalization approach could be extended to other temperature-sensitive assets such as transformers or underground cables.
- Longer-term transmission expansion planning might start to favor routes or conductor types that tolerate higher temperatures with lower wear penalties.
- Real-time versions would need live integration of weather forecasts with degradation models to update the penalty term each hour.
Load-bearing premise
Risk-based depreciation costs from elevated temperatures can be estimated directly from forecast errors and added as a linear penalty in the scheduling problem without changing the underlying temperature physics or needing later corrections.
What would settle it
Measure actual conductor degradation rates or replacement intervals on lines operated under the proposed schedule versus lines operated under conventional dynamic rating that ignores health costs.
Figures


read the original abstract
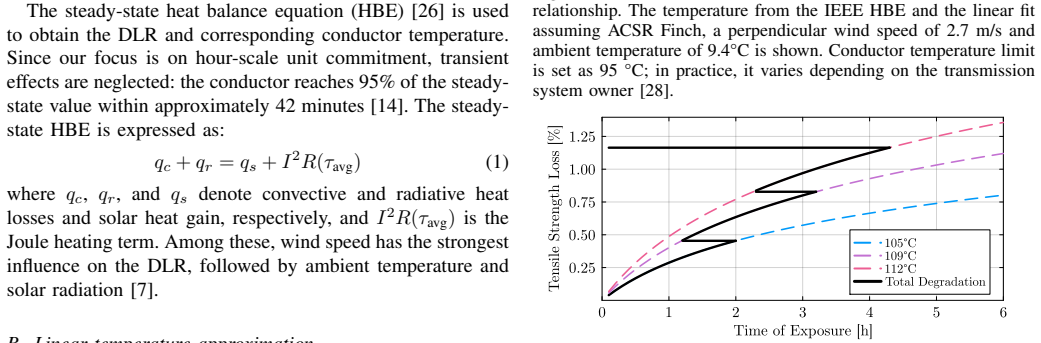
Dynamic line rating (DLR) enables greater utilization of existing transmission lines by leveraging real-time weather data. However, the elevated temperature operation (ETO) of conductors under DLR, particularly in the presence of uncertainty, is often overlooked, despite its long-term impact on conductor health. This paper addresses ETO under DLR and wind power uncertainty by 1) quantifying risk-based depreciation costs associated with ETO, 2) characterizing correlation-driven ETO risk from wind power and DLR forecast errors, and 3) proposing a Conductor Health-Aware Unit Commitment (CHA-UC) that internalizes these costs in operational decisions. CHA-UC incorporates a robust linear approximation of conductor temperature and integrates expected depreciation costs due to hourly ETO into the objective function. Case studies on the Texas 123-bus backbone test system demonstrate that the proposed CHA-UC model reduces the total cost by 0.75\% and renewable curtailment by 82\% compared to static line rating (SLR) and outperforms quantile regression forest-based methods, while conventional DLR operation without risk consideration resulted in higher costs due to excessive ETO. Further analysis shows that CHA-UC achieves safer line utilization by shifting generator commitments and endogenously adapting to uncertainty correlation, relaxing flows under risk-hedging conditions and tightening flows under risk-amplifying conditions.
Editorial analysis
A structured set of objections, weighed in public.
Referee Report
Summary. The paper proposes a Conductor Health-Aware Unit Commitment (CHA-UC) model that quantifies risk-based depreciation costs from elevated temperature operation (ETO) under dynamic line rating (DLR) and wind uncertainty, characterizes correlation-driven ETO risks from forecast errors, and internalizes these via a robust linear approximation of conductor temperature added as a linear term in the UC objective. On the Texas 123-bus backbone test system, CHA-UC reports a 0.75% total cost reduction and 82% drop in renewable curtailment versus static line rating (SLR), outperforming quantile regression forest methods while avoiding excessive ETO costs seen in conventional DLR.
Significance. If the robust linear temperature approximation and linear cost internalization accurately capture ETO risks without distorting nonlinear heat-balance dynamics or correlation effects, the work offers a practical advance in stochastic UC by trading off short-term operational efficiency against long-term conductor health. The Texas 123-bus case studies provide concrete numerical evidence of safer endogenous flow adjustments and generator commitments under uncertainty, which could inform grid operators managing high renewable penetration.
major comments (2)
- [§3 (CHA-UC formulation)] §3 (CHA-UC formulation): the robust linear approximation to conductor temperature is load-bearing for the central claim that ETO risk can be internalized without post-hoc adjustments, yet no error bounds, validation against the full nonlinear heat-balance equation, or sensitivity to the specific wind/DLR forecast-error distributions in the Texas cases are provided; this directly affects whether the reported 0.75% cost reduction and 82% curtailment improvement are artifacts of the approximation.
- [§4 (depreciation cost quantification)] §4 (depreciation cost quantification): the risk-based depreciation costs derived from forecast errors are added as a linear term in the objective, but the manuscript does not demonstrate that this preserves the underlying temperature dynamics or correctly represents correlation-driven ETO risk; without this, the endogenous flow tightening/relaxing behavior claimed for risk-hedging versus risk-amplifying conditions cannot be confirmed as arising from true risk internalization rather than the linearization.
minor comments (2)
- [Abstract and §5] Abstract and §5: the comparison to 'quantile regression forest-based methods' lacks a brief description or citation of the implementation details used for the benchmark.
- [Case studies] Table or figure in case studies: clarify whether the reported 'total cost' consistently includes the new depreciation term across all compared methods (SLR, conventional DLR, CHA-UC) to avoid ambiguity in the 0.75% figure.
Simulated Author's Rebuttal
We thank the referee for the constructive feedback on our work. We address the major comments regarding the robust linear approximation and the depreciation cost internalization below, indicating the revisions planned for the next version of the manuscript.
read point-by-point responses
-
Referee: §3 (CHA-UC formulation): the robust linear approximation to conductor temperature is load-bearing for the central claim that ETO risk can be internalized without post-hoc adjustments, yet no error bounds, validation against the full nonlinear heat-balance equation, or sensitivity to the specific wind/DLR forecast-error distributions in the Texas cases are provided; this directly affects whether the reported 0.75% cost reduction and 82% curtailment improvement are artifacts of the approximation.
Authors: The referee correctly notes the absence of explicit validation metrics in the current manuscript. Our robust linear approximation is obtained by reformulating the nonlinear conductor temperature equation into a linear form using conservative bounds on uncertain parameters (wind speed, ambient temperature) to ensure the estimated temperature is an upper bound. This enables direct inclusion in the linear UC model. To strengthen the paper, we will revise §3 to include: (i) derivation of error bounds based on the maximum linearization error over the uncertainty set, (ii) a validation subsection comparing the linear model outputs to the full nonlinear IEEE heat balance model for the Texas test system lines, and (iii) sensitivity analysis to different forecast error distributions. These additions will confirm that the approximation does not artifactually produce the observed 0.75% cost savings and 82% curtailment reduction. revision: yes
-
Referee: §4 (depreciation cost quantification): the risk-based depreciation costs derived from forecast errors are added as a linear term in the objective, but the manuscript does not demonstrate that this preserves the underlying temperature dynamics or correctly represents correlation-driven ETO risk; without this, the endogenous flow tightening/relaxing behavior claimed for risk-hedging versus risk-amplifying conditions cannot be confirmed as arising from true risk internalization rather than the linearization.
Authors: We partially agree with this assessment. The depreciation cost is calculated as the expected cost from the distribution of ETO events induced by correlated forecast errors, and then added linearly. The temperature dynamics are preserved through the use of the robust approximation which maintains monotonicity with respect to line flow. The correlation-driven risk is explicitly modeled in the characterization step before internalization. However, to better demonstrate the endogenous behavior, we will add in the revision a detailed discussion and additional numerical results in §4 and the case studies section showing how the cost term leads to flow adjustments under different correlation scenarios. We believe this will confirm the risk internalization effect. revision: partial
Circularity Check
No significant circularity; derivation self-contained against external benchmarks
full rationale
The paper quantifies ETO depreciation costs from wind/DLR forecast errors, applies a robust linear approximation to conductor temperature, and internalizes expected costs as a linear term in the CHA-UC objective. Case-study savings (0.75% cost, 82% curtailment) are reported as outcomes of the resulting optimization on the Texas 123-bus system under uncertainty correlation. No quoted equations or self-citations reduce the claimed results to fitted inputs by construction, nor does any step rename a known pattern or import uniqueness from prior author work as a load-bearing premise. The approach remains falsifiable via the reported comparisons to SLR and quantile regression forest baselines.
Axiom & Free-Parameter Ledger
free parameters (1)
- depreciation cost coefficients
axioms (1)
- domain assumption A robust linear approximation accurately captures conductor temperature dynamics under wind and load uncertainty
Lean theorems connected to this paper
-
IndisputableMonolith/Cost/FunctionalEquation.leanwashburn_uniqueness_aczel unclear?
unclearRelation between the paper passage and the cited Recognition theorem.
The CHA-UC incorporates a robust linear approximation of conductor temperature and integration of expected depreciation costs due to hourly ETO into the objective function.
-
IndisputableMonolith/Foundation/AlphaCoordinateFixation.leanJ_uniquely_calibrated_via_higher_derivative unclear?
unclearRelation between the paper passage and the cited Recognition theorem.
τl,t ≥ Al,t · pl,t + Bl,t and piecewise CDep l,t(τ) = Bl · Sl · Dl · (LACSR,t(τ) − LACSR,t−1)/10
What do these tags mean?
- matches
- The paper's claim is directly supported by a theorem in the formal canon.
- supports
- The theorem supports part of the paper's argument, but the paper may add assumptions or extra steps.
- extends
- The paper goes beyond the formal theorem; the theorem is a base layer rather than the whole result.
- uses
- The paper appears to rely on the theorem as machinery.
- contradicts
- The paper's claim conflicts with a theorem or certificate in the canon.
- unclear
- Pith found a possible connection, but the passage is too broad, indirect, or ambiguous to say the theorem truly supports the claim.
Reference graph
Works this paper leans on
-
[1]
Challenges of renewable energy penetration on power system flexibility: A survey,
S. Impramet al., “Challenges of renewable energy penetration on power system flexibility: A survey,”Energy Strategy Reviews, 2020
work page 2020
-
[2]
L. Herdinget al., “Assessing the impact of renewable energy penetration and geographical allocation on transmission expansion cost,”Sustainable Energy, Grids and Networks, vol. 38, p. 101349, 2024
work page 2024
-
[3]
P. Donohoo-Vallettet al., “Capricious cables: Understanding the lim- itations and context of transmission expansion planning models,”The Electricity Journal, vol. 28, no. 9, pp. 85–99, 2015
work page 2015
-
[4]
L. Clapinet al., “Waiting to generate: An analysis of onshore wind and solar pv project development lead-times in australia,”Energy Economics, vol. 131, p. 107337, 2024
work page 2024
-
[5]
2024 state of the market report for the ercot electricity markets,
Potomac Economics, “2024 state of the market report for the ercot electricity markets,” Market Monitoring Report, May 2025
work page 2024
-
[6]
Delays in grid build-out push renewable energy developers’ losses past₩10 trillion,
S. Park, “Delays in grid build-out push renewable energy developers’ losses past₩10 trillion,”Kyunghyang Shinmun, Oct. 2023
work page 2023
-
[7]
Impact from dynamic line rating on wind power integration,
C. J. Wallnerstromet al., “Impact from dynamic line rating on wind power integration,”IEEE Transactions on Smart Grid, 2015
work page 2015
-
[8]
Impacts of dynamic line ratings on the ercot transmission system,
T. Leeet al., “Impacts of dynamic line ratings on the ercot transmission system,” inProc. North Amer . Power Symp. (NAPS), 2022
work page 2022
-
[9]
Implementation of dynamic line ratings,
FERC, “Implementation of dynamic line ratings,” Washington, DC, Advance notice of proposed rulemaking RM24-6-000, Jun. 2024
work page 2024
-
[10]
Managing transmission line ratings,
FERC, “Managing transmission line ratings,” Washington, DC, Final Rule (Order No. 881) RM20-16-000, Dec. 2021
work page 2021
-
[11]
Probabilistic n-1 security assessment incorporating dynamic line ratings,
M. A. Bucheret al., “Probabilistic n-1 security assessment incorporating dynamic line ratings,” in2013 IEEE Power & Energy Society General Meeting, 2013, pp. 1–5
work page 2013
-
[12]
N. Viaforaet al., “Chance-constrained optimal power flow with non- parametric probability distributions of dynamic line ratings,”Interna- tional Journal of Electrical Power & Energy Systems, 2020
work page 2020
-
[13]
Risk-based distributionally robust optimal power flow with dynamic line rating,
C. Wanget al., “Risk-based distributionally robust optimal power flow with dynamic line rating,”IEEE Trans. on Pwr . Syst., 2018
work page 2018
-
[14]
H. Parket al., “Stochastic security-constrained unit commitment with wind power generation based on dynamic line rating,”Int. J. Electr . Power Energy Syst., 2018
work page 2018
-
[15]
Risk-averse stochastic dynamic line rating models,
A. Kirilenkoet al., “Risk-averse stochastic dynamic line rating models,” IEEE Transactions on Power Systems, 2021
work page 2021
-
[16]
Probabilistic dynamic line rating forecasting with line graph convolutional LSTM,
M. Kimet al., “Probabilistic dynamic line rating forecasting with line graph convolutional LSTM,” available in ArXiv
-
[17]
K. Adomahet al., “Probabilistic assessment of the reduction in tensile strength of an overhead transmission line’s conductor with reference to climatic data,”IEEE Transactions on Power Delivery, 2000
work page 2000
-
[18]
Effect of elevated temperature operation on the strength of aluminum conductors,
J. R. Harvey, “Effect of elevated temperature operation on the strength of aluminum conductors,”IEEE Trans. Power App. Syst., 1972
work page 1972
-
[19]
Spatial analysis of thermal aging of overhead transmission conductors,
P. Musileket al., “Spatial analysis of thermal aging of overhead transmission conductors,”IEEE Transactions on Power Delivery, 2012
work page 2012
-
[20]
Increased power flow guide- book: Increasing power flow in transmission and substation circuits,
Electric Power Research Institute (EPRI), “Increased power flow guide- book: Increasing power flow in transmission and substation circuits,” Palo Alto, CA, Tech. Rep. 1010627, Nov. 2005
work page 2005
-
[21]
Guide for determination of bare overhead trans- mission conductors,
PJM Interconnection, “Guide for determination of bare overhead trans- mission conductors,” Guidance Document, Dec. 2022
work page 2022
-
[22]
Risk-based management of transmission lines enhanced with the dynamic thermal rating system,
J. Tehet al., “Risk-based management of transmission lines enhanced with the dynamic thermal rating system,”IEEE Access, vol. 7, pp. 76 562–76 572, 2019
work page 2019
-
[23]
K. Morozovskaet al., “A framework for application of dynamic line rating to aluminum conductor steel reinforced cables based on mechan- ical strength and durability,”International Journal of Electrical Power & Energy Systems, vol. 116, p. 105491, 2020
work page 2020
-
[24]
B. O. Ngokoet al., “Optimal power flow considering line-conductor temperature limits under high penetration of intermittent renewable energy sources,”Int. J. Electr . Power Energy Syst., 2018
work page 2018
-
[25]
An ADMM approach for unit commitment with consid- ering dynamic line rating,
J. Daiet al., “An ADMM approach for unit commitment with consid- ering dynamic line rating,”Frontiers in Energy Research, 2024
work page 2024
-
[26]
IEEE standard for calculating the current-temperature relationship of bare overhead conductors,
“IEEE standard for calculating the current-temperature relationship of bare overhead conductors,”IEEE Std 738-2023, pp. 1–56, 2023
work page 2023
-
[27]
Overhead transmission line ampacity ratings,
R. Kluge, “Overhead transmission line ampacity ratings,” American Transmission Company, Technical Standard, Apr. 2012
work page 2012
-
[28]
P. Brownet al., “Hourly dynamic line ratings for existing transmission across the contiguous united states (preliminary results),” 2024
work page 2024
-
[29]
Transmission line ratings workshop: Typical industry practices,
Midcontinent Independent System Operator (MISO), “Transmission line ratings workshop: Typical industry practices,” Jan. 2021
work page 2021
-
[30]
Tight and Compact MILP Formulation for the Thermal Unit Commitment Problem,
G. Morales-Espa ˜naet al., “Tight and Compact MILP Formulation for the Thermal Unit Commitment Problem,”IEEE Transactions on Power Systems, vol. 28, no. 4, pp. 4897–4908, 2013
work page 2013
-
[31]
A synthetic texas power system with time-series weather- dependent spatiotemporal profiles,
J. Luet al., “A synthetic texas power system with time-series weather- dependent spatiotemporal profiles,” 2023, available in ArXiv
work page 2023
-
[32]
JuMP 1.0: Recent improvements to a modeling language for mathematical optimization,
M. Lubinet al., “JuMP 1.0: Recent improvements to a modeling language for mathematical optimization,”Mathematical Programming Computation, 2023
work page 2023
-
[33]
Parsons Brinckerhoff, “Electricity transmission costing study: An inde- pendent report endorsed by the institution of engineering & technology,” Institution of Engineering & Technology, Independent Report, Jan. 2012
work page 2012
-
[34]
D. S. Kirschen and G. Strbac,Fundamentals of Power System Eco- nomics, 2nd ed. Hoboken, NJ: John Wiley & Sons, 2018
work page 2018
-
[35]
Regression equilibrium in electricity markets,
V . Dvorkin, “Regression equilibrium in electricity markets,”IEEE Trans- actions on Energy Markets, Policy and Regulation, 2025. 11
work page 2025
-
[36]
A north american hourly assimilation and model forecast cycle: The rapid refresh,
S. G. Benjaminet al., “A north american hourly assimilation and model forecast cycle: The rapid refresh,”Monthly Weather Review, vol. 144, no. 4, pp. 1669–1694, Apr. 2016
work page 2016
-
[37]
Development of a new procedure for reliability modeling of wind turbine generators,
P. Giorsettoet al., “Development of a new procedure for reliability modeling of wind turbine generators,”IEEE Transactions on Power Apparatus and Systems, vol. PAS-102, no. 1, pp. 134–143, 1983
work page 1983
discussion (0)
Sign in with ORCID, Apple, or X to comment. Anyone can read and Pith papers without signing in.