Substitution or Complement? Uncovering the Interplay between Ride-hailing Services and Public Transit
Pith reviewed 2026-05-18 04:33 UTC · model grok-4.3
The pith
In a mature ride-hailing market, the share of trips that complement public transit has risen while the substitutive share has fallen.
A machine-rendered reading of the paper's core claim, the machinery that carries it, and where it could break.
Core claim
The central claim is that the interplay between transportation network companies and public transit in Shanghai shows a substantial increase in the complementary ratio of 9.22 percent and a relative decline in the substitutive ratio of 9.06 percent compared to previous studies, derived from classifying nearly 97,000 ride-hailing vehicles' data into four relationship categories and examining nonlinear influences with CatBoost and SHAP methods.
What carries the argument
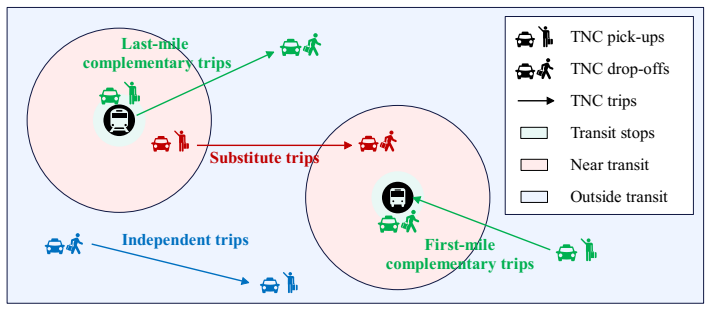
An enhanced data-driven framework that classifies individual ride-hailing trips into first-mile complementary, last-mile complementary, substitutive, and independent categories based on vehicle travel data.
If this is right
- Urban planners can treat ride-hailing as a first- and last-mile extender rather than a competitor when designing transit integration policies.
- The observed nonlinear effects imply that small changes in metro-station distance or bus-stop density can shift a trip from substitutive to complementary.
- Regulations in mature TNC markets may need updating to encourage rather than restrict complementary ride-hailing services.
- Targeted location-specific interventions become feasible once the key factors driving each relationship type are known.
Where Pith is reading between the lines
- The same shift toward complementarity could appear in other large cities once ride-hailing reaches high penetration, producing more hybrid mobility systems.
- Transit agencies might gain from partnerships that let ride-hailing apps display real-time connections to nearby bus or metro departures.
- If the pattern holds, some cities could slow certain transit expansions and instead subsidize complementary ride-hailing in low-density corridors.
Load-bearing premise
The enhanced data-driven framework accurately classifies individual trips into the four relationship types using the available vehicle data without substantial mislabeling, and the September 2022 Shanghai dataset represents typical behavior in a saturated TNC market.
What would settle it
Re-running the classification on the same Shanghai trip records with an alternative rule set that yields no meaningful rise in the complementary ratio, or repeating the study in another saturated city and obtaining a dominant substitutive pattern instead.
Figures


read the original abstract
The literature on transportation network companies (TNCs), also known as ride-hailing services, has often characterized these service providers as predominantly substitutive to public transit (PT). However, as TNC markets expand and mature, the complementary and substitutive relationships with PT may shift. To explore whether such a transformation is occurring, this study collected travel data from 96,716 ride-hailing vehicles during September 2022 in Shanghai, a city characterized by an increasingly saturated TNC market. An enhanced data-driven framework is proposed to classify TNC-PT relationships into four types: first-mile complementary, last-mile complementary, substitutive, and independent. Our findings reveal a substantial increase in the complementary ratio (9.22%) and a relative decline in the substitutive ratio (9.06%) compared to previous studies. Furthermore, to examine the nonlinear impact of various influential factors on these ratios, a machine learning method integrating categorical boosting (CatBoost) and Shapley additive explanations (SHAP) is proposed. The results show significant nonlinear effects in some variables, including the distance to the nearest metro station and the density of bus stops.
Editorial analysis
A structured set of objections, weighed in public.
Referee Report
Summary. The paper analyzes the relationship between ride-hailing (TNC) services and public transit using trip data from 96,716 vehicles in Shanghai during September 2022. It proposes an enhanced data-driven framework to classify individual trips into four categories—first-mile complementary, last-mile complementary, substitutive, and independent—and reports a 9.22% increase in the complementary ratio and a 9.06% decline in the substitutive ratio relative to prior studies. The study additionally applies CatBoost combined with SHAP to identify nonlinear effects of factors including distance to the nearest metro station and bus stop density.
Significance. If the trip classification framework is shown to be accurate and robust, the results would indicate a meaningful shift toward complementarity in saturated TNC markets, with direct relevance for urban transportation policy and modal integration strategies. The integration of gradient boosting with SHAP for nonlinear factor analysis provides a useful methodological contribution for examining threshold effects in transportation data.
major comments (2)
- [Framework and Methods] The description of the enhanced data-driven framework (abstract and methods) provides no explicit definition of the classification thresholds or rules for first-mile complementary, last-mile complementary, or substitutive trips, nor any validation against ground-truth labels, sensitivity tests on alternative thresholds, or inter-rater reliability metrics. Because the reported 9.22% and 9.06% ratio shifts are computed directly from these classifications of the 96,716 trips, the absence of these details renders the central empirical claims difficult to assess.
- [Results and Discussion] The comparison of ratios to previous studies does not specify the exact baseline ratios from those studies or adjust for differences in data granularity, market maturity, or classification methodologies, which directly affects the interpretation of the claimed 'substantial increase' and 'relative decline'.
minor comments (2)
- [Abstract] The abstract states that 'significant nonlinear effects' are observed in some variables but lists only two examples; a short enumeration of all variables with notable nonlinear patterns would improve clarity.
- [Data] Clarify the sampling frame and potential selection biases in the 96,716-vehicle dataset to strengthen claims about representativeness in a saturated TNC market.
Simulated Author's Rebuttal
We thank the referee for the detailed and constructive feedback on our manuscript. We address each of the major comments below and outline the revisions we will make to enhance the transparency and interpretability of our findings.
read point-by-point responses
-
Referee: [Framework and Methods] The description of the enhanced data-driven framework (abstract and methods) provides no explicit definition of the classification thresholds or rules for first-mile complementary, last-mile complementary, or substitutive trips, nor any validation against ground-truth labels, sensitivity tests on alternative thresholds, or inter-rater reliability metrics. Because the reported 9.22% and 9.06% ratio shifts are computed directly from these classifications of the 96,716 trips, the absence of these details renders the central empirical claims difficult to assess.
Authors: We agree that additional details on the classification framework are necessary to allow readers to fully evaluate our results. In the revised manuscript, we will expand the Methods section to explicitly define the thresholds and rules used for classifying trips (e.g., distance thresholds to transit stops for first- and last-mile complementarity, and origin-destination matching criteria for substitution). We will also include sensitivity analyses by varying key thresholds and reporting the resulting changes in ratios. While ground-truth validation via labeled data is not available in our dataset, we will discuss this as a limitation and justify our approach based on established methods in the literature. These additions will make the empirical claims more assessable. revision: yes
-
Referee: [Results and Discussion] The comparison of ratios to previous studies does not specify the exact baseline ratios from those studies or adjust for differences in data granularity, market maturity, or classification methodologies, which directly affects the interpretation of the claimed 'substantial increase' and 'relative decline'.
Authors: We appreciate this point regarding the comparability of our results. In the revised paper, we will explicitly report the baseline complementary and substitutive ratios from the prior studies we reference, along with their sources. Additionally, we will add a discussion acknowledging potential differences arising from variations in data sources, city-specific market conditions, and methodological choices in trip classification. This will provide a more nuanced interpretation of the observed shifts in Shanghai's context. revision: yes
Circularity Check
No significant circularity: ratios computed directly from new trip classifications on fresh Shanghai data
full rationale
The paper collects primary data from 96,716 ride-hailing trips in September 2022 Shanghai and applies a proposed data-driven classification framework that assigns each trip to one of four relationship types using observable attributes (e.g., distance to nearest metro station, bus-stop density). The complementary ratio (9.22%) and substitutive ratio (9.06%) are direct aggregates of these classifications rather than outputs of any model fitted to the target ratios or prior parameter estimates. The CatBoost-SHAP component analyzes nonlinear effects of covariates on the already-computed ratios but does not redefine or predict them. Comparisons to earlier studies function as external benchmarks, not self-citation chains that define the result. No equation or step reduces the central empirical claims to tautological inputs by construction.
Axiom & Free-Parameter Ledger
free parameters (1)
- Classification thresholds for first-mile, last-mile, and substitutive trips
axioms (1)
- domain assumption The September 2022 ride-hailing trip records accurately reflect real user behavior and proximity to transit infrastructure.
Reference graph
Works this paper leans on
-
[1]
Accident Analysis & Prevention 211, 107896
How does distraction affect cyclists’ severe crashes? A hybrid CatBoost-SHAP and random parameters binary logit approach. Accident Analysis & Prevention 211, 107896. doi:10.1016/j.aap.2024.107896. Akiba, T., Sano, S., Yanase, T., Ohta, T., Koyama, M.,
-
[2]
Why they don’t choose bus service? Understanding special online car-hailing behavior near bus stops. Transport Policy 114, 280–297. doi:10.1016/j.tranpol.2021.09.013. Cats, O., Kucharski, R., Danda, S.R., Yap, M.,
-
[3]
Beyond the dichotomy: How ride-hailing competes with and complements public transport. PLOS ONE 17, e0262496. doi:10.1371/journal.pone.0262496. Cui, X., Zhuang, C., Jiao, Z., Tan, Z., Li, S.,
-
[4]
Journal of Transport Geography 111, 103669
How can urban built environment (BE) influence on-road (OR) carbon emissions? A road segment scale quantification based on massive vehicle trajectory big data. Journal of Transport Geography 111, 103669. URL:https:// linkinghub.elsevier.com/retrieve/pii/S0966692323001412, doi:10.1016/j.jtrangeo.2023.103669. Erhardt,G.D.,Mucci,R.A.,Cooper,D.,Sana,B.,Chen,M...
-
[5]
Transportation Research Part C: Emerging Technologies 178, 105181
Novel operational algorithms for ride-pooling as on-demand feeder services. Transportation Research Part C: Emerging Technologies 178, 105181. URL:https://www.sciencedirect.com/science/article/pii/S0968090X25001858, doi:10.1016/j.trc.2025.105181. Fan, Z., Gou, J., Weng, S., 2024b. A Feature Importance-Based Multi-Layer CatBoost for Student Performance Pre...
-
[6]
Annals of statistics , 1189–1232
Greedy function approximation: a gradient boosting machine. Annals of statistics , 1189–1232. Gan,Z.,Yang,M.,Feng,T.,Timmermans,H.J.,2020.Examiningtherelationshipbetweenbuiltenvironmentandmetroridershipatstation-to-station level. Transportation Research Part D: Transport and Environment 82, 102332. Gao,F.,He,S.Y.,Han,C.,Liang,J.,2024. Theimpactofsharedmob...
-
[7]
Trans- portation Research Part D: Transport and Environment 108, 103325
Analysis of air quality spatial spillover effect caused by transportation infrastructure. Trans- portation Research Part D: Transport and Environment 108, 103325. URL:https://linkinghub.elsevier.com/retrieve/pii/ S1361920922001535, doi:10.1016/j.trd.2022.103325. Henao,A.,2017.Impactsofridesourcing-lyftanduber-ontransportationincludingVMT,modereplacement,p...
-
[8]
Travel Behaviour and Society 40, 100994
What promotes the integration of metro and ridesourcing? Analysis of first/last mile ridesourcing origin–destination trips. Travel Behaviour and Society 40, 100994. doi:10.1016/j.tbs.2025.100994. Jin, Z., Mao, H., Chen, D., Li, H., Tu, H., Yang, Y., Attard, M.,
-
[9]
Journal of Transport Geography 109, 103579
A data-driven approach to estimating dockless electric scooter service areas. Journal of Transport Geography 109, 103579. URL:https://www.sciencedirect.com/science/article/pii/S0966692323000510, doi:10. 1016/j.jtrangeo.2023.103579. Kong, H., Zhang, X., Zhao, J.,
-
[10]
Journal of Transport Geography 86, 102769
How does ridesourcing substitute for public transit? A geospatial perspective in Chengdu, China. Journal of Transport Geography 86, 102769. doi:10.1016/j.jtrangeo.2020.102769. Li, W., Shalaby, A., Habib, K.N.,
-
[11]
Exploring the correlation between ride-hailing and multimodal transit ridership in toronto. Transportation 49, 765–789. doi:10.1007/s11116-021-10193-5. Liu, X., Ye, Q., Li, Y., Yang, K., Shao, X.,
-
[12]
TransportationResearchPartA:PolicyandPractice192,104339
Investigating relationships between ridesourcing and public transit using big data analysis and nonlinearmachinelearning: AcasestudyofShanghai,China. TransportationResearchPartA:PolicyandPractice192,104339. doi:10.1016/ j.tra.2024.104339. Lundberg, S.M., Lee, S.I.,
-
[13]
Transportation Research Part C: Emerging Technologies 153, 104192
Integrated design of a bus-bike system considering realistic route options and bike availability. Transportation Research Part C: Emerging Technologies 153, 104192. URL:https://www.sciencedirect.com/science/article/pii/S0968090X2300181X, doi:10.1016/j.trc.2023.104192. Luo,X.,Gu,W.,Fan,W.,2021. Jointdesignofshared-bikeandtransitservicesincorridors. Transpo...
-
[14]
Journal of Transport Geography 97, 103219
The relationship between ridehailing and public transit in Chicago: A comparison before and after COVID-19. Journal of Transport Geography 97, 103219. doi:10.1016/j.jtrangeo.2021.103219. Murray,A.T.,Davis,R.,Stimson,R.J.,Ferreira,L.,1998.PublicTransportationAccess.TransportationResearchPartD:TransportandEnvironment 3, 319–328. doi:10.1016/S1361-9209(98)00...
-
[15]
https://www.marketplace.org/2025/01/14/chinas-rideshare-taxi- drivers-longer-hours-less-pay/
China’s ride-hailing and taxi drivers face longer hours and less pay. https://www.marketplace.org/2025/01/14/chinas-rideshare-taxi- drivers-longer-hours-less-pay/. Pan, Y., Qiu, L.,
work page 2025
-
[16]
Production and Operations Management 31, 906–927
How Ride-Sharing Is Shaping Public Transit System: A Counterfactual Estimator Approach. Production and Operations Management 31, 906–927. doi:10.1111/poms.13582. Pereira,R.H.,Herszenhut,D.,Saraiva,M.,Farber,S.,2024. Ride-hailingandtransitaccessibilityconsideringthetrade-offbetweentimeandmoney. Cities 144, 104663. doi:10.1016/j.cities.2023.104663. Prokhore...
-
[17]
Transportation Research Part D: Transport and Environment 114, 103533
Is ride-hailing competing or complementing public transport? A perspective from affordability. Transportation Research Part D: Transport and Environment 114, 103533. doi:10.1016/j.trd.2022.103533. Rangel, T., Gonzalez, J.N., Gomez, J., Romero, F., Vassallo, J.M.,
-
[18]
Exploring ride-hailing fares: an empirical analysis of the case of madrid. Transportation 49, 373–393. Rayle,L.,Dai,D.,Chan,N.,Cervero,R.,Shaheen,S.,2016. Justabettertaxi? asurvey-basedcomparisonoftaxis,transit,andridesourcingservices in san francisco. Transport Policy 45, 168–178. Sadowsky, N., Nelson, E.,
work page 2016
-
[19]
URL:https://mp.weixin.qq.com/ s/kIhrfDSzR4ankJW0kmbIqw
Shanghai transport industry development report. URL:https://mp.weixin.qq.com/ s/kIhrfDSzR4ankJW0kmbIqw. ShanghaiMunicipalTransportationCommission,2024. Shanghaibuslineinformationenquiry. URL:https://zwdt.sh.gov.cn/govPortals/ bsfw/item/cf1ce7ac-bb4b-40ff-a066-1abd93169b4a. Tirachini, A., Del Río, M.,
work page 2024
-
[20]
Ride-hailing in Santiago de Chile: Users’ characterisation and effects on travel behaviour. Transport Policy 82, 46–57. doi:10.1016/j.tranpol.2019.07.008. Tuffour, J.P.,
-
[21]
Case Studies on Transport Policy 10, 2229–2243
Contested mobility interactions: Characterizing the influence of ride-sharing services on the adoption and use of public transit system. Case Studies on Transport Policy 10, 2229–2243. doi:10.1016/j.cstp.2022.10.004. Tukey, J.W., et al.,
-
[22]
URL:https://www.worldpop.org/doi/10.5258/SOTON/WP00660, doi:10.5258/SOTON/WP00660
The spatial distribution of population in 2020 with country total adjusted to match the corresponding UNPD estimate, China. URL:https://www.worldpop.org/doi/10.5258/SOTON/WP00660, doi:10.5258/SOTON/WP00660. Wu,L.,Gu,W.,Fan,W.,Cassidy,M.J.,2020.Optimaldesignoftransitnetworksfedbysharedbikes.TransportationresearchpartB:methodological 131, 63–83. Young, M., ...
-
[23]
Journal of Transport Geography 82, 102629
Measuring when Uber behaves as a substitute or supplement to transit: An examination of travel-time differences in Toronto. Journal of Transport Geography 82, 102629. doi:10.1016/j.jtrangeo.2019.102629. Yu, C., Deng, Y., Qin, Z., Yang, C., Yuan, Q.,
-
[24]
Transportation Research Part D: Transport and Environment 124, 103935
Traffic volume and road network structure: Revealing transportation-related factors on PM2.5 concentrations. Transportation Research Part D: Transport and Environment 124, 103935. doi:10.1016/j.trd.2023.103935. Jin et al.:Preprint submitted to ElsevierPage 47 of 48 Zhen,L.,Gu,W.,2024. Feederbusservicedesignunderspatiallyheterogeneousdemand. Transportation...
discussion (0)
Sign in with ORCID, Apple, or X to comment. Anyone can read and Pith papers without signing in.