REVIEW 4 major objections 4 minor 1 cited by
Weak-Lensing Detection of Intercluster Filaments in Three Nearby Cluster Systems
T0 review · 4 major / 4 minor · reviewed 2026-08-04 · deepseek-v4-flash
Pith's one-line read Using a matched filter built for the shear pattern of a straight, flat-topped mass ridge, this paper reports the first >5-sigma weak-lensing detections of intercluster filaments — dark matter bridges — connecting four cluster pairs in three
desk verdict First individual WL filament detections in A401 and A2029 look plausible, but the A2029–SIG and A3558–A3556 peaks sit on top of secondary halos whose contamination is not convincingly cut. read the letter →
The pith
A machine-rendered reading of the paper's core claim, the machinery that carries it, and where it could break.
The reading
What carries the argument
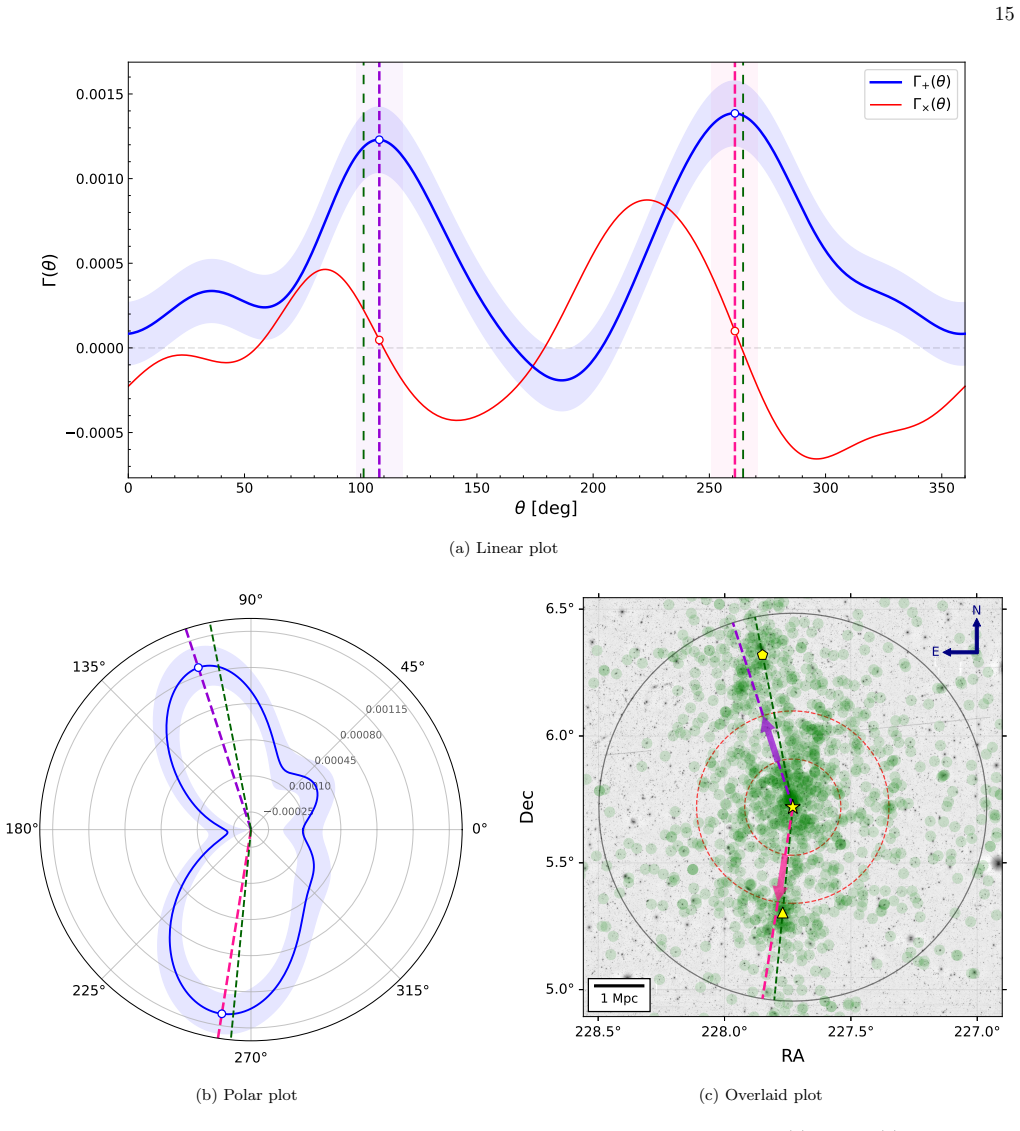
The key machinery is an optimal matched filter (Eqs. 5–9) whose template is the tangential shear of a straight filament with a flat-top convergence profile (Eq. 4): κ = κ0 for h ≤ hc, falling as κ0/[1 + ((h - hc)/hc)^2] beyond. The filter is scanned in polar angle θ, and the tangential statistic Γ+ peaks when the filter aligns with a real filament, while cluster shear produces a quadrupolar pattern and a local 3σ peak that can be suppressed by the cross-gradient residual R (the identity B = 2A + R). A Fourier cutoff frequency, tuned on mocks (k_cut = 0.21 arcmin^-1), balances resolution against shape noise.
What would settle it
Run the matched filter on the same data after rotating the orientation of the shear catalog by 45 degrees (which should destroy a genuine filament signal while preserving noise) and check whether any peak above 5σ survives; alternatively, fit a curved or tilted filament model to the detected peaks and see if the significance remains >5σ.
Extended reading notes
Core claim
The central claim is that a matched filter constructed from the predicted tangential-shear pattern of an infinitely long, flat-topped filament can extract the weak-lensing signal of individual intercluster filaments from ground-based shape noise. Applying it to three massive cluster systems at z<0.1, the paper detects two filaments per system at 4.0–7.3 sigma, including the >5-sigma bridges between A401/A399, A2029/A2033, A2029/SIG, and A3558/A3556. The detected orientations align with spectroscopic members and red-sequence galaxy distributions, and the inferred peak convergences and widths match N-body simulation expectations. The authors further show that a negative cross-gradient statisti
Load-bearing premise
Each filament is modeled as an infinitely long, straight, sky-plane structure with a flat-top density profile and the same redshift as the primary cluster; if real filaments curve, tilt out of the plane, or differ in profile, the matched-filter peaks and inferred κ0 and hc could be biased.
Editorial extensions
If this is right
- If the detections hold, individual cosmic filaments can be mapped in projection around clusters, turning filaments from statistical stackings into discrete objects for study.
- The measured κ0 and hc for six filaments provide first constraints on the peak surface density and transverse size of low-redshift intercluster filaments, testable against simulations.
- The method's success on ground-based data with ~7–12 galaxies/arcmin^2 implies that upcoming deeper wide surveys should detect many more filaments and begin mapping the cosmic web directly.
- The B-mode/negative cross-gradient statistic, though noise-limited here, offers a route to suppress cluster shear contamination in higher-source-density data (e.g., space-based imaging).
- Orientation agreement with galaxy and X-ray tracers strengthens the interpretation that the lensing signal traces the same structures seen in baryons.
Reading between the lines
- If the flat-top model is replaceable by a more realistic curved or tapered profile, the inferred widths might shift; one could test by fitting a truncated Gaussian or a power-law cusp and seeing if the signal-to-noise changes materially.
- The technique could be applied to other cluster pairs in the same survey to build a sample of dozens of filaments, enabling an ensemble measurement of the filament mass function and a test of the role of filament orientation relative to the line of sight.
- The reported κ0 values imply linear mass densities of roughly 10^13–10^14 solar masses per Mpc; if corroborated by future independent analyses using different shear catalogs, these would be among the first direct mass measurements of filaments.
- A cross-check: stack the detected filaments in cosmic-shear maps from a different survey; if the signal persists, it would rule out systematic shear-calibration errors as the source.
Editorial analysis
A structured set of objections, weighed in public.
Referee Report
Summary. The paper applies a matched-filter technique to DECam/LoVoCCS weak-lensing shear catalogs to search for intercluster filaments in three nearby cluster systems (Abell 401, Abell 2029, and Abell 3558) and a control field (Abell 2351). The filter is based on a parametric filament convergence model (Eq. 4) and is optimized using mock catalogs and a null field. The authors report >5σ detections of four intercluster bridges (A401/399, A2029/2033, A2029/SIG, A3558/3556) and infer filament convergence amplitudes and widths via MCMC. They also explore a B-mode-based combined statistic to suppress cluster contamination, but note that it is unusable at LoVoCCS source density.
Significance. If the detections hold, this would be a valuable direct probe of dark-matter filaments in individual systems, complementing stacking analyses and baryonic tracers. The paper has several strengths: mock validation of the filter, a null-field control (A2351) that yields no >2σ peaks, publicly available code, and a careful treatment of shape noise and LSS noise. The central claim, however, relies on the radial-cutoff scheme being effective at removing secondary-cluster shear, and on the interpretation of angular maxima as genuine filament signals.
major comments (4)
- [Appendix B, Table 5] The threshold radii r_t do not satisfy the stated γ_+<0.02 criterion. For A3556 (M_WL=1.62e14), Table 5 gives r_t=0.06 Mpc; a standard NFW halo of this mass (R200≈0.9 Mpc, r_s≈0.2 Mpc) has tangential shear of order 0.1 at 0.06 Mpc, not 0.02. Since r2=min{R_i-r_t,i}=2.75 Mpc and the A3558–A3556 separation is 2.81 Mpc, the filter annulus excludes only the inner 0.06 Mpc around A3556, so a large fraction of the annulus is contaminated by secondary-cluster shear above the stated criterion. The same issue affects SIG in A2029 (r_t=0.18 Mpc). Because the A3558-W and A2029-S peaks are aligned with these secondary clusters, and because the mock in §6.3 demonstrates that a secondary cluster inside the filter region produces a spurious 3σ filament, the 5.8σ and 7.3σ detections may be dominated by NFW-halo leakage rather than intercluster matter. Please recompute r_t using the actual NFW profile an
- [Section 8, Tables 2–4] Quoted significances are peak values from a full 360° angular scan of Γ_+(θ) without a look-elsewhere correction. The pure-noise test in §6.3 (10 realizations, no >2σ peaks) is reassuring but does not directly give the false-alarm probability of a 5–7σ maximum over the ~effective number of independent angles. The authors should report the distribution of the maximum S/N from mocks (or an explicit trials factor) and quote corrected significances. This is particularly important for the weaker 4σ detections, which may become marginal after correction.
- [Section 6.4 and Appendix B] The combined B-mode statistic is explicitly stated to be unusable at LoVoCCS source density ('the negative cross gradient is unusable in our case'). Therefore, the radial cutoffs in Appendix B are the only quantitative barrier between secondary-cluster shear and the matched-filter statistic. Given the inconsistency in Table 5 identified above, the current analysis has no validated contamination barrier for the high-significance peaks aligned with secondary clusters. This makes the central >5σ claim (Abstract, Section 9) difficult to support as it stands.
- [Section 6.1–6.3, Eq. (4)] The mock validation uses the same parametric filament model (Eq. 4) that defines the matched-filter template, so it does not test the method's robustness to realistic filament morphology (curvature, line-of-sight inclination, varying density profile). The null test on A2351 is a valuable control against false positives, but it does not establish completeness or unbiasedness in a complex field. The claim of 'robust' detections would be strengthened by testing on a mock with more realistic filament shapes, e.g., extracted from cosmological simulations.
minor comments (4)
- [Section 7] The text refers to 'Abell 2023 (A2033)'; elsewhere the cluster is called Abell 2033. Please correct the name consistently.
- [Section 5.2.1, Eq. (10)] The exponential term in P_g(k) has a positive argument; if it represents a Gaussian low-pass window, the exponent should have a negative sign (or the expression should be reconciled with Maturi et al. 2010). Please check and clarify.
- [Table 5] The column headers use M_X200m, M_WL200c, and M'_WL200c without fully specifying that all masses are in units of 10^14 M_sun. Also, the WL mass of A2351 is a private communication; consider flagging this more prominently or using a published value if available.
- [Section 9] The limitation section acknowledges the Gaussian noise approximation and small sample. It would also be helpful to note that the radial-cutoff calculation depends on the accuracy of WL mass estimates for every secondary cluster; mass errors propagate directly into r_t and hence into the contamination barrier.
Circularity Check
No significant circularity: the filament detections and inferred parameters come from fitting a fixed template to independent shear data, not from re-using the fitted values as predictions.
full rationale
The core derivation chain is not circular under the rubric. The matched-filter statistic Γ+(θ) is built from the filament template in Eq. (4), but it is applied to the LoVoCCS shear catalog, an external observable data product; its S/N is evaluated with the data-driven variance in Eq. (7), not from the fitted model parameters. The inferred κ0 and hc are posterior measurements obtained by MCMC fitting of Eq. (4) to the galaxy shear data, which is standard parameter estimation, not a case where a prediction is equal to its input by construction. The mock tests in §6.3 generate mock data from the same model and then recover the input κ0 and hc; those tests are explicitly presented as pipeline validation, not as evidence for the astrophysical detection, so they do not constitute a fitted input being called a prediction. The cited same-team works (Fu et al. 2022, 2024; Shinde et al. 2025) either provide the shear catalog, which is an independent observational product, or are used for consistency comparisons; no load-bearing argument reduces to a self-citation or a uniqueness theorem. The radial-cutoff prescription in Appendix B is a calibration/contamination control, and even if the skeptical objection about the 2% threshold were correct, that would be a systematic-error concern, not a circularity in which the output is equivalent to the input by definition. No specific reduction of the form 'Eq. X = Eq. Y by construction' or 'fitted parameter renamed as prediction' can be exhibited.
Assumptions & free parameters
free parameters (5)
- k_cut (filter cutoff frequency) =
0.21 arcmin^-1
- h_c,filter (template filament width) =
0.15 Mpc
- sigma_gamma (shape noise in mocks) =
0.45
- Secondary cluster WL masses (M'_WL,i) =
Scaled from primary WL mass and X-ray mass ratio (e.g., A399: 12.2e14 Msun)
- kappa0 and hc for six filaments =
kappa0=0.015-0.053, hc=0.11-0.45 Mpc
assumptions (6)
- domain assumption Filament convergence profile follows Eq. (4): flat-top κ0 for h ≤ hc, then κ0/(1+((h-hc)/hc)^2) for h > hc.
- domain assumption Filaments are infinite, straight, lie in the plane of the sky, and the entire cluster-filament system lies at the primary cluster's redshift.
- domain assumption Clusters are spherical NFW halos for shear modeling.
- domain assumption Shear noise is a zero-mean isotropic Gaussian field; LSS noise is negligible after measurement.
- domain assumption Flat-sky approximation is valid for fields <2 degrees.
- standard math Matched-filter variance formula (Eq. 7) is unbiased for the statistic.
Cite this review
Pith. "Pith review of Weak-Lensing Detection of Intercluster Filaments in Three Nearby Cluster Systems." pith.science (2026). https://pith.science/paper/PN2EVUSP
@misc{pith2026251026318,
  author       = {Pith},
  title        = {Pith review of: Weak-Lensing Detection of Intercluster Filaments in Three Nearby Cluster Systems},
  year         = {2026},
  howpublished = {\url{https://pith.science/paper/PN2EVUSP}},
  note         = {Machine review of arXiv:2510.26318}
}
abstract
Direct detection of intercluster filaments is challenging due to their low surface density, resulting in a weak deflection field. We present weak-lensing detections of intercluster filaments using wide-field Dark Energy Camera (DECam) observations from the Local Volume Complete Cluster Survey (LoVoCCS). A matched-filter method was applied to identify filamentary structures in three nearby ($z < 0.1$) systems centered on Abell 401, Abell 2029, and Abell 3558. We discover two prominent filaments ($\geq 4\sigma$) in each system, with the strongest detections ($6.4\sigma - 7.3\sigma$) around Abell 401 and Abell 2029. In particular, we report the first robust weak-lensing detections $(>5 \sigma)$ of the intercluster bridges connecting the cluster pairs Abell 401/399, Abell 2029/2033, Abell 2029/SIG, and Abell 3558/3556. Adopting a filament convergence model motivated by numerical simulations, we infer the maximum convergence ($\kappa_0$) and characteristic width ($h_{\mathrm{c}}$) for all six filaments, yielding $\kappa_0 \sim 0.015 - 0.053$ and $h_{\mathrm{c}} \sim 0.11 - 0.45 \ \mathrm{Mpc}$. The performance of the matched-filter technique is validated using mock shear catalogs and further tested on a null field around Abell 2351. We also explore the potential of using the B-mode lensing signal of filaments to suppress cluster-induced shear contamination. These results demonstrate the feasibility of directly mapping dark matter filaments with current and future wide-field weak-lensing datasets.
Figures


Figures from the paper (12 more)




Forward citations
Cited by 1 Pith paper
-
LoVoCCS. III. Third Generation Pipeline & The Hercules Supercluster
A new LSST-pipeline-based reduction and multi-plane weak-lensing analysis measures the Hercules supercluster at 8.9 x 10^14 solar masses and attributes Abell 2147's inflated dynamical mass to a recent pericenter passage.
Reference graph
Works this paper leans on
-
[1]
2017, A&A, 606, A1, doi: 10.1051/0004-6361/201730497 Astropy Collaboration, Robitaille, T
Akamatsu, H., Fujita, Y., Akahori, T., et al. 2017, A&A, 606, A1, doi: 10.1051/0004-6361/201730497 Astropy Collaboration, Robitaille, T. P., Tollerud, E. J., et al. 2013, A&A, 558, A33, doi: 10.1051/0004-6361/201322068 Astropy Collaboration, Price-Whelan, A. M., Sip˝ ocz, B. M., et al. 2018, AJ, 156, 123, doi: 10.3847/1538-3881/aabc4f Astropy Collaboratio...
-
[2]
Bartelmann, M., & Schneider, P. 2001, PhR, 340, 291, doi: 10.1016/S0370-1573(00)00082-X 22 Ben ´ ıtez, N., Ford, H., Bouwens, R., et al. 2004, ApJS, 150, 1, doi: 10.1086/380120
-
[3]
Bond, J. R., Kofman, L., & Pogosyan, D. 1996, Nature, 380, 603, doi: 10.1038/380603a0
doi:10.1038/380603a0 1996
-
[4]
2018, A&A, 609, A49, doi: 10.1051/0004-6361/201731699
Beelen, A. 2018, A&A, 609, A49, doi: 10.1051/0004-6361/201731699
-
[5]
Cautun, M., van de Weygaert, R., Jones, B. J. T., & Frenk, C. S. 2014, MNRAS, 441, 2923, doi: 10.1093/mnras/stu768
-
[6]
2016, MNRAS, 457, 2391, doi: 10.1093/mnras/stw142
Clampitt, J., Miyatake, H., Jain, B., & Takada, M. 2016, MNRAS, 457, 2391, doi: 10.1093/mnras/stw142
-
[8]
Colless, M., Dalton, G., Maddox, S., et al. 2001, MNRAS, 328, 1039, doi: 10.1046/j.1365-8711.2001.04902.x DESI Collaboration, Abdul-Karim, M., Adame, A. G., et al. 2025, arXiv e-prints, arXiv:2503.14745, doi: 10.48550/arXiv.2503.14745
arXiv 2001
-
[9]
P., Werner, N., Clowe, D., et al
Dietrich, J. P., Werner, N., Clowe, D., et al. 2012, Nature, 487, 202, doi: 10.1038/nature11224
Show all 57 references
-
[10]
2006, MNRAS, 370, 656, doi: 10.1111/j.1365-2966.2006.10511.x
Bonaldi, A. 2006, MNRAS, 370, 656, doi: 10.1111/j.1365-2966.2006.10511.x
2006
-
[11]
D., & Hudson, M
Epps, S. D., & Hudson, M. J. 2017, MNRAS, 468, 2605, doi: 10.1093/mnras/stx517
2017 doi
-
[12]
T., Honscheid, K., et al
Flaugher, B., Diehl, H. T., Honscheid, K., et al. 2015, AJ, 150, 150, doi: 10.1088/0004-6256/150/5/150
2015 doi
-
[13]
2016, The Journal of Open Source Software, 1, 24, doi: 10.21105/joss.00024
Foreman-Mackey, D. 2016, The Journal of Open Source Software, 1, 24, doi: 10.21105/joss.00024
2016 doi
-
[14]
W., Lang, D., & Goodman, J
Foreman-Mackey, D., Hogg, D. W., Lang, D., & Goodman, J. 2013, PASP, 125, 306, doi: 10.1086/670067
2013 doi
-
[15]
2022, ApJ, 933, 84, doi: 10.3847/1538-4357/ac68e8
Fu, S., Dell’Antonio, I., Chary, R.-R., et al. 2022, ApJ, 933, 84, doi: 10.3847/1538-4357/ac68e8
2022 doi
-
[16]
2024, ApJ, 974, 69, doi: 10.3847/1538-4357/ad67c6
Fu, S., Dell’Antonio, I., Escalante, Z., et al. 2024, ApJ, 974, 69, doi: 10.3847/1538-4357/ad67c6
2024 doi
-
[17]
P., Busarello, G., Merluzzi, P., et al
Haines, C. P., Busarello, G., Merluzzi, P., et al. 2018, MNRAS, 481, 1055, doi: 10.1093/mnras/sty2338
2018 doi
-
[18]
R., Millman, K
Harris, C. R., Millman, K. J., van der Walt, S. J., et al. 2020, Nature, 585, 357, doi: 10.1038/s41586-020-2649-2
2020 doi
-
[19]
F., Schmitz, M., et al
Helou, G., Madore, B. F., Schmitz, M., et al. 1991, in Astrophysics and Space Science Library, Vol. 171, Databases and On-line Data in Astronomy, ed. M. A. Albrecht & D. Egret, 89–106, doi: 10.1007/978-94-011-3250-3 10
1991 doi
-
[20]
2014, MNRAS, 441, 745, doi: 10.1093/mnras/stu583
Higuchi, Y., Oguri, M., & Shirasaki, M. 2014, MNRAS, 441, 745, doi: 10.1093/mnras/stu583
2014 doi
-
[21]
2020, MNRAS, 497, 52, doi: 10.1093/mnras/staa1766
Higuchi, Y., Okabe, N., Merluzzi, P., et al. 2020, MNRAS, 497, 52, doi: 10.1093/mnras/staa1766
2020 doi
-
[22]
D., Radiconi, F., Romero, C., et al
Hincks, A. D., Radiconi, F., Romero, C., et al. 2022, MNRAS, 510, 3335, doi: 10.1093/mnras/stab3391
2022 doi
-
[23]
2003, MNRAS, 343, 459, doi: 10.1046/j.1365-8711.2003.06683.x
Hirata, C., & Seljak, U. 2003, MNRAS, 343, 459, doi: 10.1046/j.1365-8711.2003.06683.x
2003
-
[24]
2001, A&A, 370, 743, doi: 10.1051/0004-6361:20010293
Hoekstra, H. 2001, A&A, 370, 743, doi: 10.1051/0004-6361:20010293
2001 doi
-
[25]
Hunter, J. D. 2007, Computing in Science & Engineering, 9, 90, doi: 10.1109/MCSE.2007.55
2007 doi
-
[26]
J., Cha, S., & Cho, H
HyeongHan, K., Jee, M. J., Cha, S., & Cho, H. 2024, Nature Astronomy, 8, 377, doi: 10.1038/s41550-023-02164-w
2024 doi
-
[29]
Nishizawa, A. J. 2020, MNRAS, 495, 3695, doi: 10.1093/mnras/staa1390
2020 doi
- [30]
-
[31]
M., Seljak, U., et al
Mandelbaum, R., Hirata, C. M., Seljak, U., et al. 2005, MNRAS, 361, 1287, doi: 10.1111/j.1365-2966.2005.09282.x
2005
-
[32]
2018, PASJ, 70, S25, doi: 10.1093/pasj/psx130
Mandelbaum, R., Miyatake, H., Hamana, T., et al. 2018, PASJ, 70, S25, doi: 10.1093/pasj/psx130
2018 doi
-
[33]
2018, MNRAS, 480, 5113, doi: 10.1093/mnras/sty2206
Marinacci, F., Vogelsberger, M., Pakmor, R., et al. 2018, MNRAS, 480, 5113, doi: 10.1093/mnras/sty2206
2018 doi
-
[34]
2010, A&A, 519, A23, doi: 10.1051/0004-6361/200912866
Maturi, M., Angrick, C., Pace, F., & Bartelmann, M. 2010, A&A, 519, A23, doi: 10.1051/0004-6361/200912866
2010 doi
-
[35]
2005, A&A, 442, 851, doi: 10.1051/0004-6361:20042600
Moscardini, L. 2005, A&A, 442, 851, doi: 10.1051/0004-6361:20042600
2005 doi
-
[36]
2013, A&A, 559, A112, doi: 10.1051/0004-6361/201322007
Maturi, M., & Merten, J. 2013, A&A, 559, A112, doi: 10.1051/0004-6361/201322007
2013 doi
-
[37]
2020, ApJ, 893, 8, doi: 10.3847/1538-4357/ab7c58
McCleary, J., dell’Antonio, I., & von der Linden, A. 2020, ApJ, 893, 8, doi: 10.3847/1538-4357/ab7c58
2020 doi
-
[38]
Mead, J. M. G., King, L. J., & McCarthy, I. G. 2010, MNRAS, 401, 2257, doi: 10.1111/j.1365-2966.2009.15840.x
2010
-
[39]
P., et al
Merluzzi, P., Busarello, G., Haines, C. P., et al. 2015, MNRAS, 446, 803, doi: 10.1093/mnras/stu2085
2015 doi
-
[40]
2025, A&A, 698, A270, doi: 10.1051/0004-6361/202554944
Migkas, K., Pacaud, F., Tuominen, T., & Aghanim, N. 2025, A&A, 698, A270, doi: 10.1051/0004-6361/202554944
2025 doi
-
[41]
S., Walker, S
Mirakhor, M. S., Walker, S. A., & Runge, J. 2022, MNRAS, 509, 1109, doi: 10.1093/mnras/stab2979
2022 doi
-
[42]
Y., et al
Mitsuishi, I., Gupta, A., Yamasaki, N. Y., et al. 2012, PASJ, 64, 18, doi: 10.1093/pasj/64.1.18 23
2012 doi
-
[43]
P., Pillepich, A., Springel, V., et al
Naiman, J. P., Pillepich, A., Springel, V., et al. 2018, MNRAS, 477, 1206, doi: 10.1093/mnras/sty618 NASA/IPAC Extragalactic Database (NED). 2019, IPAC, doi: 10.26132/NED1
2018 doi
-
[44]
F., Frenk, C
Navarro, J. F., Frenk, C. S., & White, S. D. M. 1997, ApJ, 490, 493, doi: 10.1086/304888
1997 doi
-
[46]
2018b, MNRAS, 475, 624, doi: 10.1093/mnras/stx3040
Nelson, D., Pillepich, A., Springel, V., et al. 2018b, MNRAS, 475, 624, doi: 10.1093/mnras/stx3040
-
[47]
2021, MNRAS, 502, 5593, doi: 10.1093/mnras/stab395
Osato, K., Liu, J., & Haiman, Z. 2021, MNRAS, 502, 5593, doi: 10.1093/mnras/stab395
2021 doi
-
[48]
Clarke, T. E. 2013, ApJ, 773, 114, doi: 10.1088/0004-637X/773/2/114
2013 doi
-
[49]
W., Pointecouteau, E., & Melin, J
Piffaretti, R., Arnaud, M., Pratt, G. W., Pointecouteau, E., & Melin, J. B. 2011, A&A, 534, A109, doi: 10.1051/0004-6361/201015377
2011 doi
-
[50]
2018, MNRAS, 475, 648, doi: 10.1093/mnras/stx3112
Pillepich, A., Nelson, D., Hernquist, L., et al. 2018, MNRAS, 475, 648, doi: 10.1093/mnras/stx3112
2018 doi
-
[51]
2022, MNRAS, 517, 5232, doi: 10.1093/mnras/stac3015
Radiconi, F., Vacca, V., Battistelli, E., et al. 2022, MNRAS, 517, 5232, doi: 10.1093/mnras/stac3015
2022 doi
-
[52]
Rowe, B. T. P., Jarvis, M., Mandelbaum, R., et al. 2015, Astronomy and Computing, 10, 121, doi: 10.1016/j.ascom.2015.02.002
2015 doi
-
[53]
2025, in American Astronomical Society Meeting Abstracts, Vol
Shinde, R., Winkler, A., & Dell’Antonio, I. 2025, in American Astronomical Society Meeting Abstracts, Vol. 245, American Astronomical Society Meeting Abstracts #245, 472.03
2025
-
[54]
J., Walker, S
Sohn, J., Geller, M. J., Walker, S. A., et al. 2019, ApJ, 871, 129, doi: 10.3847/1538-4357/aaf1cc
2019 doi
-
[55]
Springel, V., White, S. D. M., Jenkins, A., et al. 2005, Nature, 435, 629, doi: 10.1038/nature03597 The pandas development Team. 2025,, v2.3.1 Zenodo, doi: 10.5281/zenodo.3509134
2005 doi
-
[56]
2015, ApJ, 806, 211, doi: 10.1088/0004-637X/806/2/211
Ursino, E., Galeazzi, M., Gupta, A., et al. 2015, ApJ, 806, 211, doi: 10.1088/0004-637X/806/2/211
2015 doi
-
[57]
E., et al
Virtanen, P., Gommers, R., Oliphant, T. E., et al. 2020, Nature Methods, 17, 261, doi: 10.1038/s41592-019-0686-2
2020 doi
-
[58]
A., Fabian, A
Walker, S. A., Fabian, A. C., Sanders, J. S., George, M. R., & Tawara, Y. 2012, MNRAS, 422, 3503, doi: 10.1111/j.1365-2966.2012.20860.x
2012
-
[59]
S., et al
Werner, N., Finoguenov, A., Kaastra, J. S., et al. 2008, A&A, 482, L29, doi: 10.1051/0004-6361:200809599 Wes McKinney. 2010, in Proceedings of the 9th Python in Science Conference, ed. St´ efan van der Walt & Jarrod Millman, 56 – 61, doi: 10.25080/Majora-92bf1922-00a
2008 doi
-
[60]
2020, A&A, 633, A89, doi: 10.1051/0004-6361/201936678
Xia, Q., Robertson, N., Heymans, C., et al. 2020, A&A, 633, A89, doi: 10.1051/0004-6361/201936678
2020 doi
-
[61]
H., et al
Zehavi, I., Zheng, Z., Weinberg, D. H., et al. 2011, ApJ, 736, 59, doi: 10.1088/0004-637X/736/1/59
2011 doi
Reviewed August 4, 2026 · model on record in the stance chip above.
Discussion (0). Continue with ORCID to comment.