APOGEE chemical abundances of stars in the MW satellites Fornax, Sextans, Draco and Carina
Pith reviewed 2026-05-18 00:14 UTC · model grok-4.3
The pith
Alpha-element ratios in four Milky Way dwarf satellites correlate directly with galaxy luminosity and mass.
A machine-rendered reading of the paper's core claim, the machinery that carries it, and where it could break.
Core claim
The distribution of alpha elements strongly correlates with galaxy luminosity and hence mass, underscoring the critical role of galaxy mass in shaping chemical evolution. These dwarf galaxies exhibit [Al/Fe] approximately minus 0.5, comparable to metal-poor stars in the Milky Way. Nitrogen-rich field stars identified in Fornax display distinct metallicities from its known globular clusters and may represent relics of destroyed clusters.
What carries the argument
APOGEE-derived [Si/Fe] and other alpha-element abundance ratios plotted against galaxy luminosity, which directly traces the mass-dependent chemical evolution pathway.
If this is right
- Higher-luminosity dwarfs experienced more rapid or efficient alpha-element production than their fainter counterparts.
- Shallow gravitational potentials in low-mass dwarfs allowed greater loss of metals and altered the balance of core-collapse versus Type Ia supernovae contributions.
- Nitrogen-rich stars in Fornax provide direct evidence that globular-cluster disruption has contributed field stars to the dwarf's present population.
- Similar abundance patterns can be used to chemically tag stars in the Milky Way halo that originated in now-disrupted satellites.
Where Pith is reading between the lines
- The observed mass-abundance relation offers a way to estimate the masses of fully disrupted progenitor galaxies whose stars now reside in stellar streams.
- Extending the same abundance analysis to additional satellites would test whether the correlation holds across the full range of dwarf galaxy luminosities.
- The similarity in [Al/Fe] between dwarfs and the Milky Way hints that early aluminum production occurred under comparable conditions before the galaxies assembled.
Load-bearing premise
The 74 observed stars are representative of each galaxy's overall stellar population and APOGEE abundance measurements carry no large systematic offsets in these very metal-poor systems.
What would settle it
A larger sample of stars in the same four galaxies showing no trend between [Si/Fe] and galaxy luminosity would remove support for the claimed mass dependence.
Figures


read the original abstract
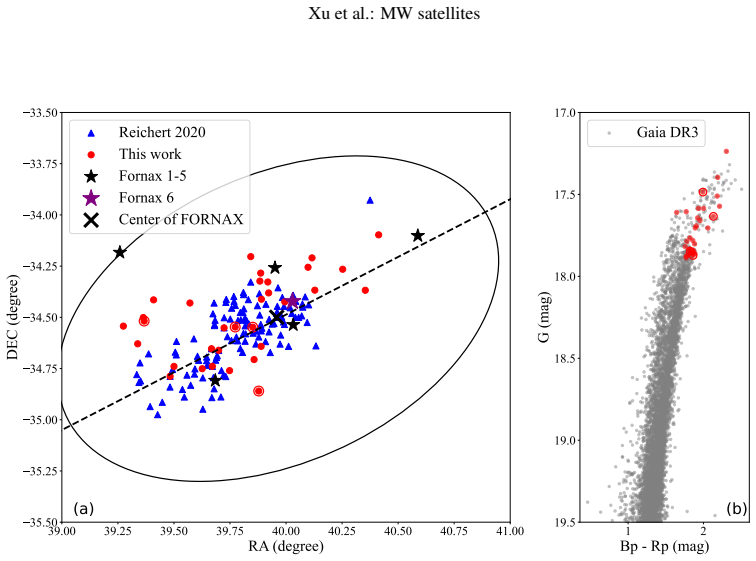
During its evolution, the Milky Way (MW) incorporated numerous dwarf galaxies, particularly low-mass systems. The surviving dwarf galaxies orbiting the MW serve as exceptional laboratories for studying the unique properties of these systems. Their metal-poor environments and shallow gravitational potentials likely drive significant differences in star formation and star cluster properties compared to those in the MW. Using high-quality near-infrared spectra from the APOGEE survey, we determined abundances of Fe, C, N, O, Mg, Al, Si, Ca, Ti, Cr, Mn, Ni, and Ce for 74 stars in four MW satellite dwarf galaxies: Fornax, Sextans, Draco, and Carina. Our analysis reveals that the distribution of $\alpha$ elements (e.g., [Si/Fe]) strongly correlates with galaxy luminosity (and hence mass), underscoring the critical role of galaxy mass in shaping chemical evolution. These dwarf galaxies exhibit [Al/Fe$]\sim -0.5$, which is comparable to those of the metal-poor stars in the MW. Additionally, we identified nitrogen-rich field stars in the Fornax dwarf galaxy, which display distinct metallicities compared to its known globular clusters (GCs). If these stars originated in GCs and subsequently escaped, their presence suggests we are observing relics of destroyed GCs, offering possible evidence of cluster disruption.
Editorial analysis
A structured set of objections, weighed in public.
Referee Report
Summary. The manuscript analyzes high-quality APOGEE near-infrared spectra to derive abundances of Fe, C, N, O, Mg, Al, Si, Ca, Ti, Cr, Mn, Ni, and Ce for a total of 74 stars in four Milky Way satellite dwarf galaxies: Fornax, Sextans, Draco, and Carina. The central result is a reported strong correlation between α-element distributions (exemplified by [Si/Fe]) and galaxy luminosity/mass, with additional notes that [Al/Fe] ≈ −0.5 matches Milky Way metal-poor stars and that nitrogen-rich field stars in Fornax may represent relics of disrupted globular clusters.
Significance. If the α-element versus luminosity correlation is shown to be robust, the work would supply useful observational constraints on how galaxy mass influences chemical evolution in low-mass systems and on the role of dwarf satellites in Milky Way assembly. The identification of candidate globular-cluster escapees in Fornax would also contribute to understanding cluster disruption. The use of APOGEE spectra for these faint, metal-poor targets is a methodological strength, but the small total sample limits the strength of the conclusions.
major comments (2)
- [Abstract] Abstract: the claim that α-element distributions (e.g. [Si/Fe]) 'strongly correlate' with galaxy luminosity is presented without per-galaxy star counts, a correlation coefficient or p-value, or any test of robustness (e.g., removal of the most metal-poor stars or the dominant galaxy). With only 74 stars total, even modest imbalances or a few outliers can generate an apparent trend, directly undermining the load-bearing conclusion that galaxy mass shapes chemical evolution.
- [Methods / Results] Sample selection and error analysis (likely §2–3): the manuscript does not provide explicit criteria for choosing the 74 stars, an error budget that accounts for possible systematic offsets in APOGEE abundances at [Fe/H] ≲ −2 in low-mass systems, or direct comparisons to literature values for the same galaxies. These omissions leave the representativeness of the sample and the accuracy of the reported trends unverified.
minor comments (1)
- [Abstract] Abstract: the notation '[Al/Fe$]' contains a stray dollar sign and should be rendered consistently as [Al/Fe].
Simulated Author's Rebuttal
We thank the referee for their careful reading and constructive feedback on our manuscript. We agree that additional quantitative details and methodological transparency will strengthen the presentation of our results. Below we respond to each major comment and indicate the revisions we will make.
read point-by-point responses
-
Referee: [Abstract] Abstract: the claim that α-element distributions (e.g. [Si/Fe]) 'strongly correlate' with galaxy luminosity is presented without per-galaxy star counts, a correlation coefficient or p-value, or any test of robustness (e.g., removal of the most metal-poor stars or the dominant galaxy). With only 74 stars total, even modest imbalances or a few outliers can generate an apparent trend, directly undermining the load-bearing conclusion that galaxy mass shapes chemical evolution.
Authors: We accept that the abstract would be improved by explicit quantification. In the revised manuscript we will report the number of stars per galaxy, compute and quote the Spearman rank correlation coefficient together with its p-value for the [Si/Fe]–luminosity relation, and add a short robustness check that excludes both the most metal-poor stars and the dominant galaxy (Fornax). These additions will be placed in the abstract and expanded in the results section while preserving the original scientific interpretation. revision: yes
-
Referee: [Methods / Results] Sample selection and error analysis (likely §2–3): the manuscript does not provide explicit criteria for choosing the 74 stars, an error budget that accounts for possible systematic offsets in APOGEE abundances at [Fe/H] ≲ −2 in low-mass systems, or direct comparisons to literature values for the same galaxies. These omissions leave the representativeness of the sample and the accuracy of the reported trends unverified.
Authors: We agree that these details should be stated more explicitly. We will expand Section 2 to list the precise selection criteria (APOGEE quality flags, minimum S/N, radial-velocity membership cuts, and spatial/kinematic criteria). In Section 3 we will add a dedicated paragraph on possible systematic offsets in APOGEE abundances at [Fe/H] ≲ −2, referencing existing APOGEE validation studies, and we will insert direct abundance comparisons with published optical studies of the same four galaxies to demonstrate consistency of the reported trends. revision: yes
Circularity Check
No circularity: purely observational abundance study with no derivations or self-referential reductions
full rationale
The paper presents direct APOGEE spectroscopic abundance measurements (Fe, C, N, O, Mg, Al, Si, Ca, Ti, Cr, Mn, Ni, Ce) for 74 stars in Fornax, Sextans, Draco, and Carina, followed by empirical comparisons of alpha-element distributions (e.g., [Si/Fe]) against galaxy luminosity. No equations, model derivations, fitted parameters renamed as predictions, or uniqueness theorems appear in the provided text. The central claim is an observed correlation from the data itself, not a quantity forced by the paper's own inputs or self-citations. This matches the default expectation for an observational measurement paper and receives the lowest circularity score.
Axiom & Free-Parameter Ledger
Lean theorems connected to this paper
-
IndisputableMonolith/Foundation/RealityFromDistinction.leanreality_from_one_distinction unclear?
unclearRelation between the paper passage and the cited Recognition theorem.
Our analysis reveals that the distribution of α elements (e.g., [Si/Fe]) strongly correlates with galaxy luminosity (and hence mass)
-
IndisputableMonolith/Cost/FunctionalEquation.leanwashburn_uniqueness_aczel unclear?
unclearRelation between the paper passage and the cited Recognition theorem.
we perform a polynomial fit to the distribution of [Si/Fe] vs. [Fe/H] for each dwarf galaxy ... intersection with [Si/Fe]=0
What do these tags mean?
- matches
- The paper's claim is directly supported by a theorem in the formal canon.
- supports
- The theorem supports part of the paper's argument, but the paper may add assumptions or extra steps.
- extends
- The paper goes beyond the formal theorem; the theorem is a base layer rather than the whole result.
- uses
- The paper appears to rely on the theorem as machinery.
- contradicts
- The paper's claim conflicts with a theorem or certificate in the canon.
- unclear
- Pith found a possible connection, but the passage is too broad, indirect, or ambiguous to say the theorem truly supports the claim.
Reference graph
Works this paper leans on
-
[1]
, " * write output.state after.block = add.period write newline
ENTRY address archiveprefix author booktitle chapter edition editor howpublished institution eprint journal key month note number organization pages publisher school series title type volume year label extra.label sort.label short.list INTEGERS output.state before.all mid.sentence after.sentence after.block FUNCTION init.state.consts #0 'before.all := #1 ...
-
[2]
" write newline "" before.all 'output.state := FUNCTION n.dashify 't := "" t empty not t #1 #1 substring "-" = t #1 #2 substring "--" = not "--" * t #2 global.max substring 't := t #1 #1 substring "-" = "-" * t #2 global.max substring 't := while if t #1 #1 substring * t #2 global.max substring 't := if while FUNCTION word.in bbl.in " " * FUNCTION format....
- [3]
-
[4]
Adamo , A., Bradley , L. D., Vanzella , E., et al. 2024, , 632, 513
work page 2024
-
[5]
Allende Prieto , C., Beers , T. C., Wilhelm , R., et al. 2006, , 636, 804
work page 2006
-
[6]
Alonso , A., Arribas , S., & Mart \' nez-Roger , C. 1999, , 140, 261
work page 1999
- [7]
-
[8]
M., Lind , K., Osorio , Y., et al
Amarsi , A. M., Lind , K., Osorio , Y., et al. 2020, , 642, A62
work page 2020
-
[9]
Amorisco , N. C. & Evans , N. W. 2012, , 756, L2
work page 2012
-
[10]
Arnett , W. D. 1971, , 166, 153
work page 1971
- [11]
-
[12]
Asplund , M., Grevesse , N., & Sauval , A. J. 2005, in Astronomical Society of the Pacific Conference Series, Vol. 336, Cosmic Abundances as Records of Stellar Evolution and Nucleosynthesis, ed. I. Barnes , Thomas G. & F. N. Bash , 25
work page 2005
-
[13]
S., Christlieb , N., Beers , T
Barklem , P. S., Christlieb , N., Beers , T. C., et al. 2005, , 439, 129
work page 2005
- [14]
- [15]
-
[16]
Beaton , R. L., Oelkers , R. J., Hayes , C. R., et al. 2021, , 162, 302
work page 2021
-
[17]
Bell , E. F., McIntosh , D. H., Katz , N., & Weinberg , M. D. 2003, , 149, 289
work page 2003
-
[18]
Belokurov , V., Erkal , D., Evans , N. W., Koposov , S. E., & Deason , A. J. 2018, , 478, 611
work page 2018
-
[19]
Bensby , T., Feltzing , S., & Oey , M. S. 2014, , 562, A71
work page 2014
-
[20]
Bisterzo , S., Travaglio , C., Gallino , R., Wiescher , M., & K \"a ppeler , F. 2014, , 787, 10
work page 2014
-
[21]
Blanton , M. R., Bershady , M. A., Abolfathi , B., et al. 2017, , 154, 28
work page 2017
-
[22]
Bowen , I. S. & Vaughan , A. H., J. 1973, , 12, 1430
work page 1973
-
[23]
L., Travaglio , C., & Smith , V
Busso , M., Gallino , R., Lambert , D. L., Travaglio , C., & Smith , V. V. 2001, , 557, 802
work page 2001
-
[24]
Carlin , J. L., Sheffield , A. A., Cunha , K., & Smith , V. V. 2018, , 859, L10
work page 2018
- [25]
- [26]
- [27]
-
[28]
C \^o t \'e , B., Fryer , C. L., Belczynski , K., et al. 2018, , 855, 99
work page 2018
-
[29]
de los Reyes , M. A. C., Kirby , E. N., Ji , A. P., & Nu \ n ez , E. H. 2022, , 925, 66
work page 2022
-
[30]
Eisenstein , D. J., Weinberg , D. H., Agol , E., et al. 2011, , 142, 72
work page 2011
- [31]
-
[32]
Fern \'a ndez-Trincado , J. G., Beers , T. C., Barbuy , B., et al. 2022, , 663, A126
work page 2022
-
[33]
Fern \'a ndez-Trincado , J. G., Beers , T. C., Minniti , D., et al. 2020, , 903, L17
work page 2020
-
[34]
Fern \'a ndez-Trincado , J. G., Beers , T. C., Minniti , D., et al. 2021, , 648, A70
work page 2021
-
[35]
Fern \'a ndez-Trincado , J. G., Beers , T. C., Tang , B., et al. 2019, , 488, 2864
work page 2019
-
[36]
Fern \'a ndez-Trincado , J. G., Robin , A. C., Moreno , E., et al. 2016, , 833, 132
work page 2016
-
[37]
G., Zamora , O., Garc \' a-Hern \'a ndez , D
Fern \'a ndez-Trincado , J. G., Zamora , O., Garc \' a-Hern \'a ndez , D. A., et al. 2017, , 846, L2
work page 2017
-
[38]
A., Alabi , A., Romanowsky , A
Forbes , D. A., Alabi , A., Romanowsky , A. J., Brodie , J. P., & Arimoto , N. 2020, , 492, 4874
work page 2020
-
[39]
Foster , C., Hopkins , A. M., Gunawardhana , M., et al. 2012, , 547, A79
work page 2012
-
[40]
Fulbright , J. P. 2000, , 120, 1841
work page 2000
-
[41]
Gaia Collaboration , Helmi , A., van Leeuwen , F., et al. 2018, , 616, A12
work page 2018
-
[42]
Gonz \'a lez Hern \'a ndez , J. I. & Bonifacio , P. 2009, , 497, 497
work page 2009
-
[43]
Grebel , E. K., Gallagher , III, J. S., & Harbeck , D. 2003, , 125, 1926
work page 2003
-
[44]
Gustafsson , B., Edvardsson , B., Eriksson , K., et al. 2008, , 486, 951
work page 2008
-
[45]
Hasselquist , S., Hayes , C. R., Lian , J., et al. 2021, , 923, 172
work page 2021
-
[46]
Hasselquist , S., Shetrone , M., Smith , V., et al. 2017, , 845, 162
work page 2017
- [47]
- [48]
-
[49]
Hodge , P. W. 1971, , 9, 35
work page 1971
-
[50]
Horta , D., Schiavon , R. P., Mackereth , J. T., et al. 2021, , 500, 1385
work page 2021
- [51]
-
[52]
2024, Science China Physics, Mechanics, and Astronomy, 67, 259513
Huang , R., Tang , B., Li , C., et al. 2024, Science China Physics, Mechanics, and Astronomy, 67, 259513
work page 2024
-
[53]
Ibata , R., Lewis , G. F., Martin , N. F., Bellazzini , M., & Correnti , M. 2013, , 765, L15
work page 2013
-
[54]
Karakas , A. I. & Lattanzio , J. C. 2014, , 31, e030
work page 2014
- [55]
- [56]
-
[57]
Kobayashi , C., Umeda , H., Nomoto , K., Tominaga , N., & Ohkubo , T. 2006, , 653, 1145
work page 2006
- [58]
-
[59]
Lagarde , N., Decressin , T., Charbonnel , C., et al. 2012, , 543, A108
work page 2012
-
[60]
S., Eitner , P., Magg , E., et al
Larsen , S. S., Eitner , P., Magg , E., et al. 2022, , 660, A88
work page 2022
-
[61]
Law , D. R. & Majewski , S. R. 2010, , 718, 1128
work page 2010
-
[62]
F., Serrano , A., & Torres-Peimbert , S
Lequeux , J., Peimbert , M., Rayo , J. F., Serrano , A., & Torres-Peimbert , S. 1979, , 80, 155
work page 1979
- [63]
- [64]
- [65]
- [66]
-
[67]
Lind , K., Koposov , S. E., Battistini , C., et al. 2015, , 575, L12
work page 2015
- [68]
-
[69]
Majewski , S. R., Schiavon , R. P., Frinchaboy , P. M., et al. 2017, , 154, 94
work page 2017
-
[70]
Majewski , S. R., Skrutskie , M. F., Weinberg , M. D., & Ostheimer , J. C. 2003, , 599, 1082
work page 2003
-
[71]
Martell , S. L., Shetrone , M. D., Lucatello , S., et al. 2016, , 825, 146
work page 2016
- [72]
-
[73]
Masseron , T., Merle , T., & Hawkins , K. 2016, BACCHUS: Brussels Automatic Code for Characterizing High accUracy Spectra , Astrophysics Source Code Library, record ascl:1605.004
work page 2016
- [74]
-
[75]
McConnachie , A. W. 2012, , 144, 4
work page 2012
- [76]
-
[77]
M \'e sz \'a ros , S., Martell , S. L., Shetrone , M., et al. 2015, , 149, 153
work page 2015
- [78]
-
[79]
R., C \^o t \'e , P., Santana , F
Mu \ n oz , R. R., C \^o t \'e , P., Santana , F. A., et al. 2018, , 860, 66
work page 2018
-
[80]
C., Vasiliev , E., Iorio , G., Evans , N
Myeong , G. C., Vasiliev , E., Iorio , G., Evans , N. W., & Belokurov , V. 2019, , 488, 1235
work page 2019
discussion (0)
Sign in with ORCID, Apple, or X to comment. Anyone can read and Pith papers without signing in.