PyPeT: A Python Perfusion Tool for Automated Quantitative Brain CT and MR Perfusion Analysis
Pith reviewed 2026-05-21 18:28 UTC · model grok-4.3
The pith
PyPeT produces CBF, CBV, MTT, TTP and Tmax maps from raw four-dimensional CT and MR perfusion data with mean SSIM of 0.8 against FDA-approved tools.
A machine-rendered reading of the paper's core claim, the machinery that carries it, and where it could break.
Core claim
PyPeT is an openly available Python framework that accepts raw four-dimensional CTP and MRP data and generates CBF, CBV, MTT, TTP, and Tmax maps through a unified modular pipeline, achieving a mean SSIM around 0.8 in direct comparisons with reference maps produced by three FDA-approved commercial perfusion tools.
What carries the argument
The PyPeT processing pipeline, a unified modular framework for CTP and MRP data that includes inline documentation and an extensive debug visualization mode for each processing step.
If this is right
- Researchers gain a free, modifiable alternative to costly closed-source perfusion software for both CT and MR modalities.
- A single codebase can handle data from two different imaging modalities without separate programs.
- Inline documentation and debug mode allow users to inspect and verify every step of map generation.
- Low computational requirements support use on standard research workstations rather than specialized hardware.
Where Pith is reading between the lines
- Widespread adoption could let groups add custom denoising or deconvolution methods and share them as community extensions.
- If quantitative values prove repeatable across scanner vendors, the tool might serve as a common reference for multi-center perfusion studies.
- Embedding PyPeT inside larger image-analysis pipelines could enable automated stroke triage workflows that combine perfusion with diffusion or angiography data.
Load-bearing premise
Agreement measured by SSIM of approximately 0.8 with commercial outputs constitutes sufficient validation of quantitative accuracy for research or potential clinical use.
What would settle it
A side-by-side clinical study in which PyPeT-derived infarct core or penumbra volumes differ from commercial-tool volumes by more than 20 percent on the same patient scans.
Figures


read the original abstract
Computed tomography perfusion (CTP) and magnetic resonance perfusion (MRP) are widely used in acute ischemic stroke assessment and other cerebrovascular conditions to generate quantitative maps of cerebral hemodynamics. While commercial perfusion analysis software exists, it is often costly, closed source, and lacks customizability. This work introduces PyPeT, an openly available Python Perfusion Tool for head CTP and MRP processing. PyPeT is capable of producing cerebral blood flow (CBF), cerebral blood volume (CBV), mean transit time (MTT), time-to-peak (TTP), and time-to-maximum (Tmax) maps from raw four-dimensional perfusion data. PyPeT aims to make perfusion research as accessible and customizable as possible. This is achieved through a unified framework in which both CTP and MRP data can be processed, with a strong focus on modularity, low computational burden, and significant inline documentation. PyPeT's outputs can be validated through an extensive debug mode in which every step of the process is visualized. Additional validation was performed via visual and quantitative comparison with reference perfusion maps generated by three FDA-approved commercial perfusion tools and a research tool. These comparisons show a mean SSIM around 0.8 for all comparisons, indicating a good and stable correlation with FDA-approved tools. The code for PyPeT is openly available at our GitHub https://github.com/Marijn311/CT-and-MR-Perfusion-Tool
Editorial analysis
A structured set of objections, weighed in public.
Referee Report
Summary. The manuscript introduces PyPeT, an open-source Python tool for processing raw 4D CT and MR perfusion data to generate quantitative maps of cerebral blood flow (CBF), cerebral blood volume (CBV), mean transit time (MTT), time-to-peak (TTP), and time-to-maximum (Tmax). It emphasizes modularity, low computational cost, inline documentation, and a debug visualization mode. Validation consists of visual inspection plus quantitative comparison against outputs from three FDA-approved commercial perfusion packages, with a reported mean SSIM of approximately 0.8 across the generated maps.
Significance. An accessible, customizable, and fully open perfusion analysis package would address a clear practical gap in stroke imaging research. The unified CTP/MRP framework and emphasis on reproducibility are genuine strengths that could facilitate wider adoption if the quantitative fidelity of the derived hemodynamic values is convincingly demonstrated.
major comments (1)
- [Validation / Results] Validation / Results section: The central claim that PyPeT produces reliable quantitative CBF, CBV, MTT, TTP, and Tmax maps rests on a mean SSIM of ~0.8 versus commercial outputs. SSIM is insensitive to global scaling, offset, and absolute calibration; commercial packages are known to differ by 20–40 % in ROI-averaged CBF on identical data. The manuscript supplies only aggregate SSIM and visual comparison; it does not report ROI-level Pearson r, mean absolute percentage error, or Bland–Altman limits for the actual parameter values, nor any phantom or simulated ground-truth test. This gap directly undermines the assertion of quantitative accuracy.
minor comments (2)
- [Abstract / Methods] Abstract and Methods: The patient cohort size, exact preprocessing pipeline, arterial-input-function selection criteria, and any regularization or deconvolution parameters are not stated. These details are required for independent reproduction.
- [Figures] Figure captions and text: Ensure that all quantitative comparison figures include the number of slices or volumes averaged and the precise SSIM formula or implementation used.
Simulated Author's Rebuttal
We thank the referee for the constructive feedback on the validation of PyPeT. We agree that stronger quantitative metrics would improve the manuscript and have revised accordingly where data permit.
read point-by-point responses
-
Referee: The central claim that PyPeT produces reliable quantitative CBF, CBV, MTT, TTP, and Tmax maps rests on a mean SSIM of ~0.8 versus commercial outputs. SSIM is insensitive to global scaling, offset, and absolute calibration; commercial packages are known to differ by 20–40 % in ROI-averaged CBF on identical data. The manuscript supplies only aggregate SSIM and visual comparison; it does not report ROI-level Pearson r, mean absolute percentage error, or Bland–Altman limits for the actual parameter values, nor any phantom or simulated ground-truth test. This gap directly undermines the assertion of quantitative accuracy.
Authors: We acknowledge that SSIM measures structural similarity but is limited for absolute quantification and does not address scaling or calibration differences, especially given inter-vendor variability in commercial tools. In the revised manuscript we will add ROI-level Pearson correlation coefficients and mean absolute percentage error for CBF, CBV, MTT, TTP and Tmax. We will also include Bland–Altman analysis to assess bias and limits of agreement. These metrics will be computed on the existing comparison datasets and reported in an expanded Validation section. Phantom or simulated ground-truth experiments lie outside the present study scope, which centered on direct comparison with FDA-approved clinical tools; we will state this limitation explicitly. revision: partial
- New phantom or simulated ground-truth experiments, which were not performed in the original work and would require separate data acquisition and validation infrastructure.
Circularity Check
No circularity: implementation of standard perfusion processing with external validation
full rationale
The paper introduces PyPeT as an open-source implementation for generating CBF, CBV, MTT, TTP, and Tmax maps from 4D perfusion data. It describes a modular processing pipeline with debug visualization and validates outputs via direct comparison to three independent FDA-approved commercial tools, reporting mean SSIM values. No first-principles derivations, fitted parameters presented as predictions, or self-citation chains appear in the workflow. The central claims rest on empirical agreement with external references rather than any reduction of outputs to the paper's own inputs by construction. This is a standard software-tool paper with self-contained validation against outside benchmarks.
Axiom & Free-Parameter Ledger
Lean theorems connected to this paper
-
IndisputableMonolith/Cost/FunctionalEquation.leanwashburn_uniqueness_aczel unclear?
unclearRelation between the paper passage and the cited Recognition theorem.
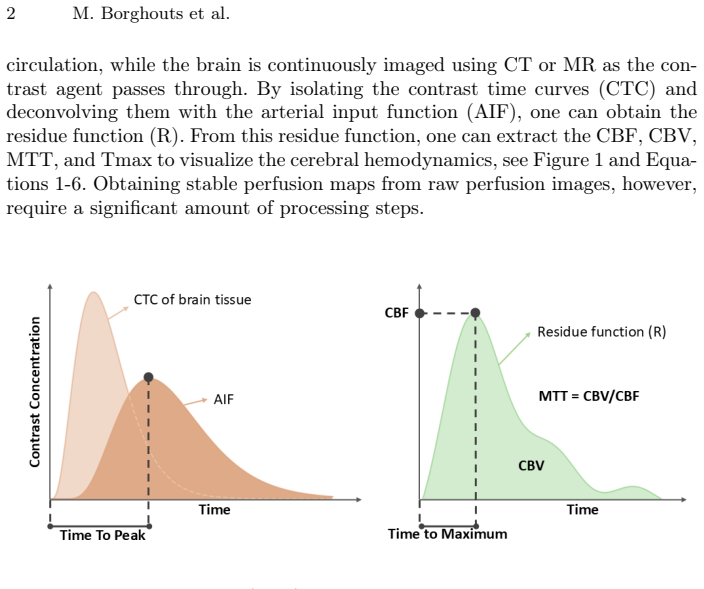
PyPeT employs an SVD-based deconvolution method to generate perfusion maps... CBF = max R(t), CBV = ∫R(t)dt, MTT = CBV/CBF
-
IndisputableMonolith/Foundation/RealityFromDistinction.leanreality_from_one_distinction unclear?
unclearRelation between the paper passage and the cited Recognition theorem.
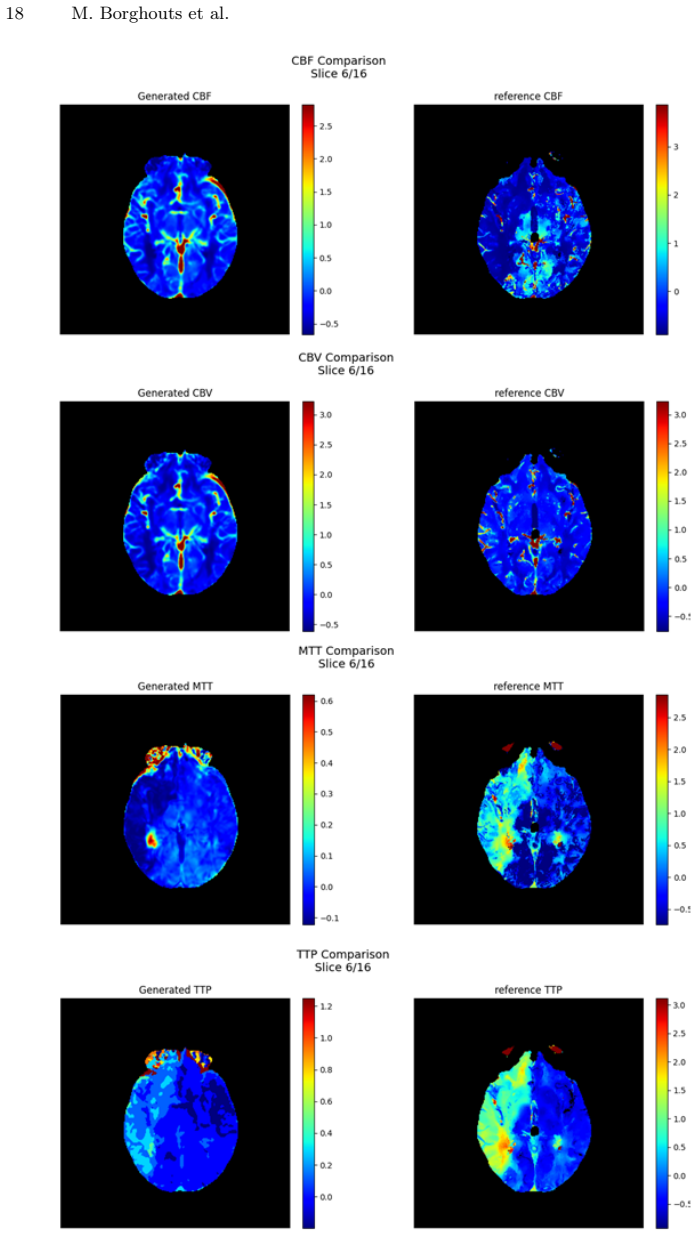
Validation... mean SSIM around 0.8... compared to three FDA-approved commercial perfusion tools
What do these tags mean?
- matches
- The paper's claim is directly supported by a theorem in the formal canon.
- supports
- The theorem supports part of the paper's argument, but the paper may add assumptions or extra steps.
- extends
- The paper goes beyond the formal theorem; the theorem is a base layer rather than the whole result.
- uses
- The paper appears to rely on the theorem as machinery.
- contradicts
- The paper's claim conflicts with a theorem or certificate in the canon.
- unclear
- Pith found a possible connection, but the passage is too broad, indirect, or ambiguous to say the theorem truly supports the claim.
Reference graph
Works this paper leans on
-
[1]
Jour- nal of Medical Imaging3, 026003 (6 2016).https://doi.org/10.1117/1.jmi.3
Bennink, E., Oosterbroek, J., Kudo, K., Viergever, M.A., Velthuis, B.K., de Jong, H.W.A.M.: Fast nonlinear regression method for ct brain perfusion analysis. Jour- nal of Medical Imaging3, 026003 (6 2016).https://doi.org/10.1117/1.jmi.3. 2.026003
-
[2]
Cereda, C.W., Christensen, S., Campbell, B.C., Mishra, N.K., Mlynash, M., Levi, C., Straka, M., Wintermark, M., Bammer, R., Albers, G.W., Parsons, M.W., Lansberg, M.G.: A benchmarking tool to evaluate computer tomography perfusion infarct core predictions against a dwi standard. Journal of Cerebral Blood Flow and Metabolism36, 1780–1789 (10 2016).https://...
work page 2016
-
[3]
Journal of Clinical Medicine12(6 2023)
Chandrabhatla, A.S., Kuo, E.A., Sokolowski, J.D., Kellogg, R.T., Park, M., Mastorakos, P.: Artificial intelligence and machine learning in the diagnosis and management of stroke: A narrative review of united states food and drug administration-approved technologies. Journal of Clinical Medicine12(6 2023). https://doi.org/10.3390/jcm12113755
-
[4]
PLoS Computational Biology12(6 2016)
Ekmekci, B., McAnany, C.E., Mura, C.: An introduction to programming for bioscientists: A python-based primer. PLoS Computational Biology12(6 2016). https://doi.org/10.1371/journal.pcbi.1004867
-
[5]
Frontiers in Neuroinformatics17(2023).https://doi.org/10.3389/fninf.2023.1202156
Fernández-Rodicio, S., Ferro-Costas, G., Sampedro-Viana, A., Bazarra-Barreiros, M., Ferreirós, A., López-Arias, E., Pérez-Mato, M., Ouro, A., Pumar, J.M., Mosqueira, A.J., Alonso-Alonso, M.L., Castillo, J., Hervella, P., Iglesias-Rey, R.: Perfusion-weighted software written in python for dsc-mri analysis. Frontiers in Neuroinformatics17(2023).https://doi....
-
[6]
Frontiers in Neuroinformatics17 (2023).https://doi.org/10.3389/fninf.2023.852105
Gava, U.A., D’Agata, F., Tartaglione, E., Renzulli, R., Grangetto, M., Bertolino, F., Santonocito, A., Bennink, E., Vaudano, G., Boghi, A., Bergui, M.: Neural network-derived perfusion maps: A model-free approach to computed tomography perfusion in patients with acute ischemic stroke. Frontiers in Neuroinformatics17 (2023).https://doi.org/10.3389/fninf.20...
-
[7]
Computers in Biology and Medicine58, 56–62 (3 2015)
Gordaliza, P.M., Mateos-Pérez, J.M., Montesinos, P., de Villoria, J.A.G., Desco, M., Vaquero, J.J.: Development and validation of an open source quantification tool for dsc-mri studies. Computers in Biology and Medicine58, 56–62 (3 2015). https://doi.org/10.1016/j.compbiomed.2015.01.002
-
[8]
Stroke52, 2328–2337 (7 2021).https://doi.org/10
Hakim, A., Christensen, S., Winzeck, S., Lansberg, M.G., Parsons, M.W., Lucas, C., Robben, D., Wiest, R., Reyes, M., Zaharchuk, G.: Predicting infarct core from computed tomography perfusion in acute ischemia with machine learning: Lessons from the isles challenge. Stroke52, 2328–2337 (7 2021).https://doi.org/10. 1161/STROKEAHA.120.030696
work page 2021
-
[9]
Magnetic Resonance in Medicine91, 1774–1786 (5 2024)
van Houdt, P.J., Ragunathan, S., Berks, M., Ahmed, Z., Kershaw, L.E., Gurney- Champion, O.J., Tadimalla, S., Arvidsson, J., Sun, Y., Kallehauge, J., Dickie, B., Lévy, S., Bell, L., Sourbron, S., Thrippleton, M.J.: Contrast-agent-based perfusion mri code repository and testing framework: Ismrm open science initiative for per- fusion imaging (osipi). Magnet...
-
[10]
Tomography2, 448–456 (2016).https://doi.org/10.18383/j.tom
Korfiatis, P., Kline, T.L., Kelm, Z.S., Carter, R.E., Hu, L.S., Erickson, B.J.: Dy- namic susceptibility contrast-mri quantification software tool: Development and evaluation. Tomography2, 448–456 (2016).https://doi.org/10.18383/j.tom. 2016.00172
-
[11]
Magnetic Resonance in Medical Sciences16, 129–136 (2017)
Kudo, K., Uwano, I., Hirai, T., Murakami, R., Nakamura, H., Fujima, N., Ya- mashita, F., Goodwin, J., Higuchi, S., Sasaki, M.: Comparison of different post- processing algorithms for dynamic susceptibility contrast perfusion imaging of cerebral gliomas. Magnetic Resonance in Medical Sciences16, 129–136 (2017). https://doi.org/10.2463/mrms.mp.2016-0036
-
[12]
Lirette, S.T., Smith, A.D., Aban, I.B.: A tool to visualize and analyze perfusion data: Development and application of the r package “ctp”. Computer Methods and Programs in Biomedicine153, 11–17 (1 2018).https://doi.org/10.1016/j. cmpb.2017.09.016
work page doi:10.1016/j 2018
-
[13]
NeuroImage298(9 2024).https://doi.org/10.1016/j.neuroimage.2024.120770
Lohrke, F., Madai, V.I., Kossen, T., Aydin, O.U., Behland, J., Hilbert, A., Mutke, M.A., Bendszus, M., Sobesky, J., Frey, D.: Perfusion parameter map generation from tof-mra in stroke using generative adversarial networks. NeuroImage298(9 2024).https://doi.org/10.1016/j.neuroimage.2024.120770
-
[14]
Magnetic Resonance in Medicine85, 1183–1194 (3 2021).https://doi.org/10.1002/mrm.28559
Lévy, S., Roche, P.H., Guye, M., Callot, V.: Feasibility of human spinal cord per- fusion mapping using dynamic susceptibility contrast imaging at 7t: Preliminary results and identified guidelines. Magnetic Resonance in Medicine85, 1183–1194 (3 2021).https://doi.org/10.1002/mrm.28559
-
[15]
Perlo, D., Tartaglione, E., Gava, U., D’Agata, F., Benninck, E., Bergui, M.: Uni- tobrain dataset: A brain perfusion dataset. In: Lecture Notes in Computer Science (including subseries Lecture Notes in Artificial Intelligence and Lecture Notes in Bioinformatics). vol. 13373 LNCS, pp. 498–509. Springer Science and Business Me- dia Deutschland GmbH (2022).h...
-
[16]
Peruzzo, D., Bertoldo, A., Zanderigo, F., Cobelli, C.: Automatic selection of arte- rial input function on dynamic contrast-enhanced mr images. Computer Methods and Programs in Biomedicine104(12 2011).https://doi.org/10.1016/j.cmpb. 2011.02.012
-
[17]
arXiv (2024).https://doi.org/10.48550/arXiv.2408
Riedel, A.E.O., de la Rosa, E., Baran, T.A., Petzsche, M.H., Baazaoui, H., Yang, K., Musio, F.A., Huang, H., Robben, D., Seia, J.O., Wiest, R., Reyes, M., Su, R., Zimmer, C., Boeckh-Behrens, T., Berndt, M., Menze, B., Rueckert, D., Wiestler, B., Wegener, S., Kirschke, J.S., Riedel, E.O.: Isles’24-a real-world longitudinal mul- timodal stroke dataset. arXi...
-
[18]
turtleizzy: https://github.com/turtleizzy/ctp_csvd (2021)
work page 2021
-
[19]
Medical Image Analysis 90(12 2023).https://doi.org/10.1016/j.media.2023.102971
de Vries, L., van Herten, R.L., Hoving, J.W., Išgum, I., Emmer, B.J., Majoie, C.B., Marquering, H.A., Gavves, E.: Spatio-temporal physics-informed learning: A novel approach to ct perfusion analysis in acute ischemic stroke. Medical Image Analysis 90(12 2023).https://doi.org/10.1016/j.media.2023.102971
-
[20]
Zanderigo, F., Bertoldo, A., Pillonetto, G., Cobelli, C.: Nonlinear stochastic regu- larization to characterize tissue residue function in bolus-tracking mri: Assessment and comparison with svd, block-circulant svd, and tikhonov. IEEE Transactions on Biomedical Engineering56, 1287–1297 (5 2009).https://doi.org/10.1109/ TBME.2009.2013820 16 M. Borghouts et...
discussion (0)
Sign in with ORCID, Apple, or X to comment. Anyone can read and Pith papers without signing in.