Forecasting synchrotron spectral parameters with QUIJOTE-MFI2 in combination with Planck and WMAP
Pith reviewed 2026-05-17 20:46 UTC · model grok-4.3
The pith
Adding QUIJOTE-MFI2 data to WMAP and Planck yields unbiased synchrotron parameter estimates with uncertainty reductions up to a factor of 43.
A machine-rendered reading of the paper's core claim, the machinery that carries it, and where it could break.
Core claim
Using simulated multi-frequency polarization maps at 1 degree FWHM and N_side=64 based on power-law and curved synchrotron spectra, the addition of QUIJOTE-MFI2 to WMAP plus Planck plus MFI data produces statistically unbiased estimates of the synchrotron spectral index β_s, curvature parameter C_s, and polarization amplitudes, with uncertainty reduction factors reaching approximately 10 for β_s, 5 for C_s, and 43 for amplitudes in bright regions. Deep QUIJOTE fields enable β_s constraints in intrinsically low signal-to-noise areas. The combination reduces the median synchrotron residual at 100 GHz by a factor of 6 to 0.033 μK_CMB, although current sensitivities remain insufficient for pixel
What carries the argument
Parametric component separation performed on simulated multi-frequency polarization maps that embed both power-law and curved synchrotron spectral models.
If this is right
- Statistically unbiased recovery of synchrotron spectral index and curvature parameters across the sky.
- Uncertainty reductions of order 10 for β_s and 5 for C_s when QUIJOTE-MFI2 data are included.
- Polarization amplitude uncertainties reduced by up to a factor of 43 in bright Galactic regions.
- A 2σ detection of synchrotron curvature becomes possible for |C_s| ≳ 0.14 in the brightest plane regions.
- Median synchrotron residual at 100 GHz lowered by a factor of 6 in deep cosmological fields.
Where Pith is reading between the lines
- Real QUIJOTE-MFI2 data can be used to test whether the simulation assumptions about Galactic emission statistics hold.
- The same low-frequency constraints may help other radio surveys that study Galactic magnetic fields or cosmic-ray electrons.
- Reduced foreground residuals at 100 GHz could relax the sensitivity requirements for detecting faint primordial B-modes in future surveys.
- Extending the analysis to smaller angular scales would require higher-resolution simulations to check if the improvement factors persist.
Load-bearing premise
The simulated sky maps with power-law and curved synchrotron spectra accurately represent the statistical properties of real polarized Galactic emission at the relevant frequencies and angular scales.
What would settle it
Direct comparison of the forecasted bias and uncertainty reductions against parameter fits obtained from actual QUIJOTE-MFI2 observations combined with real WMAP and Planck maps.
Figures




read the original abstract
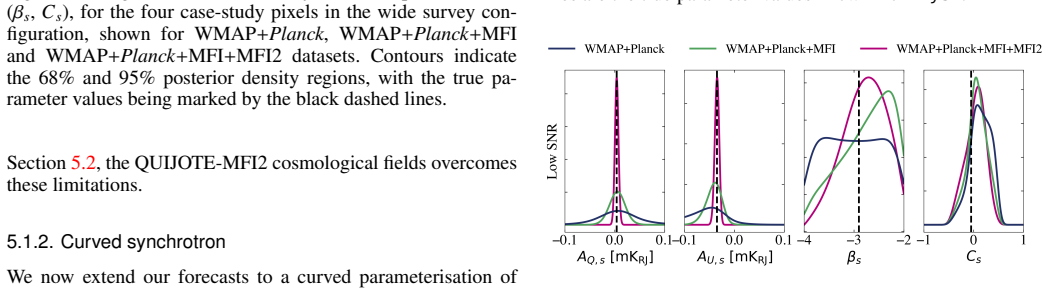
We present a parametric component separation forecast for the QUIJOTE-MFI2 instrument (10-20 GHz), assessing its impact on constraining polarised synchrotron emission at $1^\circ$ FWHM and $N_{\rm side}=64$. Using simulated sky maps based on power-law and curved synchrotron spectra, we show that adding QUIJOTE-MFI2 to existing WMAP+$Planck$+MFI data yields statistically unbiased parameter estimates with substantial uncertainty reductions: improvement factors reach $\sim$10 for the synchrotron spectral index ($\beta_s$), $\sim$5 for the curvature parameter ($C_s$), and $\sim$43 for polarisation amplitudes in bright regions. Deep QUIJOTE cosmological fields enable $\beta_s$ constraints even in intrinsically low SNR regions where WMAP+$Planck$ alone remain prior-dominated. Current combined sensitivities are insufficient to detect a synchrotron curvature of $C_s=-0.052$ on a pixel-by-pixel basis, but a $2\sigma$ detection is achievable for $|C_s|\gtrsim 0.14$ in the brightest regions of the Galactic plane. In those deep cosmological fields, combining QUIJOTE-MFI2 with WMAP and $Planck$ reduces the median synchrotron residual at 100 GHz by a factor of 6, to 0.033 $\mu$K$_{\rm CMB}$. These results demonstrate that QUIJOTE-MFI2 will provide critical low-frequency information for modelling Galactic synchrotron emission, offering valuable complementary constraints for future CMB surveys such as LiteBIRD and the Simons Observatory.
Editorial analysis
A structured set of objections, weighed in public.
Referee Report
Summary. The manuscript presents forecasts for parametric component separation of polarized synchrotron emission using the upcoming QUIJOTE-MFI2 instrument (10-20 GHz) at 1° FWHM and N_side=64, in combination with WMAP, Planck, and existing MFI data. Based on simulated sky maps that inject either pure power-law or curved synchrotron spectra, the authors report statistically unbiased recovery of parameters with uncertainty reduction factors of ~10 for the synchrotron spectral index β_s, ~5 for the curvature C_s, and ~43 for polarization amplitudes in bright regions. They further show that deep QUIJOTE fields allow β_s constraints in low-SNR regions, that a 2σ detection of |C_s| ≳ 0.14 is possible in the brightest Galactic plane areas, and that the median synchrotron residual at 100 GHz is reduced by a factor of 6 to 0.033 μK_CMB.
Significance. If the simulated skies faithfully capture the statistical properties of real polarized Galactic synchrotron at the relevant frequencies and scales, the quantitative forecasts provide actionable guidance for component-separation strategies in forthcoming CMB experiments such as LiteBIRD and the Simons Observatory. The work correctly uses independent simulated realizations rather than fits to the same data, avoiding circularity, and supplies concrete metrics (improvement factors, residual levels, and detection thresholds) that can inform observing strategy and data-analysis planning.
major comments (2)
- Simulation methodology (likely §3): The central claims of unbiased recovery and the quoted improvement factors (~10× on β_s, ~5× on C_s, ~43× on amplitudes) rest on the assumption that the injected power-law and curved synchrotron maps reproduce the actual spatial correlations, frequency-dependent variations, and polarization-fraction statistics of real Galactic emission at 10-20 GHz and N_side=64. The manuscript should include explicit validation (e.g., comparison of angular power spectra or polarization fractions against existing WMAP/Planck data) to confirm that mismatches do not inflate the reported uncertainty reductions or residual levels.
- Results on curvature detection (likely §4 or §5): The statement that current combined sensitivities are insufficient to detect C_s = -0.052 pixel-by-pixel but allow a 2σ detection for |C_s| ≳ 0.14 in bright regions is load-bearing for the scientific interpretation. The paper should clarify whether this threshold accounts for the full covariance between β_s and C_s or for spatial variations in the synchrotron spectrum across the map.
minor comments (2)
- Notation: Ensure consistent use of subscripts (β_s vs βs) and units throughout the text and figures.
- Figure clarity: The maps or histograms showing residual levels at 100 GHz should include the corresponding WMAP+Planck-only case for direct visual comparison.
Simulated Author's Rebuttal
We thank the referee for the careful and constructive review. The comments have prompted us to strengthen the validation and clarity of the simulation methodology and results. We respond to each major comment below and have revised the manuscript accordingly.
read point-by-point responses
-
Referee: [—] Simulation methodology (likely §3): The central claims of unbiased recovery and the quoted improvement factors (~10× on β_s, ~5× on C_s, and ~43× on amplitudes) rest on the assumption that the injected power-law and curved synchrotron maps reproduce the actual spatial correlations, frequency-dependent variations, and polarization-fraction statistics of real Galactic emission at 10-20 GHz and N_side=64. The manuscript should include explicit validation (e.g., comparison of angular power spectra or polarization fractions against existing WMAP/Planck data) to confirm that mismatches do not inflate the reported uncertainty reductions or residual levels.
Authors: We agree that explicit validation of the simulated skies is important for supporting the reported improvement factors. Section 3 of the original manuscript describes the use of PySM to generate the synchrotron maps from models calibrated to WMAP and Planck data. To address the referee's concern directly, the revised manuscript adds a new subsection 3.3 and Figure 3, which compare the EE and BB angular power spectra of the simulated polarized synchrotron maps at 23 GHz to WMAP observations and at 30 GHz to Planck observations. We also include a comparison of the polarization-fraction distributions. These checks confirm that the simulations reproduce the relevant spatial correlations, frequency scaling, and polarization statistics at N_side=64, indicating that the quoted uncertainty reductions are not inflated by mismatches with real data. revision: yes
-
Referee: [—] Results on curvature detection (likely §4 or §5): The statement that current combined sensitivities are insufficient to detect C_s = -0.052 pixel-by-pixel but allow a 2σ detection for |C_s| ≳ 0.14 in bright regions is load-bearing for the scientific interpretation. The paper should clarify whether this threshold accounts for the full covariance between β_s and C_s or for spatial variations in the synchrotron spectrum across the map.
Authors: The referee correctly notes that this clarification is needed. The 2σ detection threshold of |C_s| ≳ 0.14 is obtained from the full posterior distributions of our pixel-by-pixel MCMC fits, which simultaneously sample β_s, C_s, and the polarization amplitude; the reported significances therefore incorporate the full covariance between β_s and C_s. Because the analysis is performed independently per pixel, it also accounts for spatial variations in the synchrotron spectrum. We have revised the relevant paragraph in Section 5 to state this explicitly, including a short description of the covariance handling in the MCMC posteriors. revision: yes
Circularity Check
No circularity: forecasts computed from independent simulated skies
full rationale
The paper generates simulated maps by injecting explicit power-law or curved synchrotron spectra, then runs a component-separation pipeline on those maps to obtain posterior widths for βs, Cs and amplitudes under different instrument combinations. The reported improvement factors are direct numerical comparisons of those widths; no equation, fit or self-citation reduces any claimed result to a quantity already present in the same analysis. The derivation chain is therefore self-contained against the stated simulation assumptions and external to any fitted values inside the paper.
Axiom & Free-Parameter Ledger
free parameters (1)
- test curvature value C_s
axioms (2)
- domain assumption Polarized synchrotron emission can be described by power-law or mildly curved spectra between 10 and 20 GHz
- domain assumption Parametric component separation recovers unbiased parameter estimates when the foreground model matches the simulation
Lean theorems connected to this paper
-
IndisputableMonolith/Foundation/Cost/FunctionalEquation.leanwashburn_uniqueness_aczel unclear?
unclearRelation between the paper passage and the cited Recognition theorem.
Using simulated sky maps based on power-law and curved synchrotron spectra, we show that adding QUIJOTE-MFI2 to existing WMAP+Planck+MFI data yields statistically unbiased parameter estimates with substantial uncertainty reductions
What do these tags mean?
- matches
- The paper's claim is directly supported by a theorem in the formal canon.
- supports
- The theorem supports part of the paper's argument, but the paper may add assumptions or extra steps.
- extends
- The paper goes beyond the formal theorem; the theorem is a base layer rather than the whole result.
- uses
- The paper appears to rely on the theorem as machinery.
- contradicts
- The paper's claim conflicts with a theorem or certificate in the canon.
- unclear
- Pith found a possible connection, but the passage is too broad, indirect, or ambiguous to say the theorem truly supports the claim.
Forward citations
Cited by 1 Pith paper
-
Measuring the diffuse Galactic synchrotron spectral index and curvature between 45 and 2300 MHz
A new all-sky map of diffuse Galactic synchrotron spectral index and curvature between 45 and 2300 MHz is derived via least-squares fitting after free-free subtraction and shows ~20% average accuracy against held-out ...
Reference graph
Works this paper leans on
-
[1]
Adak, D., Rubiño-Martín, J. A., Génova-Santos, R. T., et al. 2025, arXiv e-prints, arXiv:2510.17761
-
[2]
Ade, P., Aguirre, J., Ahmed, Z., et al. 2019, J. Cosmology Astropart. Phys., 2019, 056
work page 2019
-
[3]
Armitage-Caplan, C., Dunkley, J., Eriksen, H. K., & Dickinson, C. 2012, MN- RAS, 424, 1914
work page 2012
- [4]
-
[5]
Bennett, C. L., Larson, D., Weiland, J. L., et al. 2013, ApJS, 208, 20
work page 2013
-
[6]
Bernardo, J. M. 1979, Journal of the Royal Statistical Society Series B: Statistical Methodology, 41, 113
work page 1979
-
[7]
Bernardo, J. M. & Smith, A. F. 2009, Bayesian theory, V ol. 405 (John Wiley & Sons)
work page 2009
-
[8]
Carretti, E., Haverkorn, M., Staveley-Smith, L., et al. 2019, MNRAS, 489, 2330
work page 2019
- [9]
-
[10]
Davies, R. D., Watson, R. A., & Gutierrez, C. M. 1996, MNRAS, 278, 925 de la Hoz, E., Mennella, A., Arnold, K., et al. 2025, arXiv e-prints, arXiv:2510.20793 de la Hoz, E., Barreiro, R. B., Vielva, P., et al. 2023, MNRAS, 519, 3504
-
[11]
CMB foregrounds - A brief review
Dickinson, C. 2016, arXiv e-prints, arXiv:1606.03606
work page internal anchor Pith review Pith/arXiv arXiv 2016
- [12]
- [13]
-
[14]
2009, in American Institute of Physics Conference Series, V ol
Dunkley, J., Amblard, A., Baccigalupi, C., et al. 2009, in American Institute of Physics Conference Series, V ol. 1141, CMB Polarization Workshop: Theory and Foregrounds: CMBPol Mission Concept Study, ed. S. Dodelson, D. Bau- mann, A. Cooray, J. Dunkley, A. Fraisse, M. G. Jackson, A. Kogut, L. Krauss, M. Zaldarriaga, & K. Smith (AIP), 222–264
work page 2009
-
[15]
Eriksen, H. K., Jewell, J. B., Dickinson, C., et al. 2008, ApJ, 676, 10 Fernández-Torreiro, M., Génova-Santos, R. T., Rubiño-Martín, J. A., et al. 2024, MNRAS, 527, 11945 Fernández-Torreiro, M., Rubiño-Martín, J. A., López-Caraballo, C. H., et al. 2023, MNRAS, 526, 1343
work page 2008
-
[16]
Fixsen, D. J. 2009, ApJ, 707, 916
work page 2009
-
[17]
Foreman-Mackey, D., Hogg, D. W., Lang, D., & Goodman, J. 2013, PASP, 125, 306
work page 2013
-
[18]
Fuskeland, U., Wehus, I. K., Eriksen, H. K., & Næss, S. K. 2014, ApJ, 790, 104 Génova-Santos, R., Rubiño-Martín, J. A., Peláez-Santos, A., et al. 2017, MN- RAS, 464, 4107
work page 2014
-
[19]
1992, Bayesian statistics, 4, 641 González-González, R., Génova-Santos, R
Geweke, J. 1992, Bayesian statistics, 4, 641 González-González, R., Génova-Santos, R. T., Rubiño-Martín, J. A., et al. 2025, A&A, 695, A245
work page 1992
-
[20]
Goodman, J. & Weare, J. 2010, Communications in Applied Mathematics and Computational Science, 5, 65 Górski, K. M., Hivon, E., Banday, A. J., et al. 2005, ApJ, 622, 759
work page 2010
-
[21]
E., Dickinson, C., Barr, A., et al
Harper, S. E., Dickinson, C., Barr, A., et al. 2022, MNRAS, 513, 5900
work page 2022
-
[22]
Hoyland, R. J., Rubiño-Martín, J. A., Aguiar-Gonzalez, M., et al. 2022, in So- ciety of Photo-Optical Instrumentation Engineers (SPIE) Conference Series, V ol. 12190, Millimeter, Submillimeter, and Far-Infrared Detectors and Instru- mentation for Astronomy XI, ed. J. Zmuidzinas & J.-R. Gao, 1219033
work page 2022
-
[23]
1946, Proceedings of the Royal Society of London Series A, 186, 453
Jeffreys, H. 1946, Proceedings of the Royal Society of London Series A, 186, 453
work page 1946
- [24]
- [25]
- [26]
- [27]
-
[28]
2018, A&A, 618, A166 LiteBIRD Collaboration, Allys, E., Arnold, K., et al
Krachmalnicoff, N., Carretti, E., Baccigalupi, C., et al. 2018, A&A, 618, A166 LiteBIRD Collaboration, Allys, E., Arnold, K., et al. 2023, Progress of Theoret- ical and Experimental Physics, 2023, 042F01
work page 2018
-
[29]
Longair, M. S. 2011, High Energy Astrophysics (Cambridge University Press) Article number, page 17 of 18 A&A proofs:manuscript no. aanda López-Caraballo, C. H., Rubiño-Martín, J. A., Rebolo, R., & Génova-Santos, R. 2011, ApJ, 729, 25
work page 2011
-
[30]
Macellari, N., Pierpaoli, E., Dickinson, C., & Vaillancourt, J. E. 2011, MNRAS, 418, 888
work page 2011
-
[31]
2024, in Society of Photo-Optical Instrumentation Engineers (SPIE) Conference Series, V ol
Mennella, A., Arnold, K., Azzoni, S., et al. 2024, in Society of Photo-Optical Instrumentation Engineers (SPIE) Conference Series, V ol. 13102, Millimeter, Submillimeter, and Far-Infrared Detectors and Instrumentation for Astron- omy XII, ed. J. Zmuidzinas & J.-R. Gao, 1310225 Planck Collaboration, Adam, R., Ade, P. A. R., et al. 2016, A&A, 594, A10 Planc...
work page 2024
-
[32]
Rybicki, G. B. & Lightman, A. P. 1986, Radiative Processes in Astrophysics
work page 1986
-
[33]
Thorne, B., Dunkley, J., Alonso, D., & Næss, S. 2017, MNRAS, 469, 2821
work page 2017
-
[34]
Vaillancourt, J. E. 2006, PASP, 118, 1340 Article number, page 18 of 18
work page 2006
discussion (0)
Sign in with ORCID, Apple, or X to comment. Anyone can read and Pith papers without signing in.