A Unified Spatiotemporal Framework for Modeling Censored and Missing Areal Responses
Pith reviewed 2026-05-17 19:55 UTC · model grok-4.3
The pith
A Bayesian spatiotemporal model unifies SAR and DAGAR structures with temporal autoregression to handle censored and missing areal responses.
A machine-rendered reading of the paper's core claim, the machinery that carries it, and where it could break.
Core claim
The proposed formulation extends both SAR and DAGAR spatial models into a unified spatiotemporal framework by combining them with a temporal autoregressive component and expressing the result as Gaussian Markov random fields in innovation form. This captures the joint spatiotemporal dependence structure for areal responses that may be censored or missing, outperforming ad hoc imputation in simulations and providing clearer interpretability in real data applications.
What carries the argument
The combined SAR/DAGAR spatial dependence with temporal AR random effect, formulated as a Gaussian Markov random field in innovation form.
Load-bearing premise
The combined SAR or DAGAR spatial model plus temporal AR random effect sufficiently represents the true joint spatiotemporal dependence in the presence of censoring and missing observations.
What would settle it
If in controlled simulations with known true spatiotemporal correlation structure the proposed model shows no improvement or worse predictive performance than simple imputation methods like LOD replacement, the advantage would be falsified.
Figures


read the original abstract
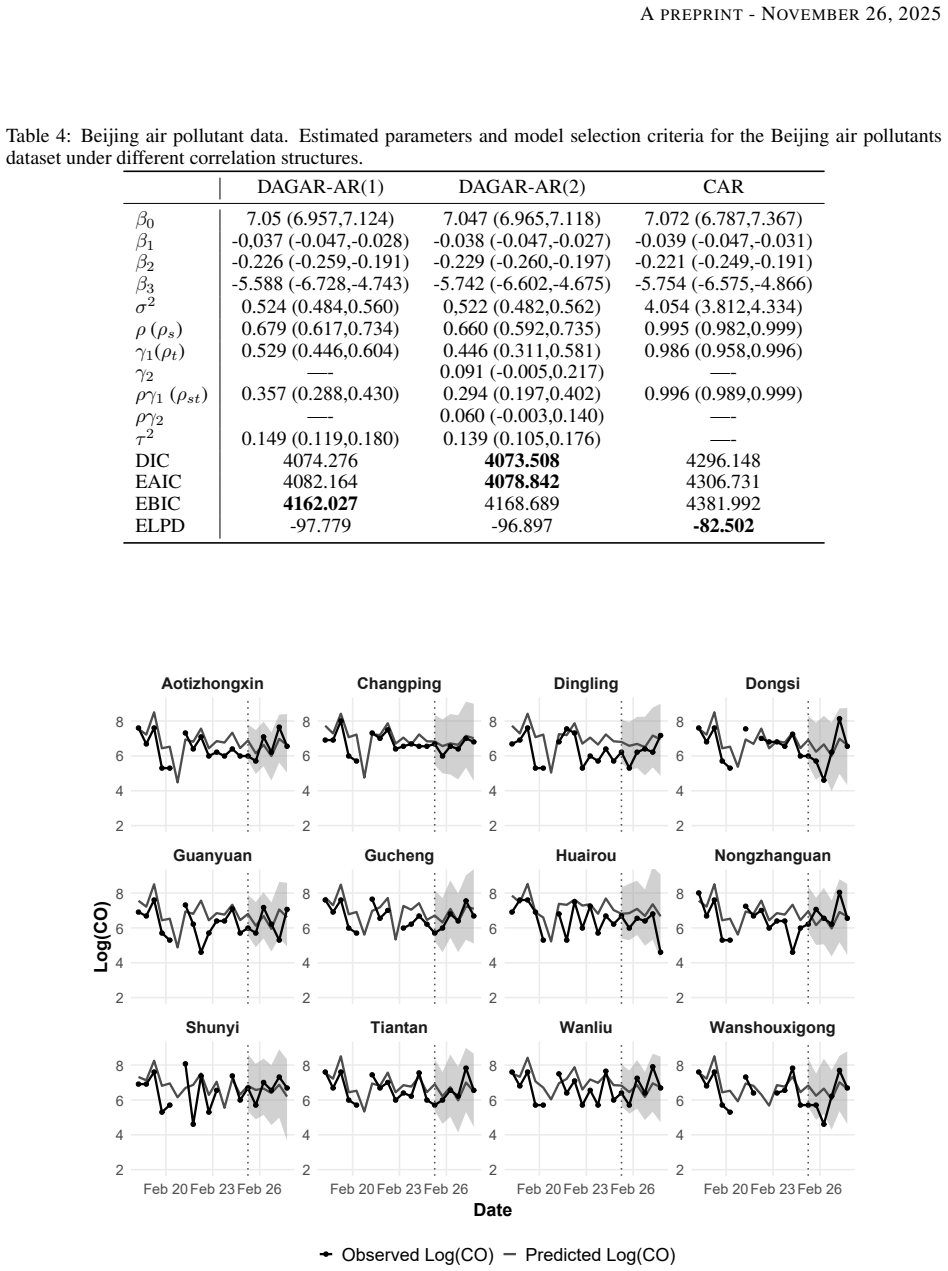
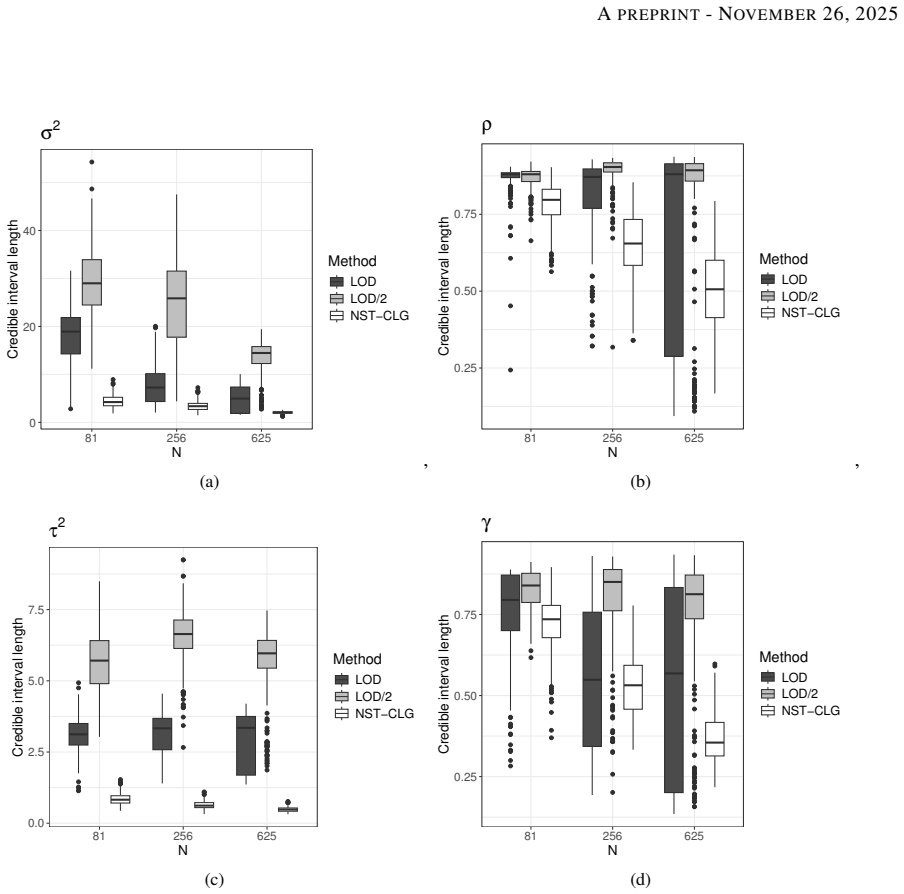
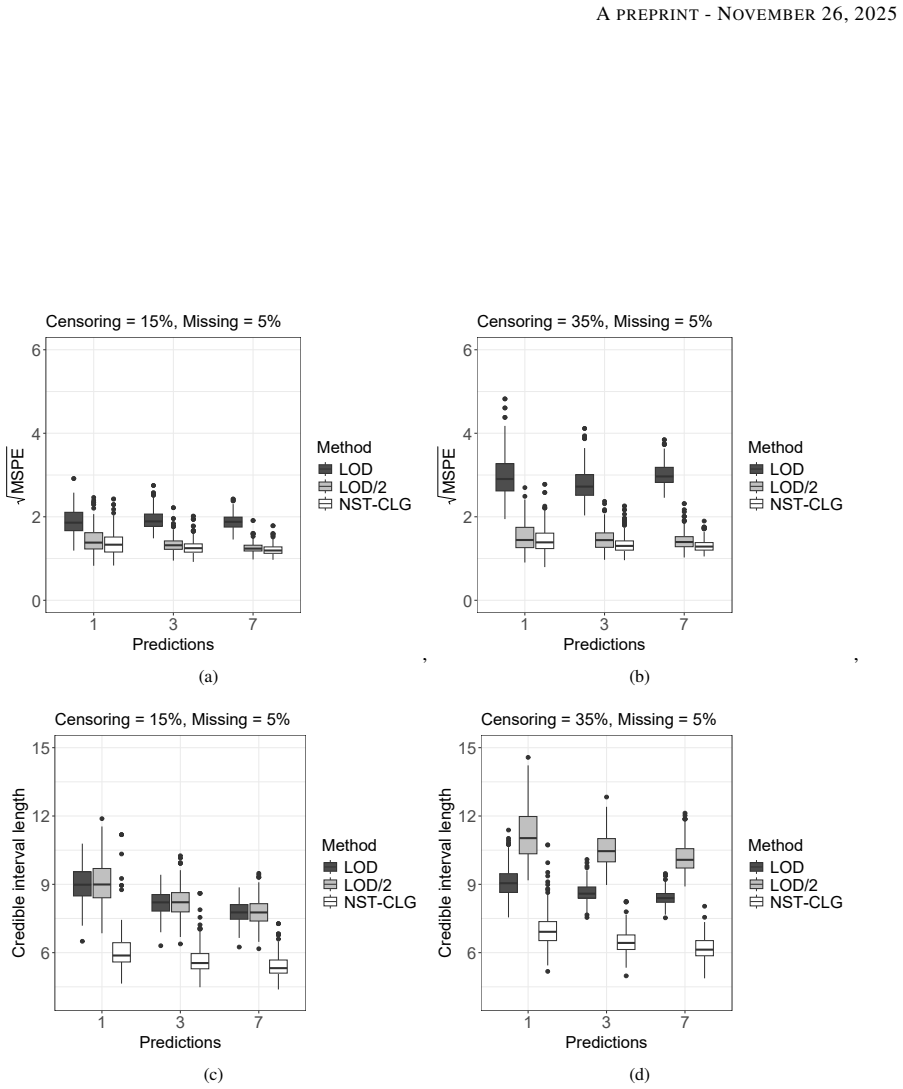
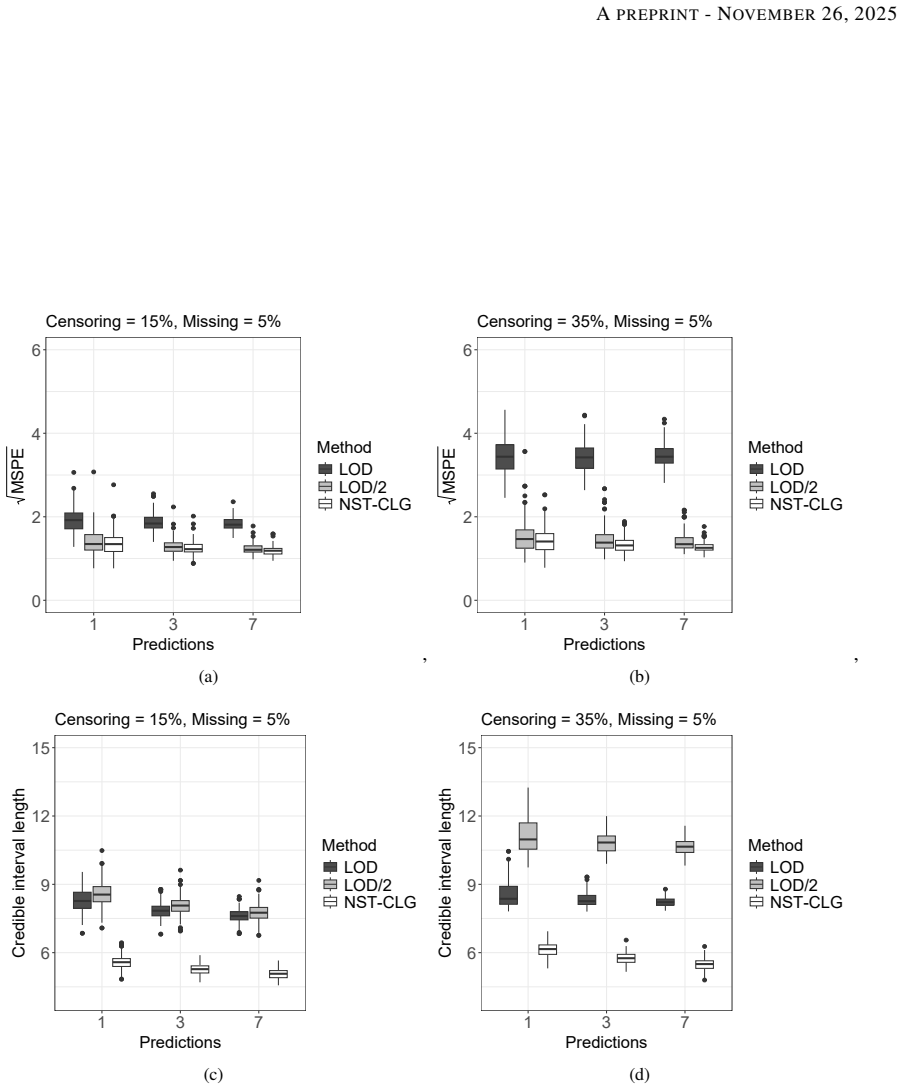
We propose a new Bayesian approach for spatiotemporal areal data with censored and missing observations. The method introduces a flexible random effect that combines the spatial dependence structures of the Simultaneous Autoregressive (SAR) and Directed Acyclic Graph Autoregressive (DAGAR) models with a temporal autoregressive component. We demonstrate that this formulation extends both spatial models into a unified spatiotemporal framework, expressing them as Gaussian Markov random fields in their innovation form. The resulting model captures spatial, temporal, and joint spatiotemporal correlations in an interpretable way. Simulation studies show that the proposed model outperforms common ad hoc imputation strategies, such as replacing censored values with the limit of detection (LOD) or imputing missing data by the sample mean. We further apply the method to carbon monoxide (CO) concentration data from Beijing's air quality network, comparing the proposed DAGAR-AR model with the traditional Conditional Autoregressive (CAR) approach. The results indicate that while the CAR model achieves slightly better predictive performance, the DAGAR-AR specification offers clearer interpretability and a more coherent representation of the spatiotemporal dependence structure.
Editorial analysis
A structured set of objections, weighed in public.
Referee Report
Summary. The manuscript introduces a Bayesian unified spatiotemporal framework for areal data subject to censoring and missing observations. By combining the spatial dependence from SAR and DAGAR models with a temporal autoregressive random effect, the approach is formulated as a Gaussian Markov random field in its innovation form. This allows for interpretable capture of spatial, temporal, and spatiotemporal correlations. Simulation studies are used to show that the model outperforms common ad hoc strategies like LOD replacement for censored values and mean imputation for missing data. The method is then applied to carbon monoxide concentration data from Beijing's air quality monitoring network, with comparisons to the traditional CAR model highlighting trade-offs between predictive accuracy and interpretability.
Significance. If the central claims regarding the unification and improved performance hold, this framework could provide a more coherent and statistically principled alternative to ad hoc imputation methods for handling incomplete spatiotemporal areal data. Such data are common in environmental science and public health, making the contribution potentially significant. The explicit representation as GMRFs in innovation form is a strength that facilitates understanding of the dependence structure. However, the real-data results showing comparable or slightly inferior predictive performance for the proposed model compared to CAR suggest that the practical advantages may be context-dependent.
major comments (2)
- [Simulation studies] The description of the simulation studies does not specify the exact data-generating process used to create the censored and missing observations. Given that the outperformance is claimed against ad hoc methods, it is critical to clarify whether the simulated data were generated from the proposed SAR/DAGAR-AR model or from an independent mechanism. If the former, the results may not adequately test the model robustness to departures from the assumed dependence structure, such as non-stationary spatial effects or additional noise components.
- [Methods] The handling of censoring in the likelihood is not detailed. Please specify the form of the contribution to the likelihood for censored observations (e.g., the integral or cumulative probability up to the limit of detection) and how it integrates with the GMRF precision matrix construction.
minor comments (2)
- [Abstract] The abstract would benefit from including specific quantitative results from the simulations, such as error metrics or improvement percentages, to better convey the performance gains.
- [Notation] The notation used for the innovation form of the GMRF should be introduced with an explicit equation to improve clarity for readers.
Simulated Author's Rebuttal
We thank the referee for their constructive comments and positive overall assessment of our manuscript. We address each major comment point by point below, indicating where revisions have been made to improve clarity and completeness.
read point-by-point responses
-
Referee: [Simulation studies] The description of the simulation studies does not specify the exact data-generating process used to create the censored and missing observations. Given that the outperformance is claimed against ad hoc methods, it is critical to clarify whether the simulated data were generated from the proposed SAR/DAGAR-AR model or from an independent mechanism. If the former, the results may not adequately test the model robustness to departures from the assumed dependence structure, such as non-stationary spatial effects or additional noise components.
Authors: We agree that the original manuscript lacked sufficient detail on the simulation design. The data were generated from the proposed SAR/DAGAR-AR spatiotemporal model (with known parameters for spatial and temporal dependence) and then subjected to independent censoring at a fixed LOD and random missingness. This setup was chosen to evaluate performance when the modeling assumptions hold. We acknowledge the referee's valid point regarding robustness testing. In the revised manuscript we have added an explicit description of the data-generating process (including parameter values and imposition of censoring/missingness) in Section 4, together with a short discussion of potential limitations under misspecification. We have not added entirely new simulation scenarios in this revision but note that the current results still demonstrate clear gains over ad-hoc methods under the stated conditions. revision: yes
-
Referee: [Methods] The handling of censoring in the likelihood is not detailed. Please specify the form of the contribution to the likelihood for censored observations (e.g., the integral or cumulative probability up to the limit of detection) and how it integrates with the GMRF precision matrix construction.
Authors: We thank the referee for highlighting this omission. In the revised manuscript we have expanded Section 3 to specify that, for an observation censored below the limit of detection c, the likelihood contribution is the integral of the conditional normal density from −∞ to c (equivalently the CDF evaluated at c after marginalizing over the latent GMRF). This term is combined with the joint precision matrix of the innovation-form GMRF by treating the censored values as partially observed latent variables; the precision matrix remains unchanged while the mean vector and the observed-data likelihood are adjusted accordingly. The revised text now includes the explicit integral expression, its reduction to the normal CDF under Gaussianity, and a brief description of how the construction is preserved within the GMRF framework. revision: yes
Circularity Check
No significant circularity in model derivation or validation
full rationale
The paper proposes a constructive Bayesian spatiotemporal model that unifies SAR and DAGAR spatial structures with a temporal AR(1) random effect, expressed as GMRFs in innovation form. This is presented as an extension rather than a reduction to prior inputs. Simulation studies compare the model against standard ad hoc imputation (LOD replacement, mean imputation), and the Beijing CO application uses external real-world data for evaluation. No equations reduce claimed performance or unification to fitted parameters by construction, and no load-bearing steps rely on self-citations or self-referential definitions. The derivation chain is self-contained with independent validation steps.
Axiom & Free-Parameter Ledger
axioms (1)
- domain assumption The observations arise from a latent Gaussian process with the specified SAR/DAGAR-temporal random effect.
Lean theorems connected to this paper
-
IndisputableMonolith/Foundation/AbsoluteFloorClosure.leanreality_from_one_distinction unclear?
unclearRelation between the paper passage and the cited Recognition theorem.
expressing them as Gaussian Markov random fields in their innovation form... ωtj = Bn ωtj + ϵtj (eq. 6); Theorem 3.1 Kronecker adjacency A = In ⊗ AT + AS ⊗ IT + AS ⊗ AT
-
IndisputableMonolith/Cost/FunctionalEquation.leanwashburn_uniqueness_aczel unclear?
unclearRelation between the paper passage and the cited Recognition theorem.
Simulation studies show that the proposed model outperforms common ad hoc imputation strategies
What do these tags mean?
- matches
- The paper's claim is directly supported by a theorem in the formal canon.
- supports
- The theorem supports part of the paper's argument, but the paper may add assumptions or extra steps.
- extends
- The paper goes beyond the formal theorem; the theorem is a base layer rather than the whole result.
- uses
- The paper appears to rely on the theorem as machinery.
- contradicts
- The paper's claim conflicts with a theorem or certificate in the canon.
- unclear
- Pith found a possible connection, but the passage is too broad, indirect, or ambiguous to say the theorem truly supports the claim.
Reference graph
Works this paper leans on
-
[1]
Clearing the air: a review of the effects of particulate matter air pollution on human health
Anderson, J., Thundiyil, J., and Stolbach, A. (2011). “Clearing the air: a review of the effects of particulate matter air pollution on human health.”Journal of Medical Toxicology, 2(8): 166–175. 1
work page 2011
-
[2]
Modeling massive spatial datasets using a conjugate Bayesian linear regression frame- work
Banerjee, S. (2021). “Modeling massive spatial datasets using a conjugate Bayesian linear regression frame- work.”Spatial Statistics, 41: 100498. URLhttps://arxiv.org/abs/2109.0444710
-
[3]
Banerjee, S., Gelfand, A. E., and Carlin, B. P. (2025).Hierarchical modeling and analysis for spatial data. Boca Raton: Chapman and Hall/CRC, 3 edition. URLhttps://doi.org/10.1201/97810034017285, 8
-
[4]
On the parametrization of autoregressive models by partial auto- correlations
Barndorff-Nielsen, O. and Schou, G. (1973). “On the parametrization of autoregressive models by partial auto- correlations.”Journal of Multivariate Analysis, 3(4): 408–419. 6
work page 1973
-
[5]
Objective Bayesian Analysis of Spatially Correlated Data
Berger, O., J., De Oliveira, V ., and Sans´o, B. (2001). “Objective Bayesian Analysis of Spatially Correlated Data.” Journal of the American Statistical Association, 96(456): 1361–1374. 8
work page 2001
-
[6]
Spatial interaction and statistical analysis of lattice systems
Besag, J. (1974). “Spatial interaction and statistical analysis of lattice systems.”Journal of the Royal Statistical Society, Series B, 36: 192–225. 2
work page 1974
-
[7]
Ambient carbon monoxide and daily mortality: a global time-series study in 337 cities
Chen, K., Breitner, S., Wolf, K., Stafoggia, M., Sera, F., Vicedo-Cabrera, A. M., Guo, Y ., Tong, S., Lavigne, E., Matus, P., Vald´es, N., Kan, H., Jaakkola, J. J. K., Ryti, N. R. I., Huber, V ., Scortichini, M., Hashizume, M., Honda, Y ., Nunes, B., Madureira, J., Holobˆac˘a, I. H., Fratianni, S., Kim, H., Lee, W., Tobias, A., ´I˜niguez, C., Forsberg, B....
work page 2021
-
[8]
Spatial disease mapping using directed acyclic graph auto-regressive (DAGAR) models
Datta, A., Banerjee, S., Hodges, J. S., and Gao, L. (2019). “Spatial disease mapping using directed acyclic graph auto-regressive (DAGAR) models.”Bayesian Analysis, 14(4): 1221 – 1244. 2, 8
work page 2019
-
[9]
Predictive spatio-temporal models for spatially sparse environmental data
de Luna, X. and Genton, M. G. (2005). “Predictive spatio-temporal models for spatially sparse environmental data.”Statistica Sinica, 15: 547–568. 2
work page 2005
-
[10]
Spatio-Temporal models with space-time Interaction and their applications to air pollution data
Deb, S. and Tsay, R. S. (2019). “Spatio-Temporal models with space-time Interaction and their applications to air pollution data.”Statistica Sinica, 29: 1181–1207. 2 16 APREPRINT- NOVEMBER26, 2025
work page 2019
-
[11]
Understanding predictive information criteria for Bayesian models
Gelman, A., Hwang, J., and Vehtari, A. (2014). “Understanding predictive information criteria for Bayesian models.”Statistics and Computing, 24(6): 997–1016. 16
work page 2014
-
[12]
Kim, Y ., Yi, S.-M., Heo, J., Kim, H., Lee, W., Kim, H., Hopke, P. K., Lee, Y . S., Shin, H.-J., Park, J., Yoo, M., Jeon, K., and Park, J. (2024). “Is replacing missing values of PM2.5 constituents with estimates using machine learning better for source apportionment than exclusion or median replacement?”Environmental Pollution, 354: 124165. 5
work page 2024
-
[13]
McMahon, K. and Launico, M. V . (2025). “Carbon monoxide toxicity.” InStatPearls. Treasure Island, FL: StatPearls Publishing. 1
work page 2025
-
[14]
Non-separable spatio-temporal models via transformed multivariate Gaussian Markov random fields
Prates, M. O., Azevedo, D. R. M., MacNab, Y . C., and Willig, M. R. (2022). “Non-separable spatio-temporal models via transformed multivariate Gaussian Markov random fields.”Journal of the Royal Statistical Society: Series C (Applied Statistics), 71(5). 14
work page 2022
-
[15]
Health effects of exposure to ambient carbon monoxide
Raub, J. (1999). “Health effects of exposure to ambient carbon monoxide.”Chemosphere: Global Change Science, (1): 331–351. 1
work page 1999
-
[16]
Spatial prediction in the presence of left-censoring
Schelin, L. and de Luna, S. S. (2014). “Spatial prediction in the presence of left-censoring.”Computational Statistics & Data Analysis, 74: 125–141. 10
work page 2014
-
[17]
Shmueli, G. (2010). “To explain or to predict?”Statistical Science, 25(3): 289–310. 16
work page 2010
-
[18]
Likelihood-based inference for spatiotemporal data with censored and missing responses
Valeriano, K. A. L., Lachos, V . H., Prates, M. O., and Matos, L. A. (2021). “Likelihood-based inference for spatiotemporal data with censored and missing responses.”Environmetrics, 32(3): e2663. 2
work page 2021
-
[19]
A close look at the spatial structure implied by the CAR and SAR models
Wall, M. M. (2004). “A close look at the spatial structure implied by the CAR and SAR models.”Journal of Statistical Planning and Inference, 121(2): 311–324. 8
work page 2004
-
[20]
Penalized local polynomial regression for spatial data
Wang, W. and Sun, Y . (2019). “Penalized local polynomial regression for spatial data.”Biometrics, 75(4): 1179–1190. 2
work page 2019
-
[21]
Estimation of missing air pollutant data using a spatiotemporal convolutional autoencoder
Wardana, I. N. K., Gardner, J. W., and Fahmy, S. A. (2022). “Estimation of missing air pollutant data using a spatiotemporal convolutional autoencoder.”Neural Computing and Applications, 34: 16129–16154. 3
work page 2022
-
[22]
On stationary process in the plane
Whittle, P. (1954). “On stationary process in the plane.”Biometrika, 41: 434–449. 2
work page 1954
-
[23]
Cautionary tales on air-quality improve- ment in Beijing
Zhang, S., Guo, B., Dong, A., He, J., Xu, Z., and Chen, S. X. (2017). “Cautionary tales on air-quality improve- ment in Beijing.”Proceedings of the Royal Society A: Mathematical, Physical and Engineering Sciences, 473. 2 9 Appendix 9.1 Proof of Proposition 3.1 Given the correlation matrix in equation (5) of the main manuscript, and a fixed positions i,ω s...
work page 2017
discussion (0)
Sign in with ORCID, Apple, or X to comment. Anyone can read and Pith papers without signing in.