An octree-based sampling algorithm for analyzing big simulation data
Pith reviewed 2026-05-25 07:40 UTC · model grok-4.3
The pith
The improved Sparse Spatial Sampling algorithm reduces CFD mesh cells by 35 to 95 percent while preserving dominant flow dynamics.
A machine-rendered reading of the paper's core claim, the machinery that carries it, and where it could break.
Core claim
The enhanced S^3 algorithm iteratively generates a time-invariant octree grid based on a user-defined metric, efficiently down-sampling the data while aiming to preserve as much of the metric as possible, which reduces mesh cells by 35 to 95 percent across tested cases and enables modal decomposition and similar tasks on local workstations.
What carries the argument
The time-invariant octree grid produced by iterative refinement according to a user-defined metric, which performs the down-sampling while targeting preservation of the metric values in the flow data.
If this is right
- Post-processing steps that previously demanded HPC resources become feasible on standard workstations for many CFD cases.
- Memory-intensive operations such as modal decomposition of flow snapshots can be applied to longer time series or larger domains.
- The same sampling procedure applies across different flow regimes, from transonic airfoil wakes to high-Reynolds aircraft flows.
Where Pith is reading between the lines
- The method could be tested on simulation types outside fluid dynamics if analogous user-defined metrics are supplied for other physical fields.
- Combining the octree sampling with existing data compression formats might yield further reductions without additional loss of dynamics.
- Because the grid is time-invariant, it supports consistent feature tracking across entire simulation runs where adaptive grids would vary.
Load-bearing premise
The user-defined metric used to build the octree grid is assumed to be sufficient for capturing and preserving the dominant flow dynamics required by downstream analysis tasks.
What would settle it
A side-by-side comparison of modal decomposition modes or other flow statistics computed on the original mesh versus the S^3-sampled mesh that reveals large discrepancies in the dominant structures would falsify the preservation claim.
Figures


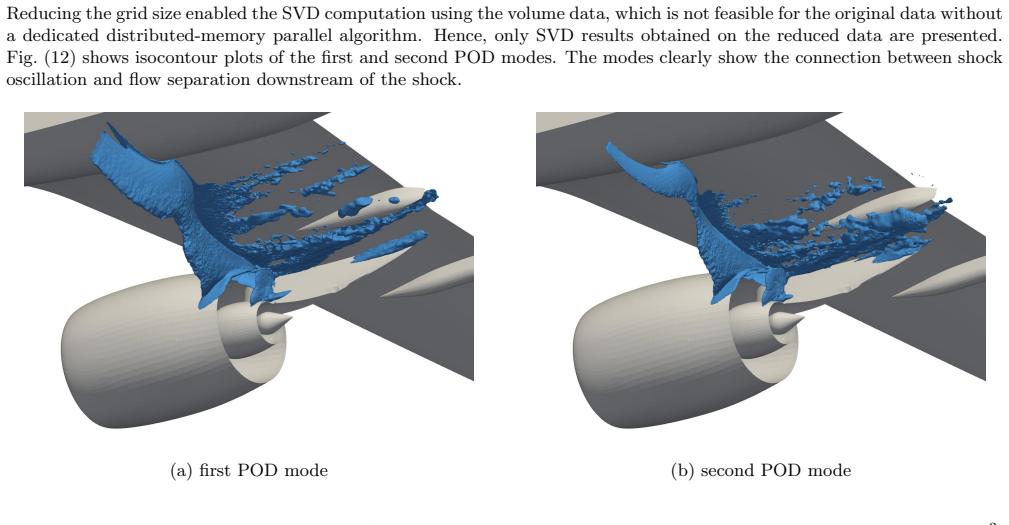


read the original abstract
As computational resources continue to increase, the storage and analysis of vast amounts of data will inevitably become a bottleneck in computational fluid dynamics (CFD) and related fields. Although compression algorithms and efficient data formats can mitigate this issue, they are often insufficient when post-processing large amounts of volume data. Processing such data may require additional high-performance software and resources, or it may restrict the analysis to shorter time series or smaller regions of interest. The present work proposes an improved version of the existing \emph{Sparse Spatial Sampling} algorithm ($S^3$) to reduce the data from time-dependent flow simulations. The $S^3$ algorithm iteratively generates a time-invariant octree grid based on a user-defined metric, efficiently down-sampling the data while aiming to preserve as much of the metric as possible. Using the sampled grid allows for more efficient post-processing and enables memory-intensive tasks, such as computing the modal decomposition of flow snapshots. The enhanced version of $S^3$ is tested and evaluated on the scale-resolving simulations of the flow past a tandem configuration of airfoils in the transonic regime, the incompressible turbulent flow past a circular cylinder, and the flow around an aircraft half-model at high Reynolds and Mach numbers. $S^3$ significantly reduces the number of mesh cells by $35 \%$ to $95\%$ for all test cases while accurately preserving the dominant flow dynamics, enabling post-processing of CFD data on a local workstation rather than HPC resources for many cases.
Editorial analysis
A structured set of objections, weighed in public.
Referee Report
Summary. The paper proposes an improved Sparse Spatial Sampling (S^3) algorithm that iteratively constructs a time-invariant octree grid from time-dependent CFD data using a user-defined metric. The method aims to down-sample the mesh while preserving the metric, thereby enabling efficient post-processing such as modal decomposition on large simulation datasets. It reports cell reductions of 35-95% on three test cases (transonic tandem airfoils, incompressible cylinder flow, and high-Re/Mach aircraft half-model) and claims accurate preservation of dominant flow dynamics, allowing analysis on local workstations rather than HPC resources.
Significance. If the preservation of dominant dynamics can be shown quantitatively, the octree-based S^3 approach would offer a practical tool for handling storage and analysis bottlenecks in large-scale CFD, extending the utility of existing sampling methods to memory-intensive tasks without requiring full-grid resources. The iterative, metric-driven construction on multiple realistic flow configurations is a positive aspect of the work.
major comments (2)
- [Abstract] Abstract: the central claim that S^3 'accurately preserv[es] the dominant flow dynamics' and enables unaffected modal decomposition is unsupported by any quantitative metrics (e.g., L2-norm difference between POD modes, relative modal energy error, or reconstruction error) comparing full-grid versus S^3-grid results on the three test cases. This is load-bearing because the 35-95% cell reduction is only useful if downstream tasks remain reliable.
- [Abstract / Methods description] The user-defined metric is presented as sufficient to capture dominant dynamics, yet no validation (such as sensitivity tests or comparison against known modal structures) is described to confirm this assumption holds for the reported test cases. Without such checks, the preservation assertion cannot be evaluated.
minor comments (1)
- [Abstract] The abstract refers to an 'improved version' of S^3 but does not specify the precise algorithmic changes relative to prior work; a brief comparison would clarify novelty.
Simulated Author's Rebuttal
We thank the referee for the detailed and constructive report. The comments correctly identify that stronger quantitative support is needed for the preservation claims. We address each point below and will revise the manuscript accordingly.
read point-by-point responses
-
Referee: [Abstract] Abstract: the central claim that S^3 'accurately preserv[es] the dominant flow dynamics' and enables unaffected modal decomposition is unsupported by any quantitative metrics (e.g., L2-norm difference between POD modes, relative modal energy error, or reconstruction error) comparing full-grid versus S^3-grid results on the three test cases. This is load-bearing because the 35-95% cell reduction is only useful if downstream tasks remain reliable.
Authors: We agree that the abstract claim requires quantitative backing to be fully substantiated. The manuscript presents visual comparisons of POD modes and flow structures between the full and sampled grids, but does not include explicit error norms. In the revised version we will add L2-norm differences between corresponding POD modes, relative modal energy errors, and reconstruction errors for all three test cases to provide the requested quantitative evidence. revision: yes
-
Referee: [Abstract / Methods description] The user-defined metric is presented as sufficient to capture dominant dynamics, yet no validation (such as sensitivity tests or comparison against known modal structures) is described to confirm this assumption holds for the reported test cases. Without such checks, the preservation assertion cannot be evaluated.
Authors: The metric is selected to target the dominant coherent structures of each flow (shock-induced pressure fluctuations for the airfoils, vorticity for the cylinder, and surface pressure for the aircraft). The three test cases provide case-specific demonstrations, yet we acknowledge the absence of dedicated sensitivity or benchmark comparisons. We will incorporate sensitivity tests on the metric threshold and, for the cylinder case, direct comparison against well-documented Strouhal-number and modal structures from the literature. revision: yes
Circularity Check
No circularity; algorithm empirically validated on independent test cases
full rationale
The paper describes an iterative octree construction driven by a user-defined metric and reports cell reductions on three distinct external CFD simulations (tandem airfoils, cylinder, aircraft half-model). No mathematical derivation, fitted parameter renamed as prediction, or self-citation chain is load-bearing for the central claim. The preservation assertion is presented as an empirical outcome rather than a definitional identity. This matches the default expectation of a non-circular algorithmic paper with external benchmarks.
Axiom & Free-Parameter Ledger
free parameters (1)
- user-defined metric
axioms (1)
- standard math An octree data structure can be constructed to represent 3D spatial fields at multiple resolutions
Lean theorems connected to this paper
-
IndisputableMonolith/Foundation/AlexanderDuality.leanalexander_duality_circle_linking unclear?
unclearRelation between the paper passage and the cited Recognition theorem.
The S3 algorithm iteratively generates a time-invariant octree grid based on a user-defined metric, efficiently down-sampling the data while aiming to preserve as much of the metric as possible.
-
IndisputableMonolith/Cost/FunctionalEquation.leanwashburn_uniqueness_aczel unclear?
unclearRelation between the paper passage and the cited Recognition theorem.
Gl = Vl+1/G0 * 2^D sum |cMl - cMl+1,j| ... stop if Mapprox = ||cM||/||M|| >= Mmin
What do these tags mean?
- matches
- The paper's claim is directly supported by a theorem in the formal canon.
- supports
- The theorem supports part of the paper's argument, but the paper may add assumptions or extra steps.
- extends
- The paper goes beyond the formal theorem; the theorem is a base layer rather than the whole result.
- uses
- The paper appears to rely on the theorem as machinery.
- contradicts
- The paper's claim conflicts with a theorem or certificate in the canon.
- unclear
- Pith found a possible connection, but the passage is too broad, indirect, or ambiguous to say the theorem truly supports the claim.
Reference graph
Works this paper leans on
-
[1]
Common flow problems for modal analysis implemented in OpenFOAM
Andre Weiner and Janis Geise. Common flow problems for modal analysis implemented in OpenFOAM . url: https://github.com/AndreWeiner/flow_data. 17
-
[2]
P. J. Baddoo, B. Herrmann, B. J. McKeon, and S. L. Brunton. “Kernel Learning for Robust Dynamic Mode Decomposition: Linear and Nonlinear Disambiguation Optimization (LANDO)”. In: Proceedings of the Royal Society A: Mathematical, Physical and Engineering Sciences 478.2260 (2022), p. 20210830. doi: 10.1098/ rspa.2021.0830
-
[3]
k-Nearest Neighbour Classifiers: 2nd Edition (with Python examples)
P. Cunningham and S. J. Delany. “k-Nearest Neighbour Classifiers: 2nd Edition (with Python examples)”. In: ACM Computing Surveys 54.6 (2022), pp. 1–25. doi: 10.1145/3459665
-
[4]
State of the Art and Future Trends in Data Reduction for High-Performance Computing
K. Duwe, J. L¨ uttgau, G. Mania, J. Squar, A. Fuchs, M. Kuhn, E. Betke, and T. Ludwig. “State of the Art and Future Trends in Data Reduction for High-Performance Computing”. In: Supercomputing Frontiers and Innovations 7.1 (2020). Number: 1, pp. 4–36. doi: 10.14529/jsfi200101
-
[5]
ESI Group. OpenFOAM version 2206. 2206. url: https://www.openfoam.com/news/main-news/openfoam- v2206
-
[6]
Sparse Spatial Sampling: A mesh sampling algorithm for efficient processing of big simulation data
D. Fernex, A. Weiner, B. Noack, and R. Semaan. “Sparse Spatial Sampling: A mesh sampling algorithm for efficient processing of big simulation data”. In: AIAA Scitech 2021 Forum . AIAA SciTech Forum. American Institute of Aeronautics and Astronautics, 2021. doi: 10.2514/6.2021-1484
-
[7]
J. Geise and A. Weiner. Git repository accompanying the article. 2024. url: https://github.com/JanisGeise/ sparseSpatialSampling
work page 2024
-
[8]
I. Goodfellow, Y. Bengio, and A. Courville. Deep Learning. MIT Press, 2016
work page 2016
-
[9]
B. N. Hanna, N. T. Dinh, R. W. Youngblood, and I. A. Bolotnov. “Machine-learning based error prediction approach for coarse-grid Computational Fluid Dynamics (CG-CFD)”. In: Progress in Nuclear Energy 118 (2020), p. 103140. doi: 10.1016/j.pnucene.2019.103140
-
[10]
Electricity 2024 - Analysis and forecast to 2026
International Energy Agency. Electricity 2024 - Analysis and forecast to 2026 . IEA. 2024
work page 2024
-
[11]
Data-driven correction of coarse grid CFD simulations
A. Kiener, S. Langer, and P. Bekemeyer. “Data-driven correction of coarse grid CFD simulations”. In: Com- puters & Fluids 264 (2023), p. 105971. doi: 10.1016/j.compfluid.2023.105971
-
[12]
Mesh reduction with error control
R. Klein, G. Liebich, and W. Strasser. “Mesh reduction with error control”. In: Proceedings of Seventh Annual IEEE Visualization ’96 . Proceedings of Seventh Annual IEEE Visualization ’96. 1996, pp. 311–318. doi: 10.1109/VISUAL.1996.568124
-
[13]
J. Kleinert, M. Ehrle, A. Waldmann, and T. Lutz. Wake Tail Plane Interactions for a Tandem Wing Config- uration in High-Speed Stall Conditions . 2023. doi: 10.1007/s13272-023-00670-1
-
[14]
J. Kleinert, J. Stober, and T. Lutz. “Numerical simulation of wake interactions on a tandem wing configuration in high-speed stall conditions”. In: CEAS Aeronautical Journal 14.1 (2023), pp. 171–186. doi: 10 . 1007 / s13272-022-00634-x
work page 2023
-
[15]
J. Lee, K. S. Jung, Q. Gong, X. Li, S. Klasky, J. Chen, A. Rangarajan, and S. Ranka. Machine Learning Techniques for Data Reduction of CFD Applications . 2024. doi: 10.48550/arXiv.2404.18063
-
[16]
Low-frequency unsteadiness in the vortex formation region of a circular cylinder
O. Lehmkuhl, I. Rodr´ ıguez, R. Borrell, and A. Oliva. “Low-frequency unsteadiness in the vortex formation region of a circular cylinder”. In: Physics of Fluids 25.8 (2013), p. 085109. doi: 10.1063/1.4818641
-
[17]
C. Lorsung and A. Barati Farimani. “Mesh deep Q network: A deep reinforcement learning framework for improving meshes in computational fluid dynamics”. In: AIP Advances 13.1 (2023), p. 015026. doi: 10.1063/ 5.0138039
work page 2023
-
[18]
Scikit-learn: Machine Learning in Python
F. Pedregosa, G. Varoquaux, A. Gramfort, V. Michel, B. Thirion, O. Grisel, M. Blondel, P. Prettenhofer, R. Weiss, V. Dubourg, J. Vanderplas, A. Passos, D. Cournapeau, M. Brucher, M. Perrot, E. Duchesnay, and G. Louppe. “Scikit-learn: Machine Learning in Python”. In: Journal of Machine Learning Research 12 (2012)
work page 2012
-
[19]
Self-Supervised Coarsening of Unstruc- tured Grid with Automatic Differentiation
S. Shumilin, A. Ryabov, N. Yavich, E. Burnaev, and V. Vanovskiy. “Self-Supervised Coarsening of Unstruc- tured Grid with Automatic Differentiation”. In: Forty-first International Conference on Machine Learning. 2024
work page 2024
-
[21]
doi: 10.2514/1.C038119
-
[22]
url: https://www.for2895.uni-stuttgart.de/
Unsteady flow and interaction phenomena at High Speed Stall conditions, research unit FOR 2895 . url: https://www.for2895.uni-stuttgart.de/. 18
-
[23]
flowTorch - a Python library for analysis and reduced-order modeling of fluid flows
A. Weiner and R. Semaan. “flowTorch - a Python library for analysis and reduced-order modeling of fluid flows”. In: Journal of Open Source Software 6.68 (2021), p. 3860. doi: 10.21105/joss.03860
-
[24]
Robust Dynamic Mode Decomposition Methodology for an Airfoil Undergoing Transonic Shock Buffet
A. Weiner and R. Semaan. “Robust Dynamic Mode Decomposition Methodology for an Airfoil Undergoing Transonic Shock Buffet”. In: AIAA Journal 61.10 (2023). Publisher: American Institute of Aeronautics and Astronautics, pp. 4456–4467. doi: 10.2514/1.J062546
-
[25]
A Tutorial on the Proper Orthogonal Decomposition
J. Weiss. “A Tutorial on the Proper Orthogonal Decomposition”. In: AIAA Aviation 2019 Forum . AIAA AVIATION Forum. American Institute of Aeronautics and Astronautics, 2019. doi: 10.2514/6.2019-3333
-
[26]
Note on a Method for Calculating Corrected Sums of Squares and Products
B. P. Welford. “Note on a Method for Calculating Corrected Sums of Squares and Products”. In:Technometrics 4.3 (1962). Publisher: ASA Website, pp. 419–420. doi: 10.1080/00401706.1962.10490022. 19 A Appendix A.1 Singular value decomposition This section summarizes the fundamentals of the singular value decomposition, which is used in section 3 to compare t...
discussion (0)
Sign in with ORCID, Apple, or X to comment. Anyone can read and Pith papers without signing in.