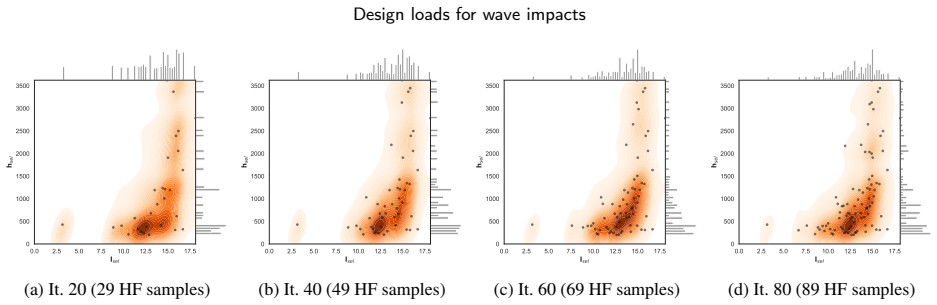
Design loads for wave impacts -- introducing the Probabilistic Adaptive Screening (PAS) method for predicting extreme non-linear loads on maritime structures
Pith reviewed 2026-05-17 04:24 UTC · model grok-4.3
The pith
The Probabilistic Adaptive Screening method predicts extreme wave impact loads on maritime structures by mapping cheap linear indicators to nonlinear results with 2-15% accuracy.
A machine-rendered reading of the paper's core claim, the machinery that carries it, and where it could break.
Core claim
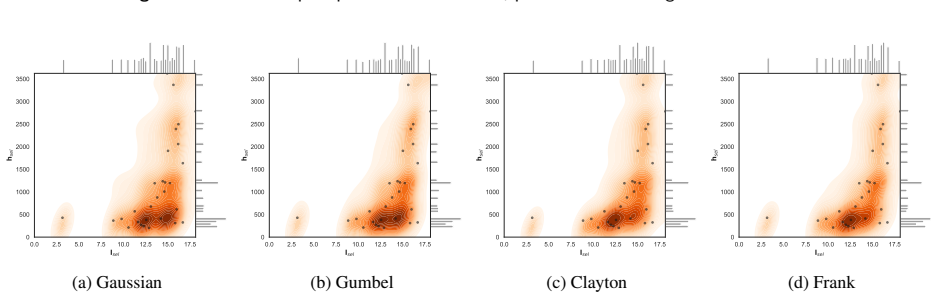
The Probabilistic Adaptive Screening (PAS) method integrates copula-based statistical dependence modelling with multi-fidelity screening and adaptive sampling to predict extreme non-linear wave impact loads. This framework enables efficient extreme value prediction by statistically mapping low-fidelity indicator variables to high-fidelity impact loads. The method allows efficient linear potential flow indicators to be used in the low-fidelity stage even for strongly non-linear cases. Validation against four non-linear test cases concludes that PAS with optimal settings accurately estimates both short-term distributions and extreme values, with most probable maximum values within 2-15% of the
What carries the argument
The Probabilistic Adaptive Screening (PAS) method, which uses copula-based statistical dependence modelling together with multi-fidelity screening and adaptive sampling to map low-fidelity linear potential flow indicators onto high-fidelity nonlinear impact loads.
If this is right
- Extreme load statistics for wave impacts can be obtained at roughly one to three percent of the computational cost of conventional Monte Carlo simulation.
- Linear potential flow indicators remain useful for screening even when the final loads are strongly nonlinear.
- Short-term distributions of impact loads are reproduced well enough to support design load selection.
- The same framework applies across weakly and strongly nonlinear regimes including non-linear waves, ship bending moments, green water, and slamming.
Where Pith is reading between the lines
- If the copula mapping generalizes to other vessel types and wave environments, the method could reduce the computational barrier to including realistic impact loads in classification society rules.
- The adaptive screening idea may transfer to other rare-event fluid-structure problems such as extreme run-up on coastal structures or fatigue from repeated slamming.
- Combining PAS with longer low-fidelity time series could further improve tail estimates without extra high-fidelity runs.
Load-bearing premise
That copula-based statistical dependence modelling can reliably map low-fidelity linear potential flow indicators to high-fidelity non-linear impact loads even for strongly non-linear phenomena.
What would settle it
Running the PAS procedure on an additional slamming or green-water case with a long brute-force Monte Carlo reference and finding that the predicted most probable maximum lies outside the 2-15% error band reported for the original test cases.
Figures


read the original abstract
Wave impact loads on maritime structures can cause casualties, damage, pollution and operational delays. Consequently, their extreme values should be accounted for in the design of these structures. However, this is challenging, as wave impact events are both rare and highly complex, requiring both high-fidelity simulations and long analysis durations to reliably quantify the associated design loads. Moreover, existing extreme value prediction methods are neither specifically developed nor adequately validated for wave impact phenomena. We therefore introduce the new Probabilistic Adaptive Screening (PAS) method for predicting extreme non-linear loads on maritime structures. The method integrates copula-based statistical dependence modelling with multi-fidelity screening and adaptive sampling. This framework enables efficient extreme value prediction by statistically mapping low-fidelity indicator variables to high-fidelity impact loads. The method allows for efficient linear potential flow indicators to be used in the low-fidelity stage, even for strongly non-linear cases. Its statistical framework is validated against four non-linear test cases, including non-linear waves, ship vertical bending moments, green water impact loads, and slamming loads. It is concluded that PAS with optimal settings accurately estimates both the short-term distributions and extreme values in these test cases, with most probable maximum (MPM) values within 2-15% of the reference brute-force Monte-Carlo Simulation (MCS) results. In addition, PAS achieves this performance very efficiently, requiring in the order of 1-3% of the high-fidelity simulation time needed for conventional MCS. These results demonstrate that PAS can reliably reproduce the statistics of both weakly and strongly non-linear extreme load problems, while significantly reducing the associated computational cost compared to MCS.
Editorial analysis
A structured set of objections, weighed in public.
Referee Report
Summary. The manuscript introduces the Probabilistic Adaptive Screening (PAS) method, which combines copula-based statistical dependence modelling, multi-fidelity screening, and adaptive sampling to predict extreme non-linear wave impact loads on maritime structures. Low-fidelity linear potential flow indicators are mapped to high-fidelity non-linear loads, with validation on four test cases (non-linear waves, ship vertical bending moments, green water impacts, and slamming loads) reporting most probable maximum (MPM) values within 2-15% of brute-force Monte Carlo simulation (MCS) results and computational cost reduced to 1-3% of conventional MCS.
Significance. If the accuracy holds, PAS would offer a practical route to incorporate rare extreme non-linear loads into maritime design at far lower cost than brute-force MCS, supporting safer assessment of slamming and green-water events. A notable strength is the use of independent brute-force MCS for validation rather than fitted parameters or self-referential checks, which reduces circularity and strengthens the empirical support for the efficiency claims.
major comments (1)
- [Abstract and validation on four test cases] The central claim for strongly non-linear phenomena rests on the copula accurately transferring tail statistics from low-fidelity indicators to high-fidelity loads. The validation reports 2-15% MPM agreement, but the manuscript should include explicit diagnostics (e.g., comparison of conditional quantiles or upper-tail dependence coefficients for thresholds above the 95th percentile of the indicator) to confirm that the fitted copula and its parameter estimation from screening samples preserve the required conditional extreme behavior; without this, bias in the adaptive sampling step cannot be ruled out for slamming and green-water cases.
minor comments (1)
- [Method description] Specify the exact copula families employed, the procedure for parameter estimation from the screening samples, and any sensitivity of results to copula choice to improve reproducibility.
Simulated Author's Rebuttal
We thank the referee for their constructive feedback and recommendation for major revision. We appreciate the recognition of the PAS method's potential and the emphasis on independent brute-force validation. We address the major comment below and will incorporate the suggested diagnostics in the revised manuscript.
read point-by-point responses
-
Referee: [Abstract and validation on four test cases] The central claim for strongly non-linear phenomena rests on the copula accurately transferring tail statistics from low-fidelity indicators to high-fidelity loads. The validation reports 2-15% MPM agreement, but the manuscript should include explicit diagnostics (e.g., comparison of conditional quantiles or upper-tail dependence coefficients for thresholds above the 95th percentile of the indicator) to confirm that the fitted copula and its parameter estimation from screening samples preserve the required conditional extreme behavior; without this, bias in the adaptive sampling step cannot be ruled out for slamming and green-water cases.
Authors: We thank the referee for highlighting this important point regarding tail behavior in strongly non-linear cases. While the reported agreement in most probable maximum (MPM) values within 2-15% and short-term distributions, validated against independent brute-force Monte Carlo simulations across all four test cases (including slamming and green water), provides empirical support for the copula mapping, we agree that explicit upper-tail diagnostics would further strengthen the validation and address potential concerns about bias in adaptive sampling. In the revised manuscript, we will add comparisons of conditional quantiles of the high-fidelity loads conditioned on low-fidelity indicators exceeding the 95th percentile, along with upper-tail dependence coefficients, with focused analysis on the slamming and green-water cases. These additions will confirm that the copula fitted from screening samples preserves the required conditional extreme statistics. revision: yes
Circularity Check
No circularity: PAS validated empirically against independent MCS references
full rationale
The paper introduces the PAS method as a combination of copula-based dependence modeling, multi-fidelity screening, and adaptive sampling to map low-fidelity linear indicators to high-fidelity nonlinear loads. All performance claims (short-term distributions, extreme values, and 2-15% MPM agreement) are presented as direct empirical comparisons to separate brute-force Monte Carlo Simulation results on four distinct test cases. No equations, parameters, or central premises reduce to self-definitions, fitted inputs renamed as predictions, or self-citation chains; the validation benchmarks are external and independent of the method's internal fitting process. This keeps the derivation self-contained without circular reduction.
Axiom & Free-Parameter Ledger
Reference graph
Works this paper leans on
-
[1]
R. P. Dallinga, G. Gaillarde, Hatch cover loads experienced by M.V. Derbyshire during typhoon ‘Orchid’, in: Glasgow Marine Fair And Int. Workshop On Safety Of Bulk Carriers, Glasgow, Scotland, UK, 2001
work page 2001
-
[2]
G. K. Kapsenberg, On the slamming of ships, PhD thesis, Delft University of Technology, Delft, The Netherlands (2018).doi:10.4233/ uuid:14eac2bb-63ee-47e4-8218-1ba3830a97b4
work page 2018
-
[3]
I. Pereira, Coast Guard probing deaths, injuries of Americans on vessels in Antarctic waters, ABC News (2023)
work page 2023
-
[4]
Reuters, Norwegian cruise ship MS Maud loses power in North Sea during storm, The Guardian (2023)
work page 2023
-
[5]
M.Halsne,O.N.,G.Ersdal,M.Langøy,T.Andersen,L.G.Bjørheim,SemisubmersibleinserviceexperiencesontheNorwegianContinental Shelf, in: 41th OMAE Conf., ASME, Hamburg, Germany, 2022.doi:10.1115/OMAE2022-81289
- [6]
-
[7]
327 (2025) 120991.doi:10.1016/j.oceaneng.2025.120991
N.Zhang,L.Xiao,Q.Zou,C.Cummins,Large-scalewavebasinexperimentalstudyonthespatio-temporaldistributionofwaveimpactloads on a semi-submersible platform, Ocean Eng. 327 (2025) 120991.doi:10.1016/j.oceaneng.2025.120991
-
[8]
I. Viste-Ollestad, T. L. Andersen, N. Oma, S. Zachariassen, Investigation report Petroleumstilsynet - Investigation of an accident with fatal consequences on COSLInnovator, 30 December 2015, Tech. rep. (2016)
work page 2015
-
[9]
NorwegianOceanIndustryAuthorityHavtil,Investigationofincidenton31January2024involvingacabinwindowonÅsgardAbeingforced in by green water, Tech. rep. (2025)
work page 2025
-
[10]
G. Cuomo, G. Lupoi, K. Shimosako, S. Takahashi, Dynamic response and sliding distance of composite breakwaters under breaking and non-breaking wave attack, Coastal Eng. 58 (2011) 953–969.doi:10.1016/j.coastaleng.2011.03.008
-
[11]
T. Zhou, Y. Yin, Z. Ma, J. Chen, G. Zhai, Numerical investigation of breaking waves impact on vertical breakwater with impermeable and porous foundation, Ocean Eng. 280 (2023) 114477.doi:10.1016/j.oceaneng.2023.114477
-
[12]
F. Han, W. Wang, X.-W. Zheng, X. Han, W. Shi, X. Li, Investigation of essential parameters for the design of offshore wind turbine based on structural reliability, Reliab. Eng. & System Safety 254 (2025) 110601.doi:10.1016/j.ress.2024.110601
-
[13]
G. Cuomo, K. ichiro Shimosako, S. Takahashi, Wave-in-deck loads on coastal bridges and the role of air, Coastal Eng. 56 (2009) 793–809. doi:10.1016/j.coastaleng.2009.01.005
-
[14]
D. Lucio, J. Lara, A. Tomas, I. Losada, Probabilistic assessment of climate-related impacts and risks in ports, Reliab. Eng. & System Safety 251 (2024) 110333.doi:10.1016/j.ress.2024.110333
-
[15]
A. Antonini, J. M. W. Brownjohn, D. Dassanayake, A. Raby, J. Bassit, A. Pappas, D. D’Ayala, A Bayesian inverse dynamic approach for impulsive wave loading reconstruction, Coastal Eng. 168 (2021) 103920.doi:10.1016/j.coastaleng.2021.103920
-
[16]
doi:10.1016/j.coastaleng.2023.104450
M.McCann,B.Ebrahimi,G.Cinar,W.Renteria,A.Stehno,P.Lynett,J.Kaihatu,FieldobservationsofHurricaneIan’swaveandsurgeimpact intheareasofFortMyersBeachandSanibelIsland,USA,CoastalEng.188(2024)104450. doi:10.1016/j.coastaleng.2023.104450
-
[17]
J.D.Hansom,A.D.Switzer,J.Pile,Extremewaves:causes,characteristics,andimpactoncoastalenvironmentsandsociety(Ch.11),in:J.F. Shroder, J. T. Ellis, D. J. Sherman (Eds.), Coastal and Marine Hazards, Risks, and Disasters, Hazards and Disasters Series, Elsevier, Boston, 2015, pp. 307–334.doi:10.1016/B978-0-12-396483-0.00011-X
-
[18]
S. M. van Essen, H. C. Seyffert, Designing for dangerous waves – a new ‘Adaptive Screening’ method to predict extreme values of non-linear marine and coastal structure responses to waves, Reliability Eng. & System Safety 264B (2025) 111404.doi:10.1016/j.ress.2025. 111404. van Essen, Seyffert:Preprint submitted to Elsevier Page 24 of 27 Design loads for wa...
-
[19]
H.Bandringa,J.A.Helder,S.M.vanEssen,OnthevalidityofCFDforsimulatingextremegreenwaterloadsonocean-goingvessels,in:39 th OMAE Conf., ASME, Virtual, Online, 2020.doi:10.1115/OMAE2020-18290
-
[20]
S. M. van Essen, H. C. Seyffert, Finding dangerous waves – Review of methods to obtain wave impact design loads for marine structures (OMAE-22-1110), J. Offshore Mechanics and Arctic Eng. 145 (6) (2023) 060801.doi:10.1115/1.4056888
-
[21]
DNV, Recommended Practice RP-C205: Environmental conditions and environmental loads, Det Norske Veritas, Oslo, Norway, 2019
work page 2019
-
[22]
DNV, Class Guideline DNV-CG-0130: Wave loads, Det Norske Veritas, Oslo, Norway, 2018
work page 2018
-
[23]
DNV, Offshore Technical Guidance DNV-OTG-14: Horizontal wave impact loads for column stabilised units, Det Norske Veritas, Oslo, Norway, 2019
work page 2019
-
[24]
BV, Rule Note NR583: Whipping and springing assessment, Bureau Veritas, Paris, France, 2015
work page 2015
-
[25]
BV, Rule Note NI638: Guidance for long-term hydro-structure calculations, Bureau Veritas, Paris, France, 2019
work page 2019
-
[26]
ABS, Guidance notes on air gap and wave impact analysis for semisubmersibles, American Bureau of Shipping, Spring, USA, 2020
work page 2020
-
[27]
ABS, Guide for slamming loads and strength assessment for vessels, American Bureau of Shipping, Spring, USA, 2021
work page 2021
-
[28]
ITTC, Recommended Practice 7.5-02-07-02.3: Experiments on rarely occurring events, International Towing Tank Conf., 2017
work page 2017
-
[29]
S. M. van Essen, H. C. Seyffert, Designing ships for extreme non-linear responses - the role of the acquisition function in the Adaptive Screening extreme value prediction method, in: 16th PRADS Conf., Ann Arbor, Michigan, USA, 2025.doi:10.5281/zenodo.17305196
-
[30]
S. M. van Essen, H. C. Seyffert, Scripts and data underlying the publication that defines and applies the new Adaptive Screen- ing method, for extreme value prediction of non-linear wave-induced responses, 4TU Repository. (2025). doi:10.4121/ f1348609-c912-4d06-82b8-197c01f3437b
work page 2025
-
[31]
(2025).doi:10.4121/12777259-c2f6-4b44-b71f-eec5557824d1
S.M.vanEssen,H.C.Seyffert,ScriptsanddataforPRADSpublicationthatvariestheacquisitionfunctionoftheAdaptiveScreeningmethod, 4TU Repository. (2025).doi:10.4121/12777259-c2f6-4b44-b71f-eec5557824d1
work page doi:10.4121/12777259-c2f6-4b44-b71f-eec5557824d1 2025
-
[32]
Y.-B. Xu, L.-L. Liu, Copula-based conditional reliability analysis of slopes in spatially variable soils, Reliability Eng. & System Safety 265 (2026) 111522. doi:10.1016/j.ress.2025.111522
-
[33]
T. Wang, C. Wang, Y. Zhou, H. Cui, J. Ji, Reliability updating of copula-dependent spatially variable soil slopes based on data-augmented mgpr model along slip surfaces, Engineering Geology 356 (2025) 108280.doi:10.1016/j.enggeo.2025.108280
-
[34]
X. Qiao, Q. Xie, G. Shi, J. Hu, Seismic reliability assessment for valve hall in converter station based on copula theory, Structures 77 (2025) 109002. doi:https://doi.org/10.1016/j.istruc.2025.109002
-
[35]
O. E. Bru-Cordero, C. Castro, V. Leiva, M. C. Jaramillo-Elorza, Confidence intervals for the reliability of dependent systems: integrating frailty models and copula-based methods, Computer Modeling in Eng. and Sciences 143 (2) (2025) 1401–1431.doi:10.32604/cmes. 2025.064487
-
[36]
& System Safety 265 (2026) 111469.doi:10.1016/j.ress.2025.111469
D.Zhang,J.Zhang,M.Yang,S.Bai,F.Wang,Reliability-baseddesignoptimizationmethodwithcorrelatedvariablesusingadaptiveconjugate gradient analysis and copula, Reliability Eng. & System Safety 265 (2026) 111469.doi:10.1016/j.ress.2025.111469
-
[37]
C. Lu, Y. Feng, C. Fei, D. Teng, Dimensional synchronous modeling-based enhanced kriging algorithm and adaptive copula method for multi-objectivesyntheticalreliabilityanalyses,ChineseJournalofAeronautics38(9)(2025)103652. doi:10.1016/j.cja.2025.103652
-
[38]
189 (2024) 104483.doi:10.1016/j.coastaleng.2024.104483
P.Mares-Nasarre,M.R.vanGent,O.Morales-Nápoles,Acopula-basedmodeltodescribetheuncertaintyofovertoppingvariablesonmound breakwaters, Coastal Eng. 189 (2024) 104483.doi:10.1016/j.coastaleng.2024.104483
-
[39]
P. Krupskii, H. Joe, Nonparametric estimation of multivariate tail probabilities and tail dependence coefficients, Journal of Multivariate Analysis 172 (2019) 147–161, dependence Models.doi:10.1016/j.jmva.2019.02.013
-
[40]
Gaussian copula-based Bayesian Networks for dynamic loads in mooring systems, Applied Ocean Research 165 (2025) 104809.doi: 10.1016/j.apor.2025.104809
-
[41]
Offshore Mechanics and Arctic Eng
E.Vanem,E.Fekhari,N.Dimitrov,M.Kelly,A.Cousin,M.Guiton,Ajointprobabilitydistributionformultivariatewind-waveconditionsand discussions on uncertainties (OMAE-23-1131), J. Offshore Mechanics and Arctic Eng. 146 (6) (2024) 061701.doi:10.1115/1.4064498
-
[42]
X. Duan, S. Wang, D. Liu, J. Shi, Y. Wu, X. Zhou, A statistical analysis method for significant wave height and spectral peak frequency considering the random and time-varying effects based on copula function and bayesian inference, Ocean Modelling 190 (2024) 102390. doi:10.1016/j.ocemod.2024.102390
-
[43]
C. Fang, Y.-L. Xu, Y. Li, J. Li, Serviceability analysis of sea-crossing bridges under correlated wind and wave loads, Reliab. Eng. & System Safety 246 (2024) 110077.doi:10.1016/j.ress.2024.110077
-
[44]
D. de Waal, P. van Gelder, Modelling of extreme wave heights and periods through copulas, Extremes 8 (2005) 345–356.doi:10.1007/ s10687-006-0006-y
work page 2005
-
[45]
N. Beck, C. Genest, J. Jalbert, M. Mailhot, Predicting extreme surges from sparse data using a copula-based hierarchical Bayesian spatial model, Environmetrics 31 (2020) e2616.doi:10.1002/env.2616
-
[46]
S.Ghosh,B.K.Mallick,AhierarchicalBayesianspatio-temporalmodelforextremeprecipitationevents,Environmetrics22(2010)192–204. doi:10.1002/env.1043
-
[47]
A. C. Davison, S. A. Padoan, M. Ribatet, Statistical modeling of spatial extremes, Statistical Science 27 (2) (2012) 161–186.doi: 10.1214/11-STS376
-
[48]
K. Wei, C. Zhou, B. Xu, Spatial distribution models of horizontal and vertical wave impact pressure on the elevated box structure, Applied Ocean Research 125 (2022) 103245.doi:10.1016/j.apor.2022.103245
-
[49]
F. Serinaldi, G. Cuomo, Characterizing impulsive wave-in-deck loads on coastal bridges by probabilistic models of impact maxima and rise times, Coastal Engineering 58 (9) (2011) 908–926.doi:10.1016/j.coastaleng.2011.05.010
-
[50]
O. Gaidai,G. Storhaug,A. Naess,Extreme large cargoship panelstresses bybivariate acer method,Ocean Engineering123 (2016)432–439. doi:10.1016/j.oceaneng.2016.06.048
-
[51]
J. Shen, H. Liu, On the structure dynamic response induced by the dam-break surge impact using multivariate copulas, Ocean Engineering 306 (2024) 118100.doi:10.1016/j.oceaneng.2024.118100. van Essen, Seyffert:Preprint submitted to Elsevier Page 25 of 27 Design loads for wave impacts
-
[52]
G. Cuomo, R. Piscopia, W. Allsop, Evaluation of wave impact loads on caisson breakwaters based on joint probability of impact maxima and rise times, Coastal Eng. 58 (1) (2011) 9–27.doi:10.1016/j.coastaleng.2010.08.003
-
[53]
Z.Yang,Y.Xu,L.Shi,C.Zhu,Y.Bao,Investigationofmethodsforthelocalizationandreconstructionofthewaveimpactonafloatingwind turbine pontoon, J. of Ocean Eng. and Science (2025).doi:10.1016/j.joes.2025.08.006
-
[54]
392 (2019) 385–402.doi:10.1016/j.jcp.2019.04.071
B.Kramer,A.N.Marques,B.Peherstorfer,U.Villa,K.Willcox,Multifidelityprobabilityestimationviafusionofestimators,J.Computational Phys. 392 (2019) 385–402.doi:10.1016/j.jcp.2019.04.071
-
[55]
B.Peherstorfer,T.Cui,Y.Marzouk,K.Willcox,Multifidelityimportancesampling,Comput.MethodsAppl.Mech.Eng.300(2016)490–509. doi:10.1016/j.cma.2015.12.002
-
[56]
Proppe, Reliability estimation with multi-fidelity simulation methods, in: M
C. Proppe, Reliability estimation with multi-fidelity simulation methods, in: M. Beer, E. Zio (Eds.), 29th ESREL Conf., Research Publishing, Singapore, 2019.doi:10.3850/978-981-11-2724-30168-cd
-
[57]
Q. Li, P. Ni, X. Du, Q. Han, Bayesian model updating with variational inference and gaussian copula model, Comput. Methods Appl. Mech. Eng. 438 (2025) 117842.doi:10.1016/j.cma.2025.117842
-
[58]
& System Safety 265 (2026) 111572.doi:10.1016/j.ress.2025.111572
P.Ma,Y.Zhang,E.Cai,M.Luo,J.Guo,T.Guo,Acopula-basedtransitionalmarkovchainmontecarlomethodforbayesianmodelupdating, Reliability Eng. & System Safety 265 (2026) 111572.doi:10.1016/j.ress.2025.111572
-
[59]
C.Bracken,K.Holman,B.Rajagopalan,H.Moradkhani,ABayesianhierarchicalapproachtomultivariatenonstationaryhydrologicfrequency analysis, Water Resources Research 54 (2018) 243–255.doi:10.1002/2017WR020403
-
[60]
S. M. van Essen, J. Scharnke, H. C. Seyffert, Required test durations for converged short-term wave and impact extreme value statistics - Part 1: ferry dataset, Marine Struc. 90 (2023) 103410.doi:10.1016/j.marstruc.2023.103410
-
[61]
J. Scharnke, S. M. van Essen, H. C. Seyffert, Required test durations for converged short-term wave and impact extreme value statistics - Part 2: deck box dataset, Marine Struc. 90 (2023) 103411.doi:10.1016/j.marstruc.2023.103411
-
[62]
R.Torhaug,S.R.Winterstein,A.Braathen,Nonlinearshiploads:stochasticmodelsforextremeresponse,J.ShipResearch42,1(1998)46–55. doi:10.5957/jsr.1998.42.1.46
-
[63]
J.S.Dietz,Applicationofconditionalwavesascriticalwaveepisodesforextremeloadsonmarinestructures,PhDthesis,TechnicalUniversity of Denmark, Lyngby, Denmark (2004)
work page 2004
-
[64]
M. K. Ochi, Applied Probability and Stochastic Processes in Engineering and Physical Sciences, John Wiley & Sons, Singapore, 1990
work page 1990
-
[65]
H.Bandringa,J.A.Helder,OnthevalidityandsensitivityofCFDsimulationsforadeterministicbreakingwaveimpactonasemisubsmersible, in: 37th OMAE Conf., ASME, Madrid, Spain, 2018.doi:10.1115/OMAE2018-78089
-
[66]
C.Pákozdi,A.Califano,A.Akselsen,E.Croonenborghs,J.Kim,M.Peric,S.Loubeyre,B.Bouscasse,G.Ducrozet,Xu-Haihua,Joint-industry effort to develop and verify CFD modeling practice for predicting wave impact, in: 41st OMAE Conf., ASME, Hamburg, Germany, 2022. doi:10.1115/OMAE2022-79152
-
[67]
S. M. van Essen, C. Monroy, Z. Shen, J. A. Helder, D.-H. Kim, S. Seng, Z. Ge, Screening wave conditions for the occurrence of green water events on sailing ships, Ocean Eng. 234 (2021) 109218.doi:10.1016/j.oceaneng.2021.109218
-
[68]
S. M. van Essen, H. C. Seyffert, Scripts and data underlying the paper that introduces and validates the Probabilistic Adaptive Screening method, 4TU Repository. (2025).doi:10.4121/be3e7819-dabf-4a21-bb29-5b76179ff696
work page doi:10.4121/be3e7819-dabf-4a21-bb29-5b76179ff696 2025
-
[69]
J. N. Sharma, R. G. Dean, Development and evaluation of a procedure for simulating a random directional second order sea surface and associated wave forces, Ocean Eng. Rep. 20 (1979)
work page 1979
-
[70]
S. M. van Essen, T. H. J. Bunnik, J. Scharnke, Statistical uncertainty of ship response to waves as a function of test duration, in: 43rd OMAE Conf., ASME, Singapore, 2024.doi:10.1115/OMAE2024-122486
-
[71]
T. H. J. Bunnik, C. T. Stansberg, C. Pákozdi, S. Fouques, L. Somers, Useful indicators for screening of sea states for wave impacts on fixed and floating platforms, in: 37th OMAE Conf., ASME, Madrid, Spain, 2018.doi:10.1115/OMAE2018-78544
-
[72]
T. H. J. Bunnik, J. Scharnke, E.-J. de Ridder, Efficient indicators for screening of random waves for wave impacts on a jacket platform and a fixed offshore wind turbine, in: 38th OMAE Conf., ASME, Glasgow, UK, 2019.doi:10.1115/OMAE2019-95481
-
[73]
S. M. van Essen, Influence of Wave Variability on Ship Response During Deterministically Repeated Seakeeping Tests at Forward Speed, in: Okada, T., Suzuki, K., Kawamura, Y. (Ed.), 14th PRADS Conf. 2019. Lecture Notes in Civil Engineering, vol 63, Springer, Singapore, Yokohama, Japan, 2021.doi:10.1007/978-981-15-4624-2_54
-
[74]
O. Gramstad, T. B. Johannessen, G. Lian, Long-term analysis of wave-induced loads using High Order Spectral Method and direct sampling of extreme wave events, Marine Struc. 103473 (2023).doi:10.1016/j.marstruc.2023.103473
-
[75]
John’s, Newfoundland, Canada, 2015.doi:10.1115/OMAE2015-41989
T.H.J.Bunnik,J.A.Helder,E.-J.deRidder,Deterministicsimulationofbreakingwaveimpactandflexibleresponseofafixedoffshorewind turbine, in: 34th OMAE Conf., ASME, St. John’s, Newfoundland, Canada, 2015.doi:10.1115/OMAE2015-41989
-
[76]
S. Guth, E. Katsidoniotaki, T. P. Sapsis, Statistical modeling of fully nonlinear hydrodynamic loads on offshore wind turbine monopile foundations using wave episodes and targeted CFD simulations through active sampling, Wind Energy 28 (2023) 1–26.doi:10.1002/ we.2880
work page 2023
-
[77]
T. B. Johannessen, Ø. Lande, Long term analysis of steep and breaking wave properties by event matching, in: 37th OMAE Conf., ASME, Madrid, Spain, 2018.doi:10.1115/OMAE2018-78283
-
[78]
S. R. Winterstein, T. C. Ude, C. A. Cornell, P. Bjerager, S. Haver, Environmental parameters for extreme response: inverse FORM with omission factors, in: Int. Conf. Struct. Saf. Reliab., Innsbruck, Austria, 1993
work page 1993
-
[79]
A. B. Huseby, E. Vanem, B. Natvig, A new approach to environmental contours for ocean engineering applications based on direct Monte Carlo simulations, Ocean Eng. 60 (2013) 124–135.doi:10.1016/j.oceaneng.2012.12.034
-
[80]
E. B. L. Mackay, C. Murphy-Barltrop, P. Jonathan, The SPAR model: a new paradigm for multivariate extremes: application to joint distributions of metocean variables (omae-24-1018), J. Offshore Mechanics and Arctic Eng. 147 (2025) 011205:1–10.doi:10.1115/1. 4065968
work page doi:10.1115/1 2025
discussion (0)
Sign in with ORCID, Apple, or X to comment. Anyone can read and Pith papers without signing in.