Buoyancy-dependent induced flow by vertically migrating swimmers
Pith reviewed 2026-05-16 22:58 UTC · model grok-4.3
The pith
Induced flows from vertically migrating shrimp swarms strengthen as buoyancy forcing increases with density difference.
A machine-rendered reading of the paper's core claim, the machinery that carries it, and where it could break.
Core claim
Induced velocity increased with buoyancy forcing and scaled with the parameter N(ρ_s - ρ), where N is the number of swimmers and ρ_s - ρ is the density difference between swimmers and the surrounding fluid (R² = 0.70, p = 5.9 × 10^{-5}). A multiple regression including swimmer number, swimming speed, fluid density, and the swarm Gaussian width confirmed that density remained a significant predictor of induced velocity after controlling for the other variables (p = 0.012, R² = 0.82). A simplified actuator-disk model captures the first-order dependence of induced velocity on buoyancy forcing and swimmer momentum.
What carries the argument
The scaling parameter N(ρ_s - ρ) that multiplies swimmer number by density difference to quantify total buoyancy forcing on the induced flow field.
If this is right
- Induced velocity scales with the product N(ρ_s - ρ) across the tested conditions.
- Fluid density remains a statistically significant predictor after accounting for swimmer number, speed, and group width.
- The actuator-disk model reproduces the leading dependence of induced velocity on buoyancy and momentum.
- Density variations in the environment can substantially modify the hydrodynamic effect of collective vertical migration.
Where Pith is reading between the lines
- The same buoyancy scaling may apply to other vertically migrating plankton that create density contrasts with seawater.
- Field measurements in natural salinity gradients could test whether the lab scaling persists outside controlled conditions.
- Climate-driven shifts in ocean stratification might therefore change the contribution of animal migrations to vertical mixing.
Load-bearing premise
That controlled salinity changes alter buoyancy forcing without also changing viscosity, temperature, or shrimp swimming behavior enough to alter the observed scaling.
What would settle it
A controlled test that varies density difference while holding swimmer number, speed, and swarm width fixed and finds no corresponding change in measured induced velocity.
Figures


read the original abstract
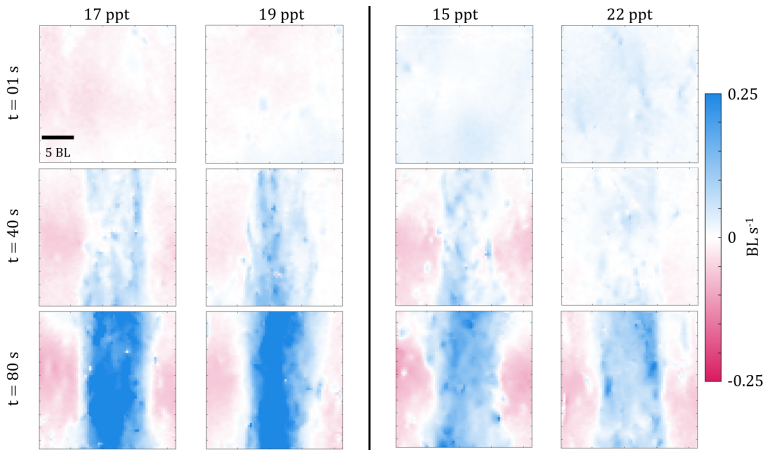
Collective vertical swimming may generate aggregate-scale flows that contribute to mixing and transport in stratified environments. The strength of these flows depends not only on swimmer behavior but also on environmental properties. Here we examine how fluid density affects flow generated by vertically migrating swarms of brine shrimp $\textit{Artemia salina}$. Using simultaneous three-dimensional swimmer tracking and particle image velocimetry, we measured swimmer kinematics and the induced flow field during phototactically driven migrations under four controlled salinity conditions. Induced velocity increased with buoyancy forcing and scaled with the parameter $N(\rho_s - \rho)$, where $N$ is the number of swimmers and $\rho_s - \rho$ is the density difference between swimmers and the surrounding fluid ($R^2 = 0.70$, $p = 5.9 \times 10^{-5}$). A multiple regression including swimmer number, swimming speed, fluid density, and the swarm Gaussian width confirmed that density remained a significant predictor of induced velocity after controlling for the other variables ($p = 0.012$, $R^2 = 0.82$). A simplified actuator-disk model captures the first-order dependence of induced velocity on buoyancy forcing and swimmer momentum, suggesting that environmentally driven density variations can substantially modify the hydrodynamic impact of collective vertical migration.
Editorial analysis
A structured set of objections, weighed in public.
Referee Report
Summary. The manuscript reports simultaneous 3D tracking and PIV measurements of phototactically driven vertical migrations of Artemia salina swarms under four controlled salinity conditions. It claims that the induced flow velocity increases with buoyancy forcing and scales with the composite parameter N(ρ_s - ρ) (R² = 0.70, p = 5.9 × 10^{-5}), with a multiple regression confirming fluid density as a significant predictor after controlling for swimmer number, speed, and swarm width (p = 0.012, R² = 0.82). A simplified actuator-disk model is presented as capturing the first-order trend.
Significance. If the reported scaling is robust, the work provides direct experimental evidence that fluid density modulates the aggregate-scale flows generated by collective vertical migration, with implications for mixing and transport in stratified environments. The simultaneous kinematics and flow measurements constitute a clear methodological strength, and the regression analysis offers quantitative support for buoyancy dependence within the tested range.
major comments (2)
- [Abstract and methods] Abstract and methods sections: The central scaling relation uses the buoyancy parameter N(ρ_s - ρ) and interprets the regression coefficient for density as isolating buoyancy forcing. No measurements or controls confirming that swimmer density ρ_s remains constant across the four salinity conditions are reported. Because Artemia salina osmoregulates and can adjust internal density or volume in response to salinity, ρ_s may covary with the controlled ρ, which would undermine the claim that the observed correlation isolates buoyancy effects rather than physiological or viscous confounders.
- [Results] Results section: The multiple regression reports density as significant (p = 0.012) after controlling for N, speed, and swarm width, but the manuscript does not provide the full regression table, variance inflation factors, or explicit checks for collinearity between fluid density and any unmeasured physiological response. This leaves open whether the density term truly captures buoyancy forcing independent of other salinity-dependent variables.
minor comments (1)
- [Abstract] Abstract: No uncertainties or error bars are reported on the individual velocity fields, regression slopes, or R² values, which would help assess the precision of the scaling claim.
Simulated Author's Rebuttal
We thank the referee for the detailed and constructive report. The comments highlight important considerations regarding swimmer density constancy and regression diagnostics. We address each point below and have revised the manuscript accordingly to improve clarity and robustness.
read point-by-point responses
-
Referee: [Abstract and methods] Abstract and methods sections: The central scaling relation uses the buoyancy parameter N(ρ_s - ρ) and interprets the regression coefficient for density as isolating buoyancy forcing. No measurements or controls confirming that swimmer density ρ_s remains constant across the four salinity conditions are reported. Because Artemia salina osmoregulates and can adjust internal density or volume in response to salinity, ρ_s may covary with the controlled ρ, which would undermine the claim that the observed correlation isolates buoyancy effects rather than physiological or viscous confounders.
Authors: We acknowledge that direct measurements of individual swimmer density ρ_s were not performed. Artemia salina are known to osmoregulate, but the experimental salinities were within the species' natural tolerance range and changes were introduced gradually over hours. Literature values indicate Artemia density remains relatively stable (approximately 1.05–1.08 g cm⁻³) under these conditions on short timescales. We have added a dedicated paragraph in the Methods section discussing osmoregulation, citing relevant physiological studies, and clarifying that ρ_s is taken from established literature values rather than measured per condition. We have also revised the abstract to state this assumption explicitly. While this does not constitute a direct control, the multiple regression controlling for kinematic variables supports the buoyancy interpretation. revision: partial
-
Referee: [Results] Results section: The multiple regression reports density as significant (p = 0.012) after controlling for N, speed, and swarm width, but the manuscript does not provide the full regression table, variance inflation factors, or explicit checks for collinearity between fluid density and any unmeasured physiological response. This leaves open whether the density term truly captures buoyancy forcing independent of other salinity-dependent variables.
Authors: We have added the complete multiple linear regression table (including coefficients, standard errors, t-statistics, and p-values) as Supplementary Table S1. Variance inflation factors were computed for all predictors (N, swimming speed, fluid density, swarm width); all VIFs are below 3.2, indicating no problematic multicollinearity. We have inserted a sentence in the Results section reporting these VIF values and noting that, while unmeasured salinity-dependent physiological effects cannot be fully excluded without additional experiments, the persistence of the density coefficient after controlling for the measured kinematic and geometric variables is consistent with a buoyancy-driven mechanism. No other salinity-dependent variable was included because fluid density is the direct proxy for the buoyancy term of interest. revision: yes
- Direct experimental measurements of swimmer density ρ_s under each salinity condition were not collected, so a definitive empirical confirmation of constancy is not available from the present dataset.
Circularity Check
No significant circularity in experimental scaling or model
full rationale
The paper reports direct experimental measurements of induced velocity from 3D tracking and PIV under four controlled salinity conditions. The scaling with N(ρ_s - ρ) is obtained via regression on measured quantities (R² = 0.70), and the multiple regression (R² = 0.82) treats density as an independent predictor after controlling for N, speed, and width. The actuator-disk model is introduced only as a simplified first-order description of the observed trend and does not redefine or derive the measured velocities from the same data by construction. No self-citations, fitted parameters renamed as predictions, or ansatzes imported via prior work appear in the load-bearing steps. The analysis is therefore self-contained against the external experimental benchmarks.
Axiom & Free-Parameter Ledger
free parameters (1)
- regression coefficients for density term
axioms (1)
- domain assumption Actuator-disk model provides a first-order description of swarm-induced flow
Lean theorems connected to this paper
-
IndisputableMonolith/Foundation/RealityFromDistinction.leanreality_from_one_distinction unclear?
unclearRelation between the paper passage and the cited Recognition theorem.
Induced velocity increased with buoyancy forcing and scaled with the parameter N(ρ_s - ρ) ... actuator disk model ... ΔW = -u_z/2 + sqrt(u_z²/4 + F_b/(2ρ A_D))
-
IndisputableMonolith/Cost/FunctionalEquation.leanwashburn_uniqueness_aczel unclear?
unclearRelation between the paper passage and the cited Recognition theorem.
Λ = ρ A_D u_z² / (2 N Δρ g V_s) ... buoyancy-dominated to momentum-dominated regimes
What do these tags mean?
- matches
- The paper's claim is directly supported by a theorem in the formal canon.
- supports
- The theorem supports part of the paper's argument, but the paper may add assumptions or extra steps.
- extends
- The paper goes beyond the formal theorem; the theorem is a base layer rather than the whole result.
- uses
- The paper appears to rely on the theorem as machinery.
- contradicts
- The paper's claim conflicts with a theorem or certificate in the canon.
- unclear
- Pith found a possible connection, but the passage is too broad, indirect, or ambiguous to say the theorem truly supports the claim.
Reference graph
Works this paper leans on
-
[1]
ISSN 0022-0949. doi: 10.1242/jeb.02633. URLhttps://doi.org/10.1242/jeb.02633. Boris Cisewski, V olker H. Strass, Monika Rhein, and S ¨oren Kr ¨agefsky. Seasonal variation of diel verti- cal migration of zooplankton from ADCP backscatter time series data in the Lazarev Sea, Antarctica. Deep Sea Research Part I: Oceanographic Research Papers, 57(1):78–94, J...
-
[2]
URLhttps://www.sciencedirect.com/science/ article/pii/S0967063709001976
doi: 10.1016/j.dsr.2009.10.005. URLhttps://www.sciencedirect.com/science/ article/pii/S0967063709001976. Boris Cisewski, Hj ´almar H ´at´un, Inga Kristiansen, Bogi Hansen, Karin Margretha H. Larsen, S´olv´a K ´arad´ottir Eliasen, and Jan Arge Jacobsen. Vertical Migration of Pelagic and Mesopelagic Scatterers From ADCP Backscatter Data in the Southern Norw...
-
[3]
doi: 10.1038/s41586-018-0044-z
ISSN 1476-4687. doi: 10.1038/s41586-018-0044-z. URLhttps://www.nature.com/ articles/s41586-018-0044-z. Number: 7702 Publisher: Nature Publishing Group. Kakani Katija. Biogenic inputs to ocean mixing.The Journal of Experimental Biology, 215(Pt 6):1040– 1049, March 2012. ISSN 1477-9145. doi: 10.1242/jeb.059279. Kakani Katija and John O. Dabiri. A viscosity-...
-
[4]
doi: 10.1214/aoms/1177730256. URLhttps://projecteuclid.org/ journals/annals-of-mathematical-statistics/volume-19/issue-2/ Table-for-Estimating-the-Goodness-of-Fit-of-Empirical-Distributions/ 10.1214/aoms/1177730256.full. Publisher: Institute of Mathematical Statistics. H. U. Sverdrup, Martin W. Johnson, and Richard H. Fleming.The Oceans Their Physics, Che...
discussion (0)
Sign in with ORCID, Apple, or X to comment. Anyone can read and Pith papers without signing in.