Quantifying displacement: an urban expansion consequence via persistent homology
Pith reviewed 2026-05-16 23:16 UTC · model grok-4.3
The pith
Persistent homology on cubical complexes from address changes quantifies urban displacement and flags affected neighbourhoods and years.
A machine-rendered reading of the paper's core claim, the machinery that carries it, and where it could break.
Core claim
Constructing four cubical complexes that simultaneously encode geographical and temporal information from address changes, then analysing them with persistent homology, captures displacement as an involuntary residential process and identifies the neighbourhoods and years affected in the Madrid case, patterns that raw address data alone do not display.
What carries the argument
Four cubical complexes built from address change records that incorporate spatial and temporal dimensions, analysed by persistent homology to detect topological features associated with displacement.
If this is right
- Displacement can be tracked as a gradual process over multi-decade periods using only publicly available address records.
- The method isolates specific neighbourhoods and calendar years experiencing elevated displacement in the Madrid study.
- Topological features expose movement patterns that direct inspection of address change counts does not reveal.
- The same construction of cubical complexes and homology analysis can be repeated on address data from other cities and time windows.
- Quantification becomes possible without requiring new data collection beyond existing public records.
Where Pith is reading between the lines
- The same pipeline could be run on address data from additional cities to compare how different housing regulations affect displacement rates.
- Detected persistent features might be checked against concurrent rent or property-value data to test links between market pressures and observed movement.
- Periodic re-application to fresh address updates could serve as an early-warning system for emerging displacement zones.
- The approach may generalise to other slow social shifts such as community turnover or service-access changes when suitable longitudinal location data exist.
Load-bearing premise
Address change records accurately stand in for involuntary displacement and the persistent topological features specifically signal displacement rather than other kinds of moves.
What would settle it
If the neighbourhoods and years highlighted by the persistent homology analysis do not align with those identified by independent local surveys or census data on forced residential moves.
Figures


read the original abstract
Population displacement is a housing-related involuntary residential dislocation. It has become increasingly widespread in many cities, particularly in neighbourhoods undergoing rapid economic and demographic change, and measuring it is essential to assess the social consequences of urban transformation and housing market pressures. Despite its relevance, quantifying displacement presents difficulties due to limited replicability across cities and time periods and the need to analyse long time spans: displacement is a gradual process, impossible to capture in one data snapshot. We introduce a novel tool to overcome these difficulties. Using publicly available address change data, we construct four cubical complexes simultaneously incorporating geographical and temporal information of people moving, and analyse using Topological Data Analysis tools. Finally, we demonstrate this method through a 20-year case study in Madrid, Spain. The results reveal its ability to capture displacement and identify the neighbourhoods and years affected--patterns not observable from raw address change data.
Editorial analysis
A structured set of objections, weighed in public.
Referee Report
Summary. The paper proposes a method to quantify population displacement using persistent homology applied to four cubical complexes built from publicly available address-change records that encode both geographic and temporal movement information. It presents a 20-year case study on Madrid data and claims that the resulting 0- and 1-dimensional persistent features identify affected neighbourhoods and years in patterns invisible from raw address counts.
Significance. If the topological features can be shown to isolate involuntary displacement rather than general mobility, the approach would supply a replicable, data-driven framework for tracking gradual urban displacement over long time spans using only public records. The simultaneous incorporation of space and time in cubical complexes and the emphasis on publicly available inputs are positive features for reproducibility.
major comments (3)
- [Methods] Methods section on complex construction: the description of how address-change records are mapped into the four cubical complexes and the choice of filtration parameters (grid resolution, time binning, and persistence thresholds) is insufficiently detailed. These choices directly determine the persistent homology output and are therefore load-bearing for the claim that the detected features capture displacement.
- [Results] Results and case-study sections: the central interpretation that persistent 0- and 1-dimensional features specifically flag involuntary displacement (rather than voluntary moves or administrative noise) is asserted without any external validation step, such as correlation with Madrid eviction records, known gentrification timelines, or survey-based displacement measures for 2000–2020. This leaves the claim that TDA reveals “patterns not observable from raw address change data” unsupported.
- [Results] Results section: no quantitative comparison (e.g., precision-recall against ground-truth displacement events or statistical tests against null models of random mobility) is provided to demonstrate that the topological summary outperforms simple density counts. This weakens the assertion of added value.
minor comments (2)
- [Abstract] Abstract: the four cubical complexes are mentioned without stating what distinguishes them (e.g., different filtrations or projections); a brief clarifying clause would improve readability.
- [Methods] Notation: the manuscript uses “cubical complexes” and “persistent homology” without referencing standard definitions or software (e.g., Cubical Ripser or Gudhi); adding one or two citations would aid readers.
Simulated Author's Rebuttal
We thank the referee for their thoughtful and constructive comments on our manuscript. We have addressed each of the major comments point by point below, making revisions to the manuscript where appropriate to improve clarity and support for our claims.
read point-by-point responses
-
Referee: [Methods] Methods section on complex construction: the description of how address-change records are mapped into the four cubical complexes and the choice of filtration parameters (grid resolution, time binning, and persistence thresholds) is insufficiently detailed. These choices directly determine the persistent homology output and are therefore load-bearing for the claim that the detected features capture displacement.
Authors: We agree with the referee that additional details are necessary for reproducibility. In the revised version, we have substantially expanded the Methods section. We now provide a detailed description of the mapping process from address-change records to the four cubical complexes, including the specific spatial grid resolution of 200m x 200m, temporal binning into yearly intervals, and the filtration parameters used, such as the maximum filtration value and persistence thresholds for considering features as significant. We have also included a figure illustrating the construction pipeline and pseudocode for the complex building algorithm. revision: yes
-
Referee: [Results] Results and case-study sections: the central interpretation that persistent 0- and 1-dimensional features specifically flag involuntary displacement (rather than voluntary moves or administrative noise) is asserted without any external validation step, such as correlation with Madrid eviction records, known gentrification timelines, or survey-based displacement measures for 2000–2020. This leaves the claim that TDA reveals “patterns not observable from raw address change data” unsupported.
Authors: We acknowledge that external validation would provide stronger evidence. Unfortunately, comprehensive public records of involuntary displacements (e.g., evictions) for the entire 2000-2020 period in Madrid are not available at the neighborhood level, which motivated our use of an unsupervised topological approach. We have revised the manuscript to include a dedicated limitations subsection discussing this issue and have softened the language around the interpretation to indicate that the features highlight anomalous mobility patterns consistent with displacement, while noting the need for future validation with additional data sources. We have also added comparisons to known gentrification timelines from literature where available. revision: partial
-
Referee: [Results] Results section: no quantitative comparison (e.g., precision-recall against ground-truth displacement events or statistical tests against null models of random mobility) is provided to demonstrate that the topological summary outperforms simple density counts. This weakens the assertion of added value.
Authors: We have added quantitative comparisons in the revised Results section. Specifically, we generated null models by randomizing the mobility data while preserving marginal distributions and computed persistence diagrams for these. Statistical tests (e.g., Wasserstein distance between diagrams) show significant differences (p-value < 0.05) from the observed data. Additionally, we provide a side-by-side visual and quantitative comparison showing that persistent features identify specific neighborhoods and years not apparent from raw address change counts alone. While we do not have labeled ground-truth for precision-recall metrics, these additions demonstrate the added value of the topological approach. revision: yes
Circularity Check
Standard TDA pipeline on data-derived complexes; no self-referential reduction
full rationale
The paper constructs four cubical complexes directly from address-change records (geographic-temporal data) and applies persistent homology, a standard, parameter-free computational procedure whose output features are not defined in terms of the target displacement interpretation. No equations reduce a claimed prediction to a fitted input by construction, no self-citations bear the central load, and no ansatz or uniqueness theorem is smuggled in. The interpretive step that persistent features indicate involuntary displacement is an external modeling assumption, not a circular derivation within the mathematics itself.
Axiom & Free-Parameter Ledger
axioms (1)
- domain assumption Persistent homology on cubical complexes built from spatio-temporal data yields features that correspond to displacement processes.
Lean theorems connected to this paper
-
IndisputableMonolith/Foundation/AlexanderDuality.leanalexander_duality_circle_linking unclear?
unclearRelation between the paper passage and the cited Recognition theorem.
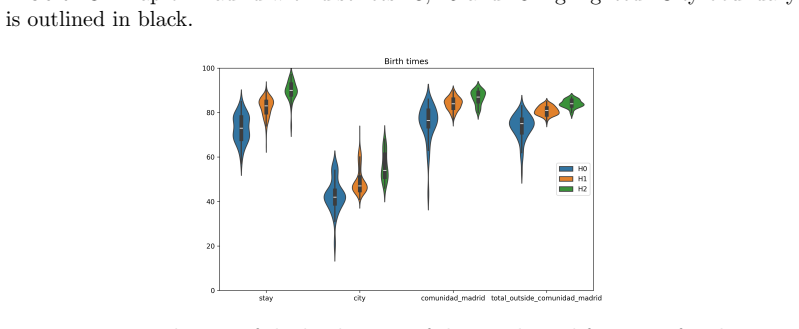
We construct four 3-dimensional cubical complexes ... using the T-construction ... compute persistent homology ... H0, H1, H2 features
-
IndisputableMonolith/Cost/FunctionalEquation.leanwashburn_uniqueness_aczel unclear?
unclearRelation between the paper passage and the cited Recognition theorem.
Using only publicly available address change data ... four groups ... stay / city / C. Madrid / outside
What do these tags mean?
- matches
- The paper's claim is directly supported by a theorem in the formal canon.
- supports
- The theorem supports part of the paper's argument, but the paper may add assumptions or extra steps.
- extends
- The paper goes beyond the formal theorem; the theorem is a base layer rather than the whole result.
- uses
- The paper appears to rely on the theorem as machinery.
- contradicts
- The paper's claim conflicts with a theorem or certificate in the canon.
- unclear
- Pith found a possible connection, but the passage is too broad, indirect, or ambiguous to say the theorem truly supports the claim.
Reference graph
Works this paper leans on
-
[1]
Erik J Am´ ezquita, Michelle Y Quigley, Tim Ophelders, Jacob B Landis, Daniel Koenig, Elizabeth Munch, and Daniel H Chitwood. “Measuring hidden phenotype: quantifying the shape of barley seeds using the Euler characteristic transform”. In:in silico Plants4.1 (Dec. 2021), diab033.issn: 2517-5025.doi:10.1093/insilicoplants/diab033. eprint:https:// academic....
-
[2]
Ayuntamiento de Madrid.Acuerdo del Pleno, de 31 de mayo de 2017, por el que se aprueba la creaci´ on del Barrio denominado “Ensanche de Vallecas” en el distrito de Villa de Vallecas y la modificaci´ on del Reglamento Org´ anico de los Distritos de la Ciudad de Madrid. 140. Oct. 2017, pp. 156–162.url:https://www.bocm.es/boletin/CM_Orden_BOCM/2017/06/14/BOC...
work page 2017
-
[3]
Casco Hist´ orico de Vic´ alvaro
Ayuntamiento de Madrid.Acuerdo del Pleno, de 31 de octubre de 2017, por el que se aprueba la creaci´ on de los barrios “Casco Hist´ orico de Vic´ alvaro”, “Valdebernardo”, “Valderrivas” y “El Ca˜ naveral” y la delimitaci´ on territorial interna actualizada del Distrito de Vic´ alvaro, as´ ı como el cambio de denominaci´ on del “Barrio de San Andr´ es” por...
work page 2017
-
[4]
[Available at Banco de Datos del Ayuntamiento de Madrid; downloaded April-2025]
Ayuntamiento de Madrid.Banco de Datos del Ayuntamiento de Madrid. [Available at Banco de Datos del Ayuntamiento de Madrid; downloaded April-2025]. 2025.url:https://servpub. madrid.es/CSEBD_WBINTER/inicio.html
work page 2025
-
[5]
[Available at Geoportal del Ayuntamiento de Madrid; downloaded April-2025]
Ayuntamiento de Madrid.Geoportal del Ayuntamiento de Madrid. [Available at Geoportal del Ayuntamiento de Madrid; downloaded April-2025]. 2025.url:https://geoportal.madrid. es/IDEAM_WBGEOPORTAL/index.iam
work page 2025
-
[6]
Ayuntamiento de Madrid.Mapa de ruido 2006. Distrito 18 Villa de Vallecas. 2006.url: https://www.madrid.es/UnidadesDescentralizadas/Sostenibilidad/Ruido/MapaRuido/ MapaRuido2006/Ficheros/Distrito_18_Villa_de_Vallecas.pdf
work page 2006
-
[7]
Ayuntamiento de Madrid.Mapa de ruido 2006. Distrito 19 Vic´ alvaro. 2006.url:https : / / www . madrid . es / UnidadesDescentralizadas / Sostenibilidad / Ruido / MapaRuido / MapaRuido2006/Ficheros/Distrito_19_Vicalvaro.pdf
work page 2006
-
[8]
Towards patterns-based Linguis- tic Web Service composition
Nabil Baklouti, Bilel Gargouri, and Mohamed Jmaiel. “Towards patterns-based Linguis- tic Web Service composition”. In:Computer Systems and Applications (AICCSA), 2015 IEEE/ACS 12th International Conference of. IEEE. 2015, pp. 1–6
work page 2015
-
[9]
Using manifold stucture for partially labeled classifica- tion
Mikhail Belkin and Partha Niyogi. “Using manifold stucture for partially labeled classifica- tion”. In:Advances in neural information processing systems. 2002, pp. 929–936
work page 2002
-
[10]
Friendship Ties and Geographical Mobility: Evidence from Great Britain
Mich` ele Belot and John Ermisch. “Friendship Ties and Geographical Mobility: Evidence from Great Britain”. In:Journal of the Royal Statistical Society. Series A (Statistics in Society) 172.2 (2009), pp. 427–442.issn: 09641998, 1467985X.url:http://www.jstor.org/stable/ 20622506(visited on 12/09/2025)
work page 2009
-
[11]
Embedding Riemannian manifolds by their heat kernel
Pierre B´ erard, G´ erard Besson, and Sylvain Gallot. “Embedding Riemannian manifolds by their heat kernel”. In:Geometric & Functional Analysis GAFA4.4 (1994), pp. 373–398
work page 1994
-
[13]
The persistent homology of dual digital image constructions
Bea Bleile, Ad´ elie Garin, Teresa Heiss, Kelly Maggs, and Vanessa Robins. “The persistent homology of dual digital image constructions”. In:Research in computational topology 2. Vol. 30. Assoc. Women Math. Ser. Springer, Cham, [2022]©2022, pp. 1–26.isbn: 978-3- 030-95518-2; 978-3-030-95519-9.doi:10 . 1007 / 978 - 3 - 030 - 95519 - 9 \ _1.url:https : //do...
-
[14]
Gunnar Carlsson. “Topology and data”. In:Bull. Amer. Math. Soc. (N.S.)46.2 (2009), pp. 255–308.issn: 0273-0979.doi:10 . 1090 / S0273 - 0979 - 09 - 01249 - X.url:https : //doi.org/10.1090/S0273-0979-09-01249-X
-
[15]
Maria Chiara Cavalleri, Nhung Luu, and Orsetta Causa. “Migration, housing and regional disparities: A gravity model of inter-regional migration with an application to selected OECD countries”. In:OECD Economics Department Working Papers1691 (2021).doi:10.1787/ 421bf4aa-en. 13
work page 2021
-
[16]
Cubical Homology-Based Machine Learning: An Ap- plication in Image Classification
Seungho Choe and Sheela Ramanna. “Cubical Homology-Based Machine Learning: An Ap- plication in Image Classification”. In:Axioms11.3 (2022).issn: 2075-1680.doi:10.3390/ axioms11030112.url:https://www.mdpi.com/2075-1680/11/3/112
work page 2022
-
[17]
Ronald R Coifman, Stephane Lafon, Ann B Lee, Mauro Maggioni, Boaz Nadler, Frederick Warner, and Steven W Zucker. “Geometric diffusions as a tool for harmonic analysis and structure definition of data: Diffusion maps”. In:Proceedings of the National Academy of Sciences of the United States of America102.21 (2005), pp. 7426–7431
work page 2005
-
[18]
Who gets evicted? Assessing individual, neigh- borhood, and network factors
Matthew Desmond and Carl Gershenson. “Who gets evicted? Assessing individual, neigh- borhood, and network factors”. In:Social Science Research62 (2017), pp. 362–377.issn: 0049-089X.doi:https://doi.org/10.1016/j.ssresearch.2016.08.017.url:https: //www.sciencedirect.com/science/article/pii/S0049089X16300977
work page doi:10.1016/j.ssresearch.2016.08.017.url:https: 2017
-
[19]
Forced Displacement From Rental Housing: Prevalence and Neighborhood Consequences
Matthew Desmond and Tracey Shollenberger. “Forced Displacement From Rental Housing: Prevalence and Neighborhood Consequences”. In:Demography52 (Aug. 2015).doi:10.1007/ s13524-015-0419-9
work page 2015
-
[20]
Gentrification and residential mobility in Philadelphia
Lei Ding, Jackelyn Hwang, and Eileen Divringi. “Gentrification and residential mobility in Philadelphia”. In:Regional Science and Urban Economics61 (2016), pp. 38–51.issn: 0166- 0462.doi:https : / / doi . org / 10 . 1016 / j . regsciurbeco . 2016 . 09 . 004.url:https : //www.sciencedirect.com/science/article/pii/S0166046216301223
work page 2016
-
[21]
NIAS Market Generated Displacement. “A Single City Case Study”. In:National Institute for Advanced Studies: Washington, DC, USA(1981)
work page 1981
-
[22]
Moon Duchin, Tom Needham, and Thomas Weighill.The (homological) persistence of ger- rymandering. 2022.doi:10.3934/fods.2021007.url:https://www.aimsciences.org/ article/id/dd6624ea-7c57-4817-ac33-170a3acd9abe
work page doi:10.3934/fods.2021007.url:https://www.aimsciences.org/ 2022
-
[23]
Gentrification and Fair Housing: Does Gentri- fication Further Integration?
Ingrid Ellen and Gerard Torrats-Espinosa. “Gentrification and Fair Housing: Does Gentri- fication Further Integration?” In:Housing Policy Debate29 (Dec. 2018), pp. 1–17.doi: 10.1080/10511482.2018.1524440
-
[24]
How low income neighborhoods change: En- try, exit, and enhancement
Ingrid Gould Ellen and Katherine M. O’Regan. “How low income neighborhoods change: En- try, exit, and enhancement”. In:Regional Science and Urban Economics41.2 (2011), pp. 89– 97.issn: 0166-0462.doi:https://doi.org/10.1016/j.regsciurbeco.2010.12.005.url: https://www.sciencedirect.com/science/article/pii/S0166046211000044
-
[25]
Displacement or Succession?: Residential Mobility in Gentrifying Neighbor- hoods
Lance Freeman. “Displacement or Succession?: Residential Mobility in Gentrifying Neighbor- hoods”. In:Urban Affairs Review40.4 (2005), pp. 463–491.doi:10.1177/1078087404273341. eprint:https://doi.org/10.1177/1078087404273341.url:https://doi.org/10.1177/ 1078087404273341
-
[26]
Racial Segregation Through Persistent Homology
Ori Friesen and Lori Ziegelmeier.Understanding U.S. Racial Segregation Through Persistent Homology. 2024. arXiv:2410.10886 [cs.SI].url:https://arxiv.org/abs/2410.10886
-
[27]
Barcodes: the persistent topology of data
Robert Ghrist. “Barcodes: the persistent topology of data”. In:Bull. Amer. Math. Soc. (N.S.) 45.1 (2008), pp. 61–75.issn: 0273-0979.doi:10 . 1090 / S0273 - 0979 - 07 - 01191 - 3.url: https://doi.org/10.1090/S0273-0979-07-01191-3
-
[28]
Glass.London: Aspects of Change
R.L. Glass.London: Aspects of Change. Report. MacGibbon & Kee, 1964.url:https:// books.google.es/books?id=JfqftgEACAAJ
work page 1964
-
[29]
Cambridge University Press, Cambridge, 2002, pp
Allen Hatcher.Algebraic topology. Cambridge University Press, Cambridge, 2002, pp. xii+544. isbn: 0-521-79160-X; 0-521-79540-0
work page 2002
-
[30]
Per- sistent Homology for Resource Coverage: A Case Study of Access to Polling Sites
Abigail Hickok, Benjamin Jarman, Michael Johnson, Jiajie Luo, and Mason A. Porter. “Per- sistent Homology for Resource Coverage: A Case Study of Access to Polling Sites”. In:SIAM Review66.3 (2024), pp. 481–500.doi:10.1137/22M150410X. eprint:https://doi.org/10. 1137/22M150410X.url:https://doi.org/10.1137/22M150410X. 14
-
[31]
Tomasz Kaczynski, Konstantin Mischaikow, and Marian Mrozek.Computational homology. Vol. 157. Applied Mathematical Sciences. Springer-Verlag, New York, 2004, pp. xviii+480. isbn: 0-387-40853-3.doi:10.1007/b97315.url:https://doi.org/10.1007/b97315
work page doi:10.1007/b97315.url:https://doi.org/10.1007/b97315 2004
- [32]
-
[33]
Residential mobility and social capital
Kamhon Kan. “Residential mobility and social capital”. In:Journal of Urban Economics61.3 (2007), pp. 436–457.issn: 0094-1190.doi:https://doi.org/10.1016/j.jue.2006.07.005. url:https://www.sciencedirect.com/science/article/pii/S0094119006000738
-
[34]
Peter Marcuse. “Gentrification, Abandonment, and Displacement: Connections, Causes, and Policy Responses in New York City”. In:Journal of Urban and Contemporary Law28 (Jan. 1985)
work page 1985
-
[35]
Who gentrifies low-income neigh- borhoods?
Terra McKinnish, Randall Walsh, and T. Kirk White. “Who gentrifies low-income neigh- borhoods?” In:Journal of Urban Economics67.2 (2010), pp. 180–193.issn: 0094-1190.doi: https://doi.org/10.1016/j.jue.2009.08.003.url:https://www.sciencedirect.com/ science/article/pii/S0094119009000588
work page doi:10.1016/j.jue.2009.08.003.url:https://www.sciencedirect.com/ 2010
- [36]
-
[37]
On optimal timing of investment when cost compo- nents are additive and follow geometric diffusions
Trond E Olsen and Gunnar Stensland. “On optimal timing of investment when cost compo- nents are additive and follow geometric diffusions”. In:Journal of economic dynamics and control16.1 (1992), pp. 39–51
work page 1992
-
[38]
Alex Pudlin.Los Angeles Index of Displacement Pressure. City of Los Angeles Open Data. Available at https://geohub.lacity.org. 2018.url:https://geohub.lacity.org/datasets/ 70ed646893f642ddbca858c381471fa2_0/explore
work page 2018
- [39]
-
[40]
Race, Class, and the Displacement of White Residents from Gen- trifying U.S. Neighborhoods
Mahesh Somashekhar. “Race, Class, and the Displacement of White Residents from Gen- trifying U.S. Neighborhoods”. In:Social Problems(Nov. 2024), spae070.issn: 0037-7791. doi:10.1093/socpro/spae070. eprint:https://academic.oup.com/socpro/advance- article - pdf / doi / 10 . 1093 / socpro / spae070 / 60811942 / spae070 . pdf.url:https : //doi.org/10.1093/soc...
-
[41]
Daniel Str¨ ombom.Persistent homology in the cubical setting: theory, implementations and applications. 2007
work page 2007
-
[42]
Multilingual extraction and editing of concept strings for the legal domain
Andrea Varga and Andrew N Edmonds. “Multilingual extraction and editing of concept strings for the legal domain”. In:Advances in Computer Science: an International Journal 5.4 (2016), pp. 18–23
work page 2016
-
[43]
Afra Zomorodian and Gunnar Carlsson. “Computing persistent homology”. In:Discrete Com- put. Geom.33.2 (2005), pp. 249–274.issn: 0179-5376.doi:10.1007/s00454-004-1146-y. url:https://doi.org/10.1007/s00454-004-1146-y
-
[44]
Zomorodian.Topology for computing
Afra J. Zomorodian.Topology for computing. Vol. 16. Cambridge Monographs on Applied and Computational Mathematics. Cambridge University Press, Cambridge, 2005, pp. xiv+243. isbn: 0-521-83666-2.doi:10.1017/CBO9780511546945.url:https://doi.org/10.1017/ CBO9780511546945. 15 Supporting Information 16 AppendixA.Data A.1.Datasets.The main data source for this s...
work page doi:10.1017/cbo9780511546945.url:https://doi.org/10.1017/ 2005
-
[45]
The district area remained unchanged, but the subdivision into neighbour- hoods changed. On the top image it can be observed that in 2006, a large part of this district had not been developed yet. 21 Building on the analogy with digital photography, an elementp∈Icalled a pixel ifd= 2 and a voxel ifd≥3. Notice that with this construction voxels are also co...
work page 2006
discussion (0)
Sign in with ORCID, Apple, or X to comment. Anyone can read and Pith papers without signing in.