eROSITA-RU Tidal Disruption Events with Keck-I/LRIS: Sample Selection, Optical Properties, and Host Galaxy Demographics
Pith reviewed 2026-05-16 22:13 UTC · model grok-4.3
The pith
X-ray selected TDEs show only modest over-representation in green valley and quiescent Balmer-strong galaxies.
A machine-rendered reading of the paper's core claim, the machinery that carries it, and where it could break.
Core claim
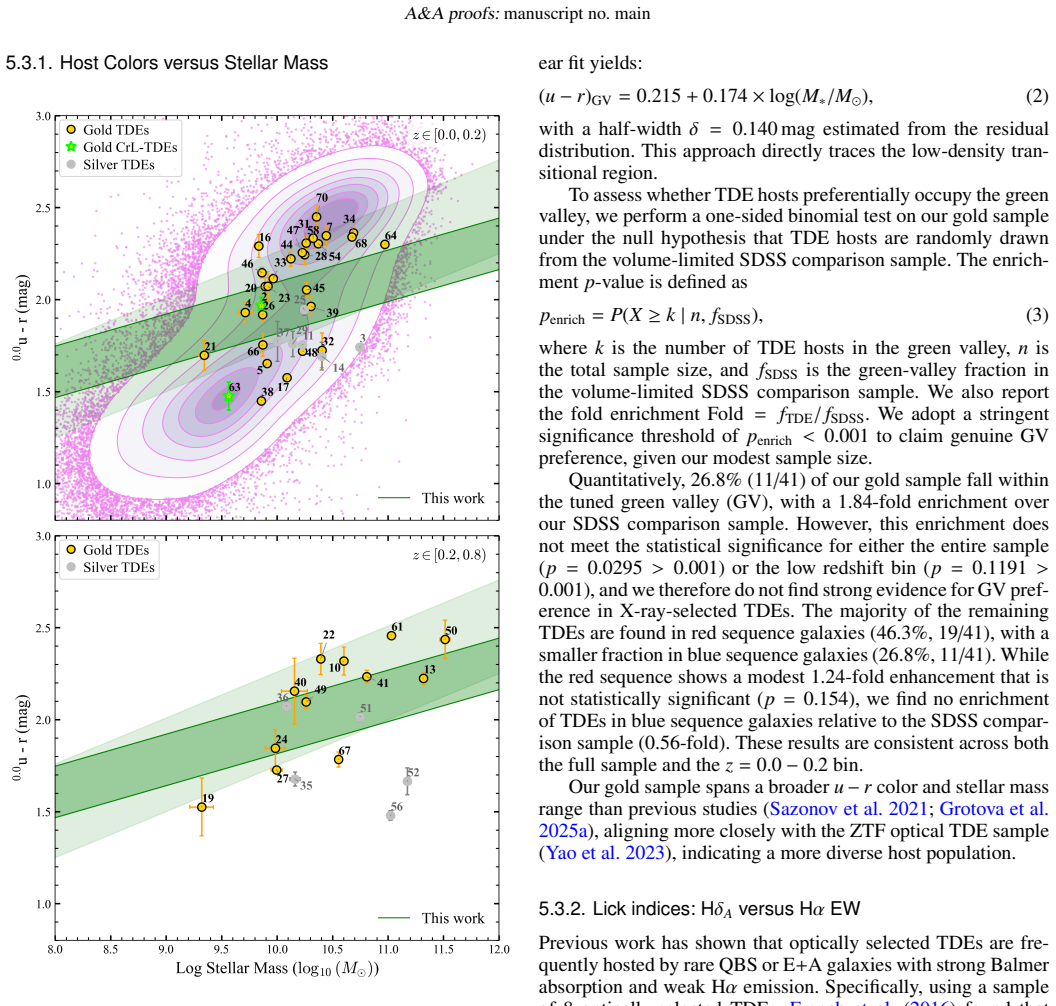
A sample of 52 eROSITA X-ray TDEs, vetted with multi-wavelength diagnostics, shows host galaxies with modest over-representation in green-valley (×1.8) and quiescent Balmer-strong (×5.3) systems, weaker than prior TDE samples, together with suppressed star formation relative to the main sequence and a predominance of X-ray-luminous events.
What carries the argument
Classification scheme that combines X-ray and broad-line luminosities, narrow-line ionization diagnostics, and optical variability to separate true TDEs from supernovae and AGN contaminants.
If this is right
- 93 percent of high-confidence TDEs are intrinsically brighter in X-rays than in the optical at peak.
- Delayed X-ray peaks relative to optical flares are common among events with detected optical emission.
- Transient broad He II and H-alpha features appear in a subset of events, including two coronal-line cases.
- TDE hosts lie below the star-forming main sequence, consistent with selection against dusty star-forming galaxies.
Where Pith is reading between the lines
- X-ray selection may uncover TDEs in a broader range of galaxy evolutionary states than optical selection alone.
- The weaker demographic bias suggests that optical surveys previously missed TDEs in more typical star-forming hosts.
- Combining eROSITA-style X-ray triggers with optical spectroscopy could map how TDE rates depend on galaxy quenching stage.
Load-bearing premise
The multi-wavelength classification scheme correctly identifies genuine TDEs and excludes most supernovae and active galactic nuclei.
What would settle it
Follow-up observations that reclassify a substantial fraction of the gold-sample events as supernovae or AGN variability instead of TDEs.
Figures





read the original abstract
We select seventy tidal disruption event (TDE) candidates among X-ray transients discovered during the eROSITA all-sky surveys in the Eastern Galactic hemisphere between December 2020 and February 2022 (eRASS1--5). We cross-match each X-ray source to a host galaxy in archival optical surveys using Bayesian likelihood-ratio techniques and obtain Keck/LRIS spectroscopy for all 70 host galaxies. Host properties are inferred through SED fitting with Prospector and emission line analysis with pPXF. We develop a robust classification scheme using X-ray and broad line luminosities, narrow-line ionization diagnostics, and optical variability to identify high-confidence TDEs, for which we analyze optical spectral features, light curve properties, and host galaxy demographics. Our final sample contains 52 TDEs with redshifts of $0.018 \leq z\leq0.714$, comprising 41 gold (high-confidence) and 11 silver (lower-confidence) events. The vast majority (93\%) of gold TDEs are intrinsically brighter in the X-ray band, with $L_{\rm X,peak} > L_{\rm opt,peak}$. Among 23 events with detected optical flares, delayed X-ray peak is commonly observed. We identify transient spectral features in eight events, including six with prominent broad \ion{He}{II} $\lambda$4686 and/or H$\alpha$ emission and two coronal-line TDEs. Host galaxy demographics reveal modest over-representation in green valley ($\times1.8$) and quiescent Balmer-strong ($\times5.3$) galaxies, significantly weaker than previous TDE samples, demonstrating greater diversity in star formation histories than previously recognized. Most TDE hosts exhibit suppressed star formation relative to the main sequence, consistent with X-ray selection biases against dusty star-forming galaxies.
Editorial analysis
A structured set of objections, weighed in public.
Referee Report
Summary. The manuscript reports the selection of 70 TDE candidates from eROSITA X-ray transients (eRASS1-5) in the Eastern Galactic hemisphere, cross-matched to hosts via Bayesian likelihood ratios and followed up with Keck/LRIS spectroscopy. A multi-criteria classification scheme based on X-ray/optical luminosities, broad-line strengths, narrow-line BPT diagnostics, and optical variability is used to define 52 TDEs (41 gold high-confidence, 11 silver). The paper analyzes optical spectral features, light-curve properties, and host demographics via Prospector SED fitting and pPXF line analysis, reporting that gold TDEs are mostly X-ray bright, often show delayed X-ray peaks, and exhibit modest over-representation in green-valley (×1.8) and quiescent Balmer-strong (×5.3) galaxies relative to the field population—factors weaker than in prior samples, implying greater diversity in star-formation histories.
Significance. If the classification holds, the work delivers one of the largest spectroscopically confirmed X-ray-selected TDE samples to date, directly addressing selection biases against dusty star-forming hosts and showing that TDE hosts span a broader range of star-formation histories than previously inferred from optically selected samples. This has implications for TDE rate calculations and for using TDEs as probes of supermassive black hole demographics across galaxy types.
major comments (1)
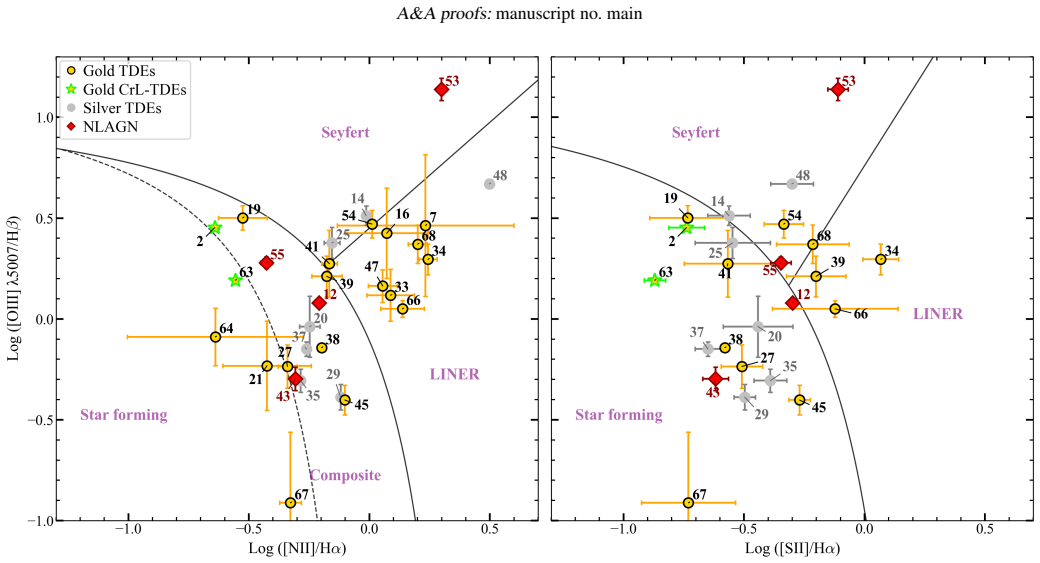
- [Classification scheme] The headline demographic results (green-valley over-representation ×1.8 and quiescent Balmer-strong ×5.3) are derived exclusively from the 41 gold TDEs. The classification scheme (X-ray vs. optical luminosity, broad-line luminosities, narrow-line ionization diagnostics, and optical variability) is asserted to be robust, yet no quantitative false-positive rate, purity estimate, or host-type-dependent contamination model is supplied. Changing-look AGN and certain nuclear transients can satisfy the same flare + broad-line + variability criteria while residing in green-valley or post-starburst hosts; even modest contamination would shift the reported factors and the 'greater diversity' conclusion.
minor comments (2)
- [Abstract] The abstract states that the over-representation factors are 'significantly weaker than previous TDE samples' but provides neither citations to the specific prior works nor the numerical factors being compared.
- [Classification scheme] Exact numerical thresholds used to separate gold from silver events (e.g., luminosity ratios, line-strength cuts, variability significance) are not tabulated or stated explicitly, limiting reproducibility.
Simulated Author's Rebuttal
We appreciate the referee's careful review of our manuscript on eROSITA-selected TDEs. We address the major comment on the classification scheme below.
read point-by-point responses
-
Referee: [Classification scheme] The headline demographic results (green-valley over-representation ×1.8 and quiescent Balmer-strong ×5.3) are derived exclusively from the 41 gold TDEs. The classification scheme (X-ray vs. optical luminosity, broad-line luminosities, narrow-line ionization diagnostics, and optical variability) is asserted to be robust, yet no quantitative false-positive rate, purity estimate, or host-type-dependent contamination model is supplied. Changing-look AGN and certain nuclear transients can satisfy the same flare + broad-line + variability criteria while residing in green-valley or post-starburst hosts; even modest contamination would shift the reported factors and the 'greater diversity' conclusion.
Authors: We thank the referee for this insightful comment. Our classification scheme combines multiple independent criteria to define the gold sample, with particular emphasis on X-ray dominance (93% of gold TDEs satisfy L_X,peak > L_opt,peak) and narrow-line BPT diagnostics to rule out AGN. We agree that a quantitative false-positive rate is not provided in the current version. In the revised manuscript, we will include an expanded discussion of potential contaminants such as changing-look AGN, providing an order-of-magnitude estimate of their contribution based on literature rates and the eROSITA survey characteristics. We will also clarify that while a full host-type-dependent contamination model would be ideal, the weaker over-representation factors compared to prior samples suggest that contamination is unlikely to drive the observed greater diversity in star formation histories. We will note this as a caveat in the text. revision: partial
Circularity Check
No significant circularity; purely observational classification and demographics
full rationale
The paper performs candidate selection from eROSITA X-ray transients, cross-matching to hosts, Keck spectroscopy, SED fitting via Prospector, line analysis via pPXF, and a multi-criteria classification (X-ray/optical luminosities, broad-line strengths, BPT diagnostics, variability) to define gold/silver TDEs. Demographics (green-valley ×1.8, quiescent Balmer-strong ×5.3) are then computed directly on the resulting 41 gold events against external surveys. No equations, fitted parameters renamed as predictions, self-definitional loops, or load-bearing self-citations appear; the classification scheme is presented as a data-driven filter without reducing to its own outputs by construction. This is a standard observational pipeline with independent external benchmarks.
Axiom & Free-Parameter Ledger
Reference graph
Works this paper leans on
-
[1]
Alexander, K. D., van Velzen, S., Horesh, A., & Zauderer, B. A. 2020, Space Sci. Rev., 216, 81 Andalman, Z. L., Liska, M. T. P., Tchekhovskoy, A., Coughlin, E. R., & Stone, N. 2022, MNRAS, 510, 1627 Antonucci, R. 1993, ARA&A, 31, 473 Arcavi, I., Gal-Yam, A., Sullivan, M., et al. 2014, ApJ, 793, 38 Bade, N., Komossa, S., & Dahlem, M. 1996, A&A, 309, L35 Ba...
work page internal anchor Pith review Pith/arXiv arXiv 2020
-
[2]
are beyond the time range of the x-axis. For ID 47, since the optical flare was detected during ZTF reference image building, we perform baseline correction following Yao et al. (2019). Figures A.7 and A.8 show theProspectorSED fitting re- sults of the host galaxies of our gold and silver samples. Appendix B: Supplementary Tables Table B.1 shows the prope...
work page 2019
-
[3]
TDE-H+He 11 He IIλ4686 4690.0±2.67 39.45±7.52 30132±3366 2420±674 Hαbroad 6588.2±110.4 20.20±4.29 12029±4033 1018±209 Hαrest 6567.1±17.2 3.82±2.35 1909±1380 193±119 Hαblue 6472.6±20.8 2.69±2.02 2238±1289 127±105 33 He IIλ4686 4690.00±0.85 15.18±6.32 22598±4185 604.2±251.5 Hαbroad 6562.8±126.5 14.90±4.98 9265±3765 450±151 Hαrest 6567.1±19.7 3.67±1.89 1855±...
work page 1909
-
[4]
Given the non-detection of Hα, we classify this object as TDE-He
TDE-He 197 He IIλ4686 4515.7±12.5 69.97±13.48 24262±7809 966.9±179.2 Hβbroad 4861.3 5.73±2.22 1595±607 79.88±32.15 Hαbroad — — —<48.81 Notes.For SRGe J235453.0+421711 (ID 70), the skewness of He IIλ4686 line is−0.36±0.29. Given the non-detection of Hα, we classify this object as TDE-He. While a Gaussian centered on Hβis favored by BIC (∆BIC=11.42>10), we ...
work page 2020
discussion (0)
Sign in with ORCID, Apple, or X to comment. Anyone can read and Pith papers without signing in.