Predicting Forecast Error for the HRRR Using LSTM Neural Networks: A Comparative Study Using New York and Oklahoma State Mesonets
Pith reviewed 2026-05-16 21:58 UTC · model grok-4.3
The pith
LSTM networks trained on mesonet data predict HRRR precipitation forecast errors with 48 percent average improvement.
A machine-rendered reading of the paper's core claim, the machinery that carries it, and where it could break.
Core claim
LSTM models can be trained directly on HRRR forecast fields paired with mesonet ground truth to output location-specific predictions of forecast error; the largest skill gain occurs for precipitation (average 48 percent improvement), followed by temperature (25 percent) and wind (15 percent), with precipitation showing better detection of overforecast than underforecast events.
What carries the argument
Long Short-Term Memory neural networks trained on time series of HRRR forecast variables paired with corresponding mesonet observations to regress the forecast error at each station.
If this is right
- Deterministic HRRR forecasts can be adjusted in real time at mesonet sites by adding the LSTM-predicted error.
- Sites and variables with systematically larger predicted errors can be flagged as higher uncertainty.
- The error predictions supply supplemental guidance for high-impact weather decisions.
- Precipitation error predictions detect overforecast events more accurately than underforecast events.
Where Pith is reading between the lines
- The same training approach could be applied to other high-resolution NWP models if comparable dense observation networks exist.
- In regions without dense mesonets the method would likely lose most of its skill because training pairs would be unavailable.
- Smoothing observed in the temperature error predictions suggests the LSTMs may also be learning a form of bias correction beyond raw error magnitude.
Load-bearing premise
The statistical relationship between HRRR forecast errors and mesonet observations stays stable enough that a network trained on past data will keep predicting future errors accurately.
What would settle it
Apply the trained LSTMs to HRRR output from a later period that includes a major model upgrade or a change in mesonet sensor calibration and measure whether the percent improvement over the raw forecast drops below 20 percent for precipitation.
Figures






read the original abstract
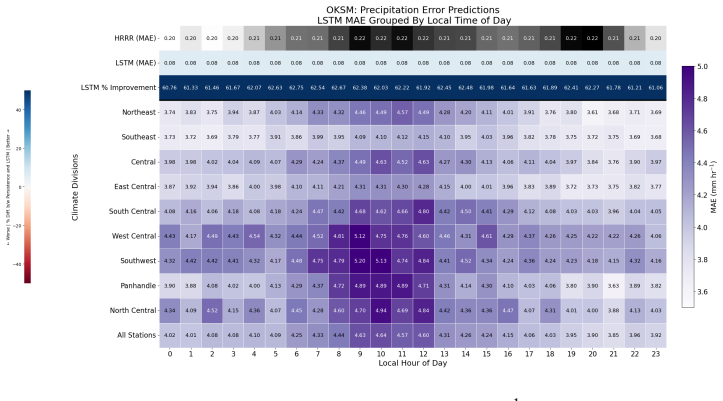
Long Short-Term Memory (LSTM) models are trained to predict forecast errors for the High-Resolution Rapid Refresh (HRRR) model using the New York State Mesonet and Oklahoma State Mesonet near-surface weather observations as ground truth. When evaluated using mean-absolute-error and percent improvement relative to the HRRR, LSTMs predict precipitation error most accurately, providing, on average, a 48% improvement relative to the HRRR forecast, followed by wind error, providing, on average, a 15% improvement, and then temperature error, providing, on average, a 25% improvement. Precipitation errors exhibit an asymmetry, with overforecast precipitation detected more accurately than underforecast, while wind error predictions are consistent across over- and underforecast predictions. Temperature error predictions are relatively accurate but smoother, with respect to variance, than true observations. This paper describes an overview of LSTM performance with the expressed intent of providing forecasters with real-time predictions of forecast error at the point of use within the New York State and Oklahoma State Mesonets. In practice, the predicted errors can be used to adjust deterministic HRRR forecasts at the point of use, identify locations and variables with elevated uncertainty, and provide supplemental guidance for high-impact decision-making. This research demonstrates the potential of LSTM-based machine learning models to provide actionable, location-specific predictions of forecast error for high-resolution operational numerical weather prediction (NWP) systems. However, model performance is variable-dependent, and the approach relies on the availability of dense mesonet observations, which may limit applicability in data-sparse regions.
Editorial analysis
A structured set of objections, weighed in public.
Referee Report
Summary. The paper trains LSTM models on paired HRRR forecasts and near-surface observations from the New York State and Oklahoma State Mesonets to predict forecast errors for precipitation, temperature, and wind. When evaluated with mean absolute error, the LSTMs yield average improvements of 48% for precipitation error, 25% for temperature error, and 15% for wind error relative to the raw HRRR forecasts, with additional observations on asymmetry in precipitation errors and smoother temperature predictions.
Significance. If the improvements prove robust under strict future temporal validation, the work offers practical value for operational forecasting by enabling real-time, location-specific error corrections at mesonet sites. This could support high-impact decision-making and uncertainty identification in data-dense regions, leveraging dense observational networks as ground truth.
major comments (2)
- [Abstract] Abstract and evaluation sections: the headline improvements (48% precipitation, 25% temperature, 15% wind) are reported without any description of the temporal train/test split, cross-validation method, or confirmation that test periods follow training periods. Weather time series are strongly autocorrelated, so a non-causal split risks leakage that would inflate the percent improvements; explicit dates, rolling-origin validation, or blocked CV details are required to substantiate generalization to future forecasts.
- [Results] Evaluation and results: no information is supplied on hyperparameter search, statistical significance testing of the MAE reductions, or sensitivity to model architecture. This leaves the central claim of variable-dependent performance only moderately supported, particularly for the precipitation asymmetry result.
minor comments (2)
- [Abstract] Abstract: a single sentence on the data period or LSTM architecture (layers, units) would improve completeness without lengthening the text.
- [Figures] Figure clarity: ensure error time series plots distinguish predicted vs. observed errors with consistent y-axis scaling across variables.
Simulated Author's Rebuttal
We appreciate the referee's thorough review and valuable suggestions for improving the clarity and rigor of our manuscript. We address each major comment below and plan to incorporate revisions as indicated.
read point-by-point responses
-
Referee: [Abstract] Abstract and evaluation sections: the headline improvements (48% precipitation, 25% temperature, 15% wind) are reported without any description of the temporal train/test split, cross-validation method, or confirmation that test periods follow training periods. Weather time series are strongly autocorrelated, so a non-causal split risks leakage that would inflate the percent improvements; explicit dates, rolling-origin validation, or blocked CV details are required to substantiate generalization to future forecasts.
Authors: We agree that providing explicit details on the data splitting procedure is essential to demonstrate the robustness of our results against temporal autocorrelation. In the revised manuscript, we will expand the evaluation section to include the specific temporal train/test split dates, confirm that the test period follows the training period, and describe the cross-validation method used (blocked CV) to avoid data leakage. This will substantiate the generalization to future forecasts. revision: yes
-
Referee: [Results] Evaluation and results: no information is supplied on hyperparameter search, statistical significance testing of the MAE reductions, or sensitivity to model architecture. This leaves the central claim of variable-dependent performance only moderately supported, particularly for the precipitation asymmetry result.
Authors: We acknowledge the need for additional details on the modeling process to better support our claims. The revised manuscript will include a description of the hyperparameter search procedure, statistical significance testing of the MAE reductions (such as paired t-tests), and sensitivity analyses to model architecture variations. These additions will provide stronger evidence for the variable-dependent performance, including the observed asymmetry in precipitation errors. revision: yes
Circularity Check
No circularity; empirical ML evaluation on held-out observations is independent of fitted parameters
full rationale
The paper trains LSTMs on historical mesonet-HRRR pairs to predict forecast errors and reports empirical metrics (MAE and percent improvement) on separate test data. No equations, derivations, or self-citations reduce the claimed improvements (48% precipitation, 25% temperature, 15% wind) to quantities defined by the model parameters themselves. The evaluation uses independent ground-truth observations, satisfying the condition for a self-contained result against external benchmarks. No self-definitional, fitted-input-called-prediction, or uniqueness-imported patterns appear in the abstract or described methodology.
Axiom & Free-Parameter Ledger
free parameters (2)
- LSTM weights and biases
- Model hyperparameters (layers, units, learning rate, etc.)
axioms (1)
- domain assumption Mesonet observations represent the true near-surface state for the purpose of defining forecast error.
Reference graph
Works this paper leans on
-
[1]
Abuduwali Aibaidula and George Mcmechan. Case history inversion and interpretation of a 3d seismic data set from the ouachita mountains, oklahoma. GEOPHYSICS, 74, 03 2009. doi:10.1190/1.3073005
-
[2]
New york state climate change projections methodology report
Daniel Bader and Radley Horton. New york state climate change projections methodology report. Technical report, new york state climate impacts assessment, Columbia University, Lamont-Doherty Earth Observatory, Columbia Climate School, September 2023. Prepared for the New York State Climate Impacts Assessment
work page 2023
-
[3]
A. G. Barnston and C. F. Ropelewski. Prediction of enso episodes using canonical correlation analysis. J. Climate, 5: 0 1316--1345, 1992. doi:10.1175/1520-0442(1992)005<1316:POEEUC>2.0.CO;2
-
[4]
Bishop and Hugh Bishop.Deep Learning: Foundations and Concepts
Christopher M. Bishop and Hugh Bishop. Deep Learning: Foundations and Concepts. Springer Cham, 1 edition, 2023. ISBN 978-3-031-45467-7. doi:https://doi.org/10.1007/978-3-031-45468-4. URL https://doi.org/10.1007/978-3-031-45468-4. 200 b/w illustrations, 400 illustrations in colour
-
[5]
B. K. Blaylock, J. D. Horel, and S. T. Liston. Cloud archiving and data mining of high-resolution rapid refresh forecast model output. Computers & Geosciences, 109: 0 43--50, 2017. doi:10.1016/j.cageo.2017.08.005. URL https://doi.org/10.1016/j.cageo.2017.08.005
-
[6]
On some limitations of current machine learning weather prediction models
Massimo Bonavita. On some limitations of current machine learning weather prediction models. Geophysical Research Letters, 51 0 (12): 0 e2023GL107377, 2024. doi:10.1029/2023GL107377
-
[7]
F. V. Brock, K. C. Crawford, R. L. Elliott, G. W. Cuperus, S. J. Stadler, H. L. Johnson, and M. D. Eilts. The oklahoma mesonet: A technical overview. Journal of Atmospheric and Oceanic Technology, 12: 0 5--19, 1995. doi:10.1175/1520-0426(1995)012<0005:TOMATO>2.0.CO;2
-
[8]
J. A. Brotzge et al. A technical overview of the new york state mesonet standard network. Journal of Atmospheric and Oceanic Technology, 37: 0 1827--1845, 2020. doi:10.1175/JTECH-D-19-0220.1. URL https://doi.org/10.1175/JTECH-D-19-0220.1
-
[9]
Leah S. Campbell and W. James Steenburgh. The owles iop2b lake-effect snowstorm: Mechanisms contributing to the tug hill precipitation maximum. Monthly Weather Review, 145: 0 2461--2478, 2017. doi:10.1175/MWR-D-16-0460.1. Ontario Winter Lake-effect Systems (OWLeS) field campaign
-
[10]
Dylan R. Card, Kristen L. Corbosiero, Ross A. Lazear, Hugh Johnson, and Michael Augustyniak. Mohawk-hudson convergence. Presentation, 42nd Northeast Storms Conference, 2023. URL https://www.atmos.albany.edu/student/dcard/MHC.html. Accessed: 2025-09-06
work page 2023
-
[11]
M. L. Carrera, J. R. Gyakum, and C. A. Lin. Observational study of wind channeling within the st. lawrence river valley. Journal of Applied Meteorology and Climatology, 48: 0 2341--2361, 2009. doi:10.1175/2009JAMC2061.1
-
[12]
Barbara Casati, Laurence Wilson, David Stephenson, Pertti Nurmi, Anna Ghelli, M. Pocernich, U. Damrath, Elizabeth Ebert, Barbara Brown, and Simon Mason. Forecast verification: Current status and future directions. Meteorological Applications - METEOROL APPL, 15: 0 3--18, 03 2008. doi:10.1002/met.52
-
[13]
Ethan Collins, Zachary J. Lebo, Robert Cox, Christopher Hammer, Matthew Brothers, Bart Geerts, Robert Capella, and Sarah McCorkle. Forecasting high wind events in the hrrr model over wyoming and colorado. part i: Evaluation of wind speeds and gusts. Weather and Forecasting, 39 0 (5): 0 705--723, 2024. doi:10.1175/WAF-D-23-0036.1
-
[14]
F. Couvreux, F. Guichard, P. H. Austin, and F. Chen. Nature of the mesoscale boundary layer height and water vapor variability observed 14 june 2002 during the ihop\_2002 campaign. Monthly Weather Review, 137: 0 414--432, 2009. doi:10.1175/2008MWR2367.1
-
[15]
Applications in atmospheric dynamics: Measurements of wind, moisture and boundary layer evolution
Belay Demoz, David Whiteman, Bruce Gentry, Geary Schwemmer, Keith Evans, Paolo Di Girolamo, and Joseph Comer. Applications in atmospheric dynamics: Measurements of wind, moisture and boundary layer evolution. In Proceedings of IHOP\_2002, Western Oklahoma, 2002. URL https://www.academia.edu/76719119/Lidar_Applications_in_Atmospheric_Dynamics_Measurements_...
-
[16]
N. Dewani, M. Sakradzija, L. Schlemmer, R. Leinweber, and J. Schmidli. Dependency of vertical velocity variance on meteorological conditions in the convective boundary layer. Atmospheric Chemistry and Physics, 23: 0 4045--4058, 2023. doi:10.5194/acp-23-4045-2023. URL https://doi.org/10.5194/acp-23-4045-2023
-
[17]
J. Dewitz and U.S. Geological Survey . National land cover database (nlcd) 2019 products (ver. 2.0, june 2021), 2021. URL https://doi.org/10.5066/P9KZCM54
-
[18]
D. C. Dowell et al. The high-resolution rapid refresh (hrrr): An hourly updating convection-allowing forecast model. part i: Motivation and system description. Weather and Forecasting, 37: 0 1371--1395, 2022. doi:10.1175/WAF-D-21-0151.1. URL https://doi.org/10.1175/WAF-D-21-0151.1
-
[19]
J. D. Duda and D. D. Turner. Using object-based verification to assess improvements in forecasts of convective storms between operational hrrr versions 3 and 4. Weather and Forecasting, 38: 0 1971--1994, 2023. doi:10.1175/WAF-D-22-0181.1
-
[20]
Earth Resources Observation , Science Center, U.S. Geological Survey, and U.S. Department of the Interior. Usgs 30 arc-second global elevation data, gtopo30, 1997. URL https://doi.org/10.5065/A1Z4-EE71
-
[21]
Elizabeth Ebert, Barbara Brown, T. Fowler, P. Gill, Martin Göber, Susan Joslyn, Marion Mittermaier, Pertti Nurmi, Andrew Watkins, and A. Weigel. Progress and challenges in forecast verification. Meteorological Applications, 20, 06 2013. doi:10.1002/met.1392
-
[22]
Imme Ebert - Uphoff, Ryan Lagerquist, Kyle Hilburn, Yoonjin Lee, Katherine Haynes, Jason Stock, Christina Kumler, and Jebb Q. Stewart. CIRA guide to custom loss functions for neural networks in environmental sciences - version 1. CoRR, abs/2106.09757, 2021. URL https://arxiv.org/abs/2106.09757
-
[23]
Robert G. Fovell and S. B. Capps. Sustained wind forecasts from the high-resolution rapid refresh model: Skill assessment and bias mitigation. Atmosphere, 16 0 (1): 0 16, 2025. doi:10.3390/atmos16010016
-
[24]
L. C. Gaudet, K. J. Sulia, R. D. Torn, and N. P. Bassill. Verification of the global forecast system, north american mesoscale forecast system, and high-resolution rapid refresh model near-surface forecasts by use of the new york state mesonet. Weather and Forecasting, 39: 0 369--386, 2024. doi:10.1175/WAF-D-23-0094.1. URL https://doi.org/10.1175/WAF-D-23-0094.1
-
[25]
E. Gilleland. Testing competing precipitation forecasts accurately and efficiently: The spatial prediction comparison test. Monthly Weather Review, 141: 0 340--355, 2013. doi:10.1175/MWR-D-12-00155.1
-
[26]
Brown, Barbara Casati, and Elizabeth E
Eric Gilleland, David Ahijevych, Brian G. Brown, Barbara Casati, and Elizabeth E. Ebert. Intercomparison of spatial forecast verification methods. Weather and Forecasting, 24: 0 1416--1430, 2009. doi:10.1175/2009WAF2222269.1
-
[27]
Classification: Accuracy, recall, precision, and related metrics
Google Developers . Classification: Accuracy, recall, precision, and related metrics. https://developers.google.com/machine-learning/crash-course/classification/accuracy-precision-recall, 2025. Accessed: 2025-09-05
work page 2025
-
[28]
H. Guan and Y. Zhu. Development of verification methodology for extreme weather forecasts. Weather and Forecasting, 32: 0 479--491, 2017. doi:10.1175/WAF-D-16-0123.1
-
[29]
K. R. Haghi and Coauthors. Bore-ing into nocturnal convection. Bull. Amer. Meteor. Soc., 100: 0 1103--1121, 2019. doi:10.1175/BAMS-D-17-0250.1
-
[30]
K. R. Haghi and D. R. Durran. On the dynamics of atmospheric bores. J. Atmos. Sci., 78: 0 313--327, 2021. doi:10.1175/JAS-D-20-0181.1. URL https://doi.org/10.1175/JAS-D-20-0181.1
-
[31]
K. R. Haghi, D. B. Parsons, and A. Shapiro. Bores observed during ihop\_2002: The relationship of bores to the nocturnal environment. Mon. Wea. Rev., 145: 0 3929--3946, 2017. doi:10.1175/MWR-D-16-0415.1
-
[32]
D. L. Hahs-Vaughn. Foundational methods: descriptive statistics: bivariate and multivariate data (correlations, associations). In R. J. Tierney, F. Rizvi, and K. Ercikan, editors, International Encyclopedia of Education, pages 734--750. Elsevier, 2023. ISBN 9780128186299. doi:10.1016/B978-0-12-818630-5.10084-3. URL https://doi.org/10.1016/B978-0-12-818630...
-
[33]
C. E. Hane, J. D. Watts, D. L. Andra, J. A. Haynes, E. Berry, R. M. Rabin, and F. H. Carr. The evolution of morning convective systems over the u.s. great plains during the warm season. part i: The forecast problem. Weather and Forecasting, 18 0 (6): 0 1286--1294, 2003. doi:10.1175/1520-0434(2003)018<1286:TEOMCS>2.0.CO;2. URL https://doi.org/10.1175/1520-...
-
[34]
Carl E. Hane, John A. Haynes, David L. Andra, and Frederick H. Carr. The evolution of morning convective systems over the u.s. great plains during the warm season. part ii: A climatology and the influence of environmental factors. Monthly Weather Review, 136 0 (3): 0 929--944, 2008. doi:10.1175/2007MWR2016.1. URL https://doi.org/10.1175/2007MWR2016.1
-
[35]
J. Hoch and P. Markowski. A climatology of springtime dryline position in the u.s. great plains region. Journal of Climate, 18 0 (11): 0 2132--2137, 2005. doi:10.1175/JCLI3392.1. URL https://doi.org/10.1175/JCLI3392.1
-
[36]
Sepp Hochreiter and Jürgen Schmidhuber. Long short-term memory. Neural Computation, 9: 0 1735--1780, 11 1997. doi:10.1162/neco.1997.9.8.1735
-
[37]
Eric P. James, Curtis R. Alexander, David C. Dowell, Stephen S. Weygandt, Stanley G. Benjamin, Geoffrey S. Manikin, John M. Brown, Joseph B. Olson, Ming Hu, Tatiana G. Smirnova, Terra Ladwig, Jaymes S. Kenyon, and David D. Turner. The high-resolution rapid refresh (hrrr): An hourly updating convection-allowing forecast model. part ii: Forecast performance...
-
[38]
S. Kapoor and A. Narayanan. Leakage and the reproducibility crisis in machine-learning-based science. Patterns (N Y), 4 0 (9): 0 100804, Aug 2023. doi:10.1016/j.patter.2023.100804
-
[40]
Ç. Küçük, A. Giannakos, S. Schneider, and A. Jann. Transformer-based nowcasting of radar composites from satellite images for severe weather. Artificial Intelligence for the Earth Systems, 3: 0 e230041, 2024. doi:10.1175/AIES-D-23-0041.1. URL https://doi.org/10.1175/AIES-D-23-0041.1
-
[41]
R. Lagerquist, A. McGovern, C. R. Homeyer, D. J. Gagne II, and T. Smith. Deep learning on three-dimensional multiscale data for next-hour tornado prediction. Monthly Weather Review, 148: 0 2837--2861, 2020. doi:10.1175/MWR-D-19-0372.1. URL https://doi.org/10.1175/MWR-D-19-0372.1
-
[42]
Ryan Lagerquist and Imme Ebert-Uphoff. Can we integrate spatial verification methods into neural network loss functions for atmospheric science? Artificial Intelligence for the Earth Systems, 1: 0 e220021, 2022. doi:10.1175/AIES-D-22-0021.1
-
[43]
Nicholas Laird, Ryan Sobash, and Nathan Hodas. Climatological conditions of lake-effect precipitation events associated with the new york state finger lakes. Journal of Applied Meteorology and Climatology, 49 0 (5): 0 1052--1062, 2009. doi:10.1175/2009JAMC2312.1
-
[44]
Three approaches to encoding time information as features for ml models, 2022
Eryk Lewinson. Three approaches to encoding time information as features for ml models, 2022. URL https://developer.nvidia.com/blog/three-approaches-to-encoding-time-information-as-features-for-ml-models/. Accessed: May 22, 2025
work page 2022
-
[45]
D. Li, E. Bou-Zeid, M. Barlage, F. Chen, and J. A. Smith. Development and evaluation of a mosaic approach in the wrf-noah framework. J. Geophys. Res. Atmos., 118: 0 11,918--11,935, 2013. doi:10.1002/2013JD020657. URL https://doi.org/10.1002/2013JD020657
-
[46]
G. Lin, C. Grasmick, B. Geerts, Z. Wang, and M. Deng. Convection initiation and bore formation following the collision of mesoscale boundaries over a developing stable boundary layer: A case study from pecan. Mon. Wea. Rev., 149: 0 2351--2367, 2021. doi:10.1175/MWR-D-20-0282.1
-
[47]
M. K. Mak and J. E. Walsh. On the relative intensities of sea and land breezes. Journal of the Atmospheric Sciences, 33 0 (2): 0 242--251, 1976. doi:10.1175/1520-0469(1976)033<0242:OTRIOS>2.0.CO;2
-
[48]
E. J. McCabe and J. M. Freedman. Development of an objective methodology for identifying the sea-breeze circulation and associated low-level jet in the new york bight. Weather and Forecasting, 38: 0 571--589, 2023. doi:10.1175/WAF-D-22-0119.1
-
[49]
John McCarthy and Steven E. Koch. The evolution of an oklahoma dryline. part i: A meso- and subsynoptic-scale analysis. Journal of the Atmospheric Sciences, 39: 0 225--236, 1982. doi:10.1175/1520-0469(1982)039<0225:TEOAOD>2.0.CO;2
-
[50]
R. A. McPherson et al. Statewide monitoring of the mesoscale environment: A technical update on the oklahoma mesonet. Journal of Atmospheric and Oceanic Technology, 24: 0 301--321, 2007. doi:10.1175/JTECH1976.1
-
[51]
J. R. Moskaitis. A case study of deterministic forecast verification: Tropical cyclone intensity. Weather and Forecasting, 23: 0 1195--1220, 2008. doi:10.1175/2008WAF2222133.1
-
[52]
High-resolution rapid refresh (hrrr) model, 2024
National Centers for Environmental Prediction . High-resolution rapid refresh (hrrr) model, 2024. URL https://rapidrefresh.noaa.gov/hrrr/. Accessed: 1 Apr. 2025
work page 2024
-
[53]
NCEI . U.s. climate divisions. https://www.ncei.noaa.gov/access/monitoring/dyk/us-climate-divisions, 2015. Accessed: 2023-08-03
work page 2015
-
[54]
G. Nearing, D. Cohen, V. Dube, et al. Global prediction of extreme floods in ungauged watersheds. Nature, 627: 0 559--563, 2024. doi:10.1038/s41586-024-07145-1. URL https://doi.org/10.1038/s41586-024-07145-1
-
[55]
Oklahoma Climatological Survey . Oklahoma climate overview. https://www.ou.edu/ocs/oklahoma-climate, 2025. Accessed June 2025
work page 2025
-
[56]
F. Pedregosa, G. Varoquaux, A. Gramfort, V. Michel, B. Thirion, O. Grisel, et al. Scikit-learn: Machine learning in python. Journal of Machine Learning Research, 12: 0 2825--2830, 2011. URL https://jmlr.csail.mit.edu/papers/v12/pedregosa11a.html
work page 2011
-
[57]
M.-T. Puth, M. Neuhäuser, and G. D. Ruxton. Effective use of spearman's and kendall's correlation coefficients for association between two measured traits. Animal Behaviour, 102: 0 77--84, 2015. doi:10.1016/j.anbehav.2015.01.010
-
[58]
Lstm — pytorch 2.0 documentation, 2024
PyTorch . Lstm — pytorch 2.0 documentation, 2024. URL https://pytorch.org/docs/stable/generated/torch.nn.LSTM.html
work page 2024
-
[59]
Gis-based regression modeling of the extreme weather patterns in arkansas, usa
Kyle Rowden and Mohamed Aly. Gis-based regression modeling of the extreme weather patterns in arkansas, usa. Geoenvironmental Disasters, 5: 0 6, 03 2018. doi:10.1186/s40677-018-0098-0
-
[60]
Wind channeling in the hudson valley, ny
Ricardo Sakai, David Fitzjarrald, Chris Walcek, Matt Czikowsky, and Jeffrey Freedman. Wind channeling in the hudson valley, ny. 01 2006
work page 2006
-
[61]
D. J. Seidel, Y. Zhang, A. Beljaars, C. Golaz, A. R. Jacobson, and B. Medeiros. Climatology of the planetary boundary layer over the continental united states and europe. Journal of Geophysical Research: Atmospheres, 117 0 (D17), 2012. doi:10.1029/2012JD018143. URL https://doi.org/10.1029/2012JD018143
-
[62]
D. Seto, C. Jones, D. Siuta, N. Wagenbrenner, C. Thompson, and N. Quinn. Evaluation of hrrr wind speed forecast and windninja downscaling accuracy during santa ana wind events in southern california. Weather and Forecasting, 40: 0 525--541, 2025. doi:10.1175/WAF-D-24-0013.1
-
[63]
J. Song, K. Liao, R. L. Coulter, and B. M. Lesht. Climatology of the low-level jet at the southern great plains atmospheric boundary layer experiments site. Journal of Applied Meteorology and Climatology, 44: 0 1593--1606, 2005. doi:10.1175/JAM2294.1
-
[64]
U.S. Geological Survey. National land cover database (nlcd) land use/land cover (lulc) data, 2023. URL https://www.usgs.gov/centers/eros/science/national-land-cover-database. Accessed: 2025-04-01
work page 2023
-
[65]
Madhusmita Swain, Jean Carlos Peña, Robert Bornstein, and Jorge Gonzalez. Coastal and anthropogenic heat impacts on pbl processes during extreme summer thunderstorm precipitation in new york city. Urban Climate, 62, 07 2025. doi:10.1016/j.uclim.2025.102534
-
[66]
Lake effect and lake enhanced snow in the champlain valley of vermont
Alexander Tardy. Lake effect and lake enhanced snow in the champlain valley of vermont. Technical Report 2000-05, National Weather Service, Eastern Region Technical Attachment, Burlington, Vermont, 2000. URL https://www.weather.gov/media/erh/ta/ta2000-05.pdf
work page 2000
-
[67]
Emily N. Tinney and James Jr. Correia. Difficulties with classifying and analyzing the low-level jet in a convection-allowing ensemble, 2017. URL https://caps.ou.edu/reu/reu17/finalpapers/Tinney-finalpaper.pdf. Accessed: 2025-08-15
work page 2017
-
[68]
G. Wang, X. Wang, X. Wu, K. Liu, Y. Qi, C. Sun, and H. Fu. A hybrid multivariate deep learning network for multistep ahead sea level anomaly forecasting. Journal of Atmospheric and Oceanic Technology, 39: 0 285--301, 2022. doi:10.1175/JTECH-D-21-0043.1. URL https://doi.org/10.1175/JTECH-D-21-0043.1
-
[69]
S. Wang, L. Mu, and D. Liu. A hybrid approach for el niño prediction based on empirical mode decomposition and convolutional lstm encoder-decoder. Computers and Geosciences, 149: 0 104695, 2021. doi:10.1016/j.cageo.2021.104695. URL https://doi.org/10.1016/j.cageo.2021.104695
-
[70]
Dino Zardi and C.\ David Whiteman. Diurnal mountain wind systems. In Franklin K. Chow et al., editors, Mountain Weather Research and Forecasting, Springer Atmospheric Sciences, pages 35--119. Springer, 2013. doi:10.1007/978-94-007-4098-3\_2. Chapter 2
-
[71]
Yuxin Zhang, Kuo Sun, Zhiqiang Gao, Zhe Pan, Michael A. Shook, and Dan Li. Diurnal climatology of planetary boundary layer height over the contiguous united states derived from amdar and reanalysis data. Journal of Geophysical Research: Atmospheres, 125 0 (20): 0 e2020JD032803, 2020. doi:10.1029/2020JD032803. URL https://doi.org/10.1029/2020JD032803
-
[72]
X. Zheng, J.-C. Golaz, S. Xie, Q. Tang, W. Lin, M. Zhang, et al. The summertime precipitation bias in e3sm atmosphere model version 1 over the central united states. Journal of Geophysical Research: Atmospheres, 124: 0 8935--8952, 2019. doi:10.1029/2019JD030662. URL https://doi.org/10.1029/2019JD030662
-
[73]
Jad Ziolkowska, Christopher Fiebrich, J. Carlson, Andrea Melvin, Albert Sutherland, Kevin Kloesel, Gary McManus, Bradley Illston, James Hocker, and Reuben Reyes. Benefits and beneficiaries of the oklahoma mesonet--a multi-sectoral ripple effect analysis. Weather, Climate, and Society, 9, April 2017. doi:10.1175/WCAS-D-16-0139.1
discussion (0)
Sign in with ORCID, Apple, or X to comment. Anyone can read and Pith papers without signing in.