REVIEW 3 major objections 5 minor 3 references
Long-term monitoring of repeating FRB 20220912A with the uGMRT at low radio frequencies
T0 review · 3 major / 5 minor · reviewed 2026-08-03 · deepseek-v4-flash
Pith's one-line read FRB 20220912A's burst energy distribution is a broken power law with the same shape across 300–750 MHz and over 500 days of extreme activity, matching other active repeaters.
desk verdict Valuable low-frequency burst catalog and activity timeline for a hyperactive repeater, but the claimed broken energy distribution is not yet established—the stacking method may be manufacturing the break. read the letter →
The pith
A machine-rendered reading of the paper's core claim, the machinery that carries it, and where it could break.
The reading
What carries the argument
The central object is the cumulative distribution of burst spectral energies, built from fluences measured above epoch-specific 90% completeness thresholds and fit with a single or broken power law using AICc model selection and MCMC parameter estimation. The completeness thresholds themselves are derived by injecting thousands of simulated dispersed pulses into raw beamformed data from one epoch (2022 Nov 24) and then scaled to other epochs by the ratio of antennas. Lomb-Scargle periodograms on daily burst counts and on individual burst arrival times, plus an FFT search of the dedispersed time series, constitute the machinery for the periodicity searches. The broken power law carries the cl
What would settle it
Inject simulated bursts into raw data from several other epochs and compare the resulting 90% completeness thresholds with the antenna-scaled values; significant disagreement would weaken the burst-rate evolution and the fitted power-law slopes. Alternatively, a simultaneous two-band detection during a new active phase that shows different break energies or slopes at 400 and 650 MHz would refute the claim of frequency-invariant shape.
Extended reading notes
Core claim
The paper claims that the cumulative energy distribution of bursts from FRB 20220912A is best described by a broken power law in both uGMRT bands: slopes of -0.26±0.06 and -1.79±0.12 at band-3 (400 MHz) and -0.17±0.06 and -1.26±0.05 at band-4 (650 MHz), with the break at similar spectral energies. It further claims that this distribution shape remains broadly the same across a wide frequency range and over several months, despite large variations in burst rate, and that no periodic signal appears either in the activity level or in burst arrival times on short timescales. The authors interpret these results as evidence for intrinsic, persistent emission characteristics shared by active repeat
Load-bearing premise
The completeness thresholds measured on a single night are scaled to every other epoch using only the number of antennas, so any epoch-dependent change in radio-frequency interference, bandpass, or system temperature would bias burst rates and the fitted energy-distribution slopes.
Editorial extensions
If this is right
- If the break in the energy distribution is intrinsic, there are two distinct emission regimes for lower- and higher-energy bursts, analogous to the giant-pulse versus regular-pulse dichotomy seen in some Galactic neutron stars.
- The invariance of the energy distribution shape across frequency and time implies that any successful emission model for hyperactive repeaters must reproduce a universal broken power law with a break near 10^29 erg Hz^-1.
- The extended high activity and the estimated total energy output of roughly 9.6×10^42 erg over 306 days are consistent with a young magnetar with a ~10^15 G surface magnetic field, and rule out scenarios requiring a short-lived energy reservoir.
- The lack of detectable periodicity in burst activity and arrival times argues against simple beamed pulsar-like emission with a stable phase, and favors models where bursts arise over a large range of rotation phases or from magnetospheric reconnection.
- The prolonged quiescence observed after 500 days of activity, similar to FRB 20201124A, suggests that the active phase of a repeating FRB can end abruptly, informing predictions for continued monitoring.
Reading between the lines
- If the broken power law is truly universal among hyperactive repeaters, the break energy may serve as a physical diagnostic of the emission engine, possibly tied to magnetic field strength or emission altitude; this could be tested by comparing break energies across a sample of repeaters with independent distance and DM estimates.
- The completeness scaling by antenna count alone assumes that RFI, bandpass, and system temperature are stable across epochs; a direct test would be to repeat the injection-derived completeness measurement on data from several other epochs and see whether the 90% thresholds agree with the antenna-scaled values.
- The apparent frequency independence of the energy distribution shape suggests that a single emission process operates across at least 300 MHz to 1.5 GHz; simultaneous low- and high-frequency observations during a future active phase could test whether the break energy and slopes remain aligned, or whether chromatic effects appear at the extremes.
- If the source reactivates, measuring the energy distribution early in the new active phase versus late in the previous one would test whether the break and slopes are stable across activity cycles or evolve with the energy reservoir state.
Editorial analysis
A structured set of objections, weighed in public.
Referee Report
Summary. This paper reports a ~two-year uGMRT monitoring campaign of the repeating FRB 20220912A at 300–750 MHz. The authors detect 643 bursts, measure epoch-dependent burst rates after injection-based completeness calibration, and construct cumulative energy distributions in band-3 and band-4. They report that both stacked distributions are best described by a broken power law with slopes (-0.26 ± 0.06, -1.79 ± 0.12) in band-3 and (-0.17 ± 0.06, -1.26 ± 0.05) in band-4, interpret this as evidence for two emission regimes, compare the shape with other active repeaters, search for periodicity (none found), and estimate the total energy budget. The paper concludes that the source behavior favors a young magnetar.
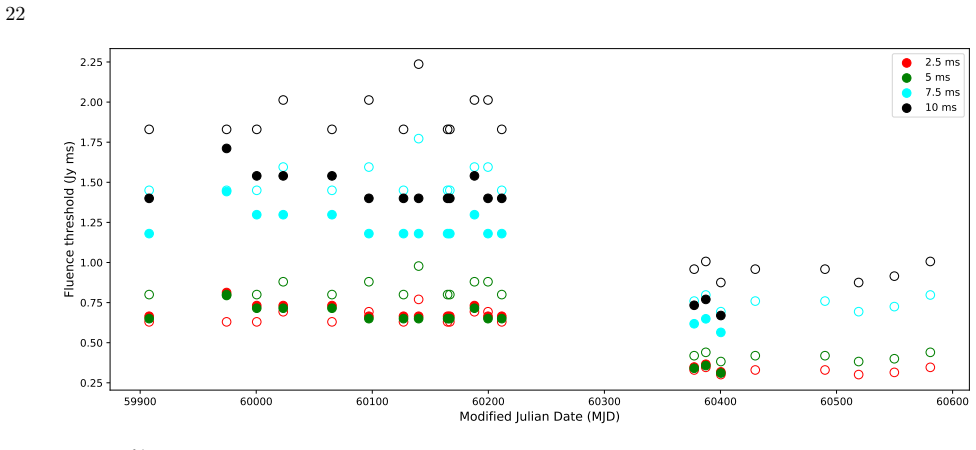
Significance. If the central result survives scrutiny, this is an important data set: it adds the first long-term low-frequency monitoring of a hyperactive repeater and would support the emerging picture of a universal broken energy distribution. The completeness calibration is unusually careful (1250 injections per width per band), the AICC/MCMC procedure is transparent, and the comparison with public CHIME/FAST data is useful. However, the central claim—that the stacked energy distribution is intrinsically broken—is currently not established because the stacking procedure can create a spurious low-energy flattening from epoch-dependent completeness thresholds. The paper's own finding that most individual epochs are single power laws is a red flag that needs to be addressed with a threshold-aware model.
major comments (3)
- [§3.4 and Fig. 5; §3.3 and Fig. 16] The stacked cumulative distribution combines bursts that pass different 90% completeness thresholds per epoch and per width (Fig. 16). In such a mixture, the contribution from an epoch with threshold t_e to N(>F) saturates at its total selected count once F falls below t_e. If the true distribution in every epoch is a single power law, the stacked N(>F) will be flattened at low F relative to the intrinsic slope; the fitted 'broken' power law can therefore arise entirely from threshold heterogeneity. The paper reports that most individual epochs are well fit by a single power law (§3.4); only MJD 59907 (band-3) and MJD 60164 (band-4) prefer a broken law. The claimed break and its relation to FRB 20121102A/20201124A are thus not yet supported. The authors should test the null model (single power law per epoch, with the measured thresholds) by simulation or by a joint likelihood including p
- [§3.3, threshold scaling equation] The thresholds measured on 2022 November 24 are scaled to other epochs solely by the antenna-number ratio N_24nov/N_epoch. This assumes that completeness is determined only by antenna count and that RFI occupancy, bandpass, and system temperature are identical across the campaign. No per-epoch injection validation is presented, so the thresholded samples that feed the burst rates (Fig. 3) and the energy distributions (Fig. 5) may be biased. I recommend injecting simulated bursts in at least a few representative epochs with different RFI/antenna conditions, or using recorded SEFD/RFI metrics, to verify the scaling.
- [§3.4, fitting and model selection] The AICC model comparison is performed on cumulative N(>F) points with Poisson errors. Cumulative points are strongly correlated; treating them as independent under-counts the effective sample size and may favor the extra parameters of the broken power law. The quoted slopes and their MCMC uncertainties are therefore not fully reliable. A fit to the unbinned differential energy distribution (or to independent fluence bins) with a Poisson likelihood would provide a cleaner test of the single versus broken power-law hypothesis.
minor comments (5)
- [Abstract] The abstract spells the source name as 'FRB 202011124A' (extra '1'); the text correctly uses FRB 20201124A.
- [Table 1] The date '30/01/2022 11:13' with MJD 59974 corresponds to 2023 January 30, not 2022.
- [§4.2] The text refers to the 'bottom panel of Figure 7' when discussing mean burst rates; the bottom panel of Figure 7 shows energy distributions, so this should likely be the bottom panel of Figure 3.
- [§3.5.2 and Fig. 6] The text mentions a phase histogram for the '18.8 s' period, while the figure caption and top-right panel label the period as 19.8 s. Please make these consistent.
- [Section 5, bullet 1] The sentence 'if FRB 20220912A from MJD 59905 to MJD 60550' appears grammatically incomplete; this should likely read 'we detected FRB 20220912A from MJD 59905 to MJD 60550'.
Circularity Check
No significant circularity: the uGMRT burst catalog, energy distributions, and comparisons rest on new empirical data, with no load-bearing self-citation or definitional reduction.
full rationale
The paper's central results are derived from the new uGMRT campaign itself: burst detection and dedispersion (§2), completeness thresholds from injected simulated pulses (§3.2), per-epoch fluence thresholds scaled by antenna count with an explicit formula (§3.3), and energy distributions fit by AICC-selected single or broken power laws with MCMC uncertainties (§3.4). The claimed low-energy break is not an input to the fitting procedure; it emerges from the stacked sample and is subsequently compared with independent FAST, GBT, and NRT datasets (§4.1, Fig. 7). The FAST burst-rate extrapolation (§4.4) uses a slope measured from uGMRT data to confront an external measurement, which is the opposite of circular. The energy-budget calculation (§4.3) explicitly labels the magnetar surface field, isotropy, and beaming/efficiency assumptions, so it is a conditional plausibility estimate rather than a derived prediction. Self-citations (RFIClean, PASV, Marthi et al. 2022, Lal et al. 2025, Bhusare et al. 2024) provide software, observing context, or physical analogies; none is used to force the energy-distribution shape, activity conclusions, or periodicity non-detection. The per-epoch completeness scaling and the possible threshold-mixing bias in the stacked distribution are legitimate statistical/calibration concerns, but a bias of that kind would be an error in the measurement, not a definitional equality between the paper's inputs and its conclusions. No load-bearing circular step is present.
Assumptions & free parameters
free parameters (8)
- Power-law slope, band-3 low-energy =
-0.26 ± 0.06
- Power-law slope, band-3 high-energy =
-1.79 ± 0.12
- Power-law slope, band-4 low-energy =
-0.17 ± 0.06
- Power-law slope, band-4 high-energy =
-1.26 ± 0.05
- Break spectral energy, band-3 =
2.9e-29 erg/Hz
- Break spectral energy, band-4 =
3.1e-29 erg/Hz
- Mean burst rates, band-3 and band-4 =
12.4 ± 1.1 hr^-1 and 16.3 ± 1.3 hr^-1
- Total isotropic energy output =
9.6e42 erg
assumptions (6)
- domain assumption 90% completeness thresholds from 2022-11-24 injections apply to all epochs after scaling by antenna count.
- domain assumption Simulated injected bursts with spectral index 0 and zero scattering adequately represent real bursts for completeness calibration.
- domain assumption Isotropic emission and cancellation of beaming fraction with radio efficiency.
- domain assumption DM search range 215–230 pc/cm3 brackets the true DM of the source.
- domain assumption CHIME daily burst counts have no significant downtime bias for periodicity search.
- domain assumption Young magnetar models are viable progenitor scenarios.
Cite this review
Pith. "Pith review of Long-term monitoring of repeating FRB 20220912A with the uGMRT at low radio frequencies." pith.science (2026). https://pith.science/paper/DSYN2QMX
@misc{pith2026251221889,
  author       = {Pith},
  title        = {Pith review of: Long-term monitoring of repeating FRB 20220912A with the uGMRT at low radio frequencies},
  year         = {2026},
  howpublished = {\url{https://pith.science/paper/DSYN2QMX}},
  note         = {Machine review of arXiv:2512.21889}
}
read the original abstract
Some repeating FRBs exhibit occasional extreme repetition rates, but very few show a sustained high activity level. One such hyperactive repeater is FRB 20220912A, which was discovered by CHIME/FRB Collaboration on 2022 September 12. Here, we present results from a long-term monitoring campaign of FRB 20220912A using the upgraded Giant Metrewave Radio Telescope (uGMRT) in the frequency range from 300 to 750 MHz. Over the course of nearly two years, we detected a total of 643 bursts in this frequency range. The source exhibited extreme activity for a few months after its discovery and sustained its active phase for more than 1.5 years, with unsystematic modulations in the activity during this phase. The cumulative energy distributions in both bands show a break, consistent with other active repeaters like FRB 20121102A, FRB 202011124A, etc., suggesting common underlying emission mechanisms. Moreover, we show that the energy distribution shape for FRB 20220912A remains broadly same across a large range of frequencies and over time. Overall, the extended high activity, estimated total energy output, persistent power-law tails in the energy distributions, and the lack of detectable short timescale periodicity favor progenitor models invoking young dynamic magnetars, potentially emitting pulses across large rotation phase ranges.
Figures


Figures from the paper (13 more)


Reference graph
Works this paper leans on
-
[1]
, " * write output.state after.block = add.period write newline
ENTRY address archivePrefix author booktitle chapter doi edition editor eprint howpublished institution journal key month number organization pages publisher school series title misctitle type volume year version url label extra.label sort.label short.list INTEGERS output.state before.all mid.sentence after.sentence after.block FUNCTION init.state.consts ...
-
[2]
write newline
" write newline "" before.all 'output.state := FUNCTION format.url url empty "" new.block "" url * "" * if FUNCTION format.eprint eprint empty "" archivePrefix empty "" archivePrefix "arXiv" = new.block " " eprint * " " * new.block " " eprint * " " * if if if FUNCTION format.doi doi empty "" " " doi * " " * if FUNCTION format.pid doi empty eprint empty ur...
-
[3]
thebibliography [1] 20pt to REFERENCES 6pt =0pt -12pt 10pt plus 3pt =0pt =0pt =1pt plus 1pt =0pt =0pt -12pt =13pt plus 1pt =20pt =13pt plus 1pt \@M =10000 =-1.0em =0pt =0pt 0pt =0pt =1.0em @enumiv\@empty 10000 10000 `\.\@m \@noitemerr \@latex@warning Empty `thebibliography' environment \@ifnextchar \@reference \@latexerr Missing key on reference command E...
arXiv 2021
Reviewed August 3, 2026 · model on record in the stance chip above.
Discussion (0). Continue with ORCID to comment.