REVIEW 3 major objections 4 minor 27 references
Analysis of Stakeholder Involvement in Nuclear Power Plant Cost Overruns and Implications for Contract Structuring
T0 review · 3 major / 4 minor · reviewed 2026-08-04 · deepseek-v4-flash
Pith's one-line read This paper claims that in multi-stakeholder nuclear construction, the share of cost overruns a stakeholder causes often differs sharply from the share they are paid for, producing profit misallocations and litigation under fixed-price, cost
desk verdict Useful stakeholder-attribution framework, but the headline profit deltas rest on an arbitrary normalization of internally inconsistent midpoints. read the letter →
The pith
A machine-rendered reading of the paper's core claim, the machinery that carries it, and where it could break.
The reading
What carries the argument
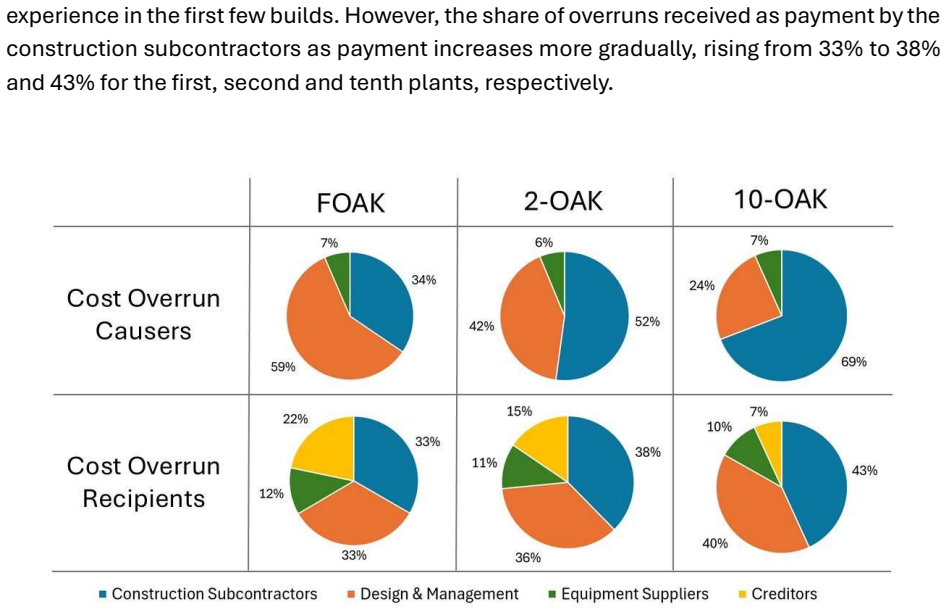
The load-bearing object is the cause-versus-received attribution table, built from a possible-causer matrix over six sources of lost productivity from a 1970s survey of nuclear construction workers. For rework, the model uses rework factors from a cost-reduction tool to split responsibility between construction subcontractors and design/management; for productivity, midpoints of responsibility ranges are normalized to 100%, yielding 43% construction subcontractors, 45% design/management, and 12% equipment suppliers; financing overruns are allocated by turning on each stakeholder's cost and schedule overruns and recomputing compound interest. These shares are then fed into linear and quadrati
What would settle it
Re-run the model with low-productivity responsibility set to the minimum and maximum bounds in the possible-causer matrix (27%/70%, 30%/73%, 0%/28%) instead of the normalized midpoints. If the cause-based versus recipient-based profit deltas shrink to near zero or flip sign, the central mismatch claim fails. Alternatively, compare predicted dispute patterns against actual claims and settlements from recent U.S. nuclear builds: if stakeholders who were overpaid by the model's reckoning are the ones suing, the mechanism is wrong.
Extended reading notes
Core claim
The paper's central claim is that overrun attribution by recipient rather than by causer distorts stakeholder profits and creates avoidable litigation. Using a deterministic cost model of a 1117 MWe reactor design, it decomposes overruns into rework, low construction-site productivity, and related financing costs, then attributes each to stakeholders through mechanistic correlations and a historical survey of lost work hours. Across three contract structures, the profit difference between recipient-based and cause-based allocation is often hundreds of millions of dollars, and for fixed-price contracts can exceed $1.8 billion for a single stakeholder. The authors conclude that cause-based pro
Load-bearing premise
The entire profit-misallocation result depends on the assumed midpoint split of low-productivity responsibility among construction subcontractors, design/management, and equipment suppliers—derived from a single 1970s worker survey whose midpoints summed to 114% and had to be normalized to 100%; if true responsibility sits near the range endpoints instead, the dollar deltas in Table 2 change materially.
Editorial extensions
If this is right
- Fixed-price contracts produce the largest profit deltas between cause-based and recipient-based allocation, so they carry the greatest likelihood of stakeholder lawsuits unless parameters are chosen to flatten the profit-overrun slope.
- Performance-based contracts can eliminate some stakeholders' litigation motive when both caused and received overruns land in the zero-profit region, but unprotected stakeholders still lose enough to sue.
- Cost-plus contracts align incentives among delivery stakeholders but create an incentive to inflate charged costs, shifting conflict to the owner; strong owner oversight becomes essential.
- Milestone preconditions and rolling, time-window-based schedules reduce the chance that one stakeholder's delay is blamed on another.
- Vertical integration or reducing the number of independent stakeholders mitigates the misalignment at its source.
Reading between the lines
- I infer the same causer/payee gap should appear in any fragmented megaproject—transit, offshore wind, large process plants—where one contractor's delay bills through another's work scope, so the contract lesson generalizes beyond nuclear.
- I infer a testable prediction: projects with larger measured gaps between overruns caused and overruns received should exhibit more disputes and claims; dispute-frequency data from past builds could validate or falsify the mechanism.
- I infer the paper's remedy of cause-based allocation quietly depends on a trusted third-party attribution method; absent that, owners may find cause-based clauses hard to administer in practice.
- I infer the excluded regulator is likely a major cause-side actor in unstable regulatory environments, so the modeled gaps may understate real-world litigation pressure.
Editorial analysis
A structured set of objections, weighed in public.
Referee Report
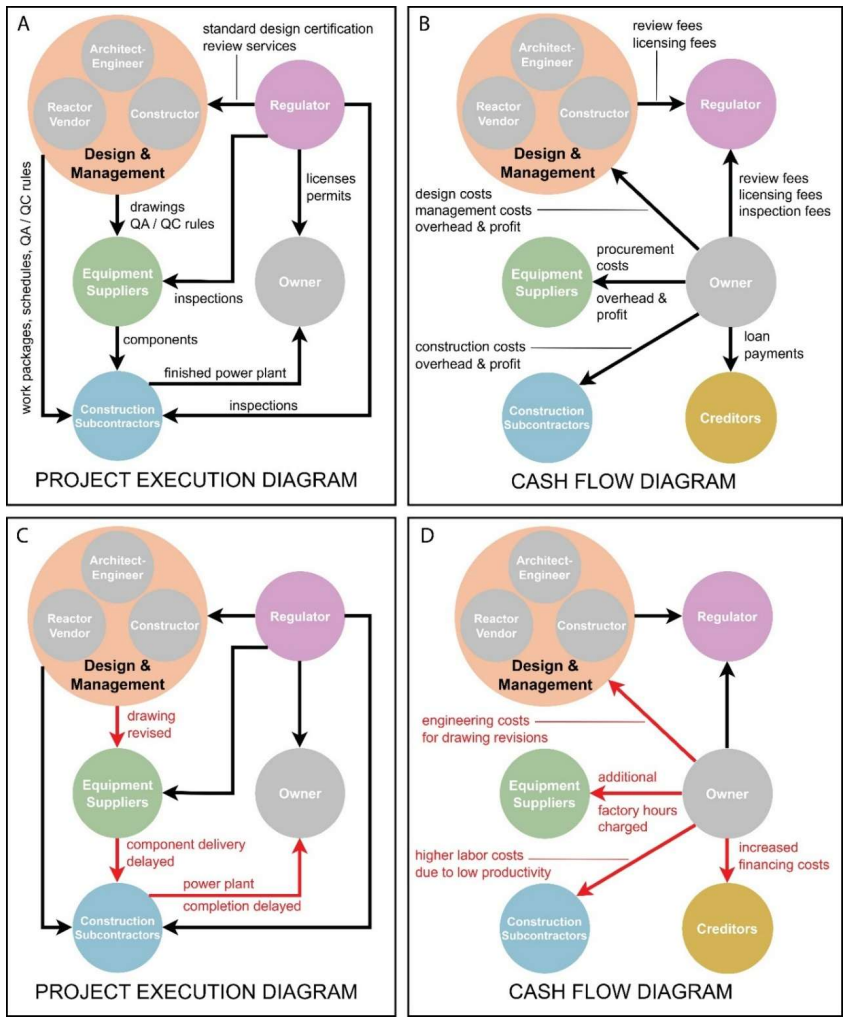
Summary. The paper proposes a framework to decompose nuclear power plant construction cost overruns into shares caused by and received by four stakeholders (construction subcontractors, equipment suppliers, design & management, and creditors). It applies this framework to a simulated program of ten two-unit LPSR (AP1000-like) plants using the DOE Cost Reduction Tool, computes cause-based and recipient-based overrun allocations, and compares profit outcomes under fixed-price, cost-plus, and performance-based contracts. The central claim is that the mismatch between overruns caused and overruns received as payment creates large profit misallocations and litigation risk, motivating recommendations for stronger owner involvement and contract structuring. The paper is transparent about its modeling choices and includes several illustrative examples based on the Vogtle experience.
Significance. If the underlying attribution assumptions were well-grounded, the framework would provide a useful decision-support tool for contract design in large multi-stakeholder construction projects. The paper is commendable for using an open-source, replicable cost model, for clearly distinguishing cause-based from recipient-based allocations, and for spelling out the incentive logic that connects contract structure to litigation risk. The real-world Vogtle and V.C. Summer examples add concreteness. However, the quantitative results are not robust to the subjective and partly incoherent attribution choices in the low-productivity calculation, which is a major overrun category. Because the paper draws practical recommendations on the basis of those numbers, the numerical claims need significant revision or reframing.
major comments (3)
- [Methods, Low Productivity, Table 4] The min/max responsibility ranges are computed category-wise and are not jointly achievable: a stakeholder's minimum is the sum of categories where they are the sole possible causer, and the maximum is the sum of all categories where they are a possible causer. The maxima sum to 171% and the minima to 57%, so the arithmetic mean of these infeasible bounds is not a coherent central estimate. Normalizing the resulting 114% total to 100% silently changes the relative shares, producing the 43/45/12 split without any probabilistic or decision-theoretic justification. Since low productivity is one of the two largest overrun categories (Figure 3A), every cause-based overrun share and therefore every profit delta in Table 2 inherits this arbitrariness. The paper acknowledges the survey is dated but not that the midpoint method is internally inconsistent. Please provide a coherent joint attributi
- [Results, Table 2] The profit deltas are not inferred from independent data but are constructed from the paper's own allocation choices on both sides: recipient shares come from EEDB account proportions, cause shares come from the subjective possible-causer matrix and normalized midpoints, and the contract terms are hypothetical. The 'stark difference' between caused and received shares is therefore true by construction. The paper should present Table 2 and the associated claims in the Discussion ('profit misallocations on the order of hundreds of millions to billions of dollars') as an illustrative scenario, not as an empirical estimate, or provide external validation. Without such framing, the central numeric result is not load-bearing evidence for the policy recommendations.
- [Supplemental Methods, Financing] The 4% financing rate is back-calculated by matching the model's output to Vogtle's reported $18,500/kWe TCI given the modeled OCC and durations. This same rate is then used in Equations S3–S6 to compute financing overruns that are attributed to stakeholders via Equation 8. The calibration target is thus the very quantity the model is used to explain, and the resulting financing overrun shares are not independently constrained. Add a sensitivity analysis over r (e.g., 2–6%) and discuss how Figure 3A and Table 2 change. As written, the financing-related conclusions rest on a single calibrated parameter with no uncertainty bound.
minor comments (4)
- [Abstract] The abstract in the submission says 'five stakeholders' while the full-text abstract and the Introduction say 'four key stakeholders,' omitting the regulator. Use consistent counts and clarify that the regulator is excluded from the quantitative analysis.
- [Methods, Equation 7] Equation 7 is labeled as a percentage share but the notation '(% ΔC_fin)_i' mixes a percent sign with a definition that is a fraction. Make the notation consistent, e.g., define the share as a fraction and convert to percent only in display.
- [Table 4] The table would benefit from a footnote explaining that the min/max ranges are not jointly achievable and that the midpoint is a heuristic. At present the normalization step appears as an afterthought rather than a limitation.
- [Results, Figure 6(B)] The caption states 'Light green is used to indicate the outcome if profits are allocated based on the overruns the Equipment Suppliers caused (~$543M), while red indicates the outcome if profits are tied to overruns the Equipment Suppliers received as payment (~$954M).' This is clear, but the text in Section 3.3 says 'approximately $486 million' for the recipient-based profit while the figure appears to show a different number; please reconcile.
Circularity Check
Low-productivity causer shares are the paper's own assumed midpoints relabeled as estimates; Table 2 profit deltas are thereby forced by construction.
-
fitted input called prediction
[Methods, 'Low Productivity' (Tables 3-4, Equation 6); Results, Figure 3(C) and Table 2]
"Minimum Possible Responsibility 27% 30% 0% ... Maximum Possible Responsibility 70% 73% 28% ... Midpoint 49% 51% 14% 114% ... Midpoint (Normalized to 100%) 43% 45% 12% 100% ... Since we do not know exactly where each stakeholder falls within their potential range of responsibility for low productivity, we simply assume the midpoint value ... Once each stakeholder’s midpoint responsibility for non-rework unproductive hours was determined, their corresponding share of responsibility for productivity-related overruns was calculated using Equation 6: ΔC_lp,i = ΔC_lp,total × f_lp,i."
The 'estimated' low-productivity cause shares are the assumed normalized midpoints (43%/45%/12%) from Table 4 inserted into Equation 6; the output ΔC_lp,i is just the total overrun times that assumed vector. These assumed shares are then presented in Figure 3(C) as 'cost overruns by causer' and feed Figure 5 and Table 2's profit deltas. The min/max ranges are not jointly feasible (the maxima sum to 171% and minima to 57%), so the midpoint is not a well-defined central estimate; the 114% total has to be normalized to 100%, silently changing relative shares. The cause-vs-received mismatch is therefore not an independent empirical finding but a relabeling of the midpoint assumption, partially forcing the paper's headline profit misallocations.
full rationale
The paper's conceptual distinction between overruns caused and overruns received is analytically coherent and not circular by itself: recipient shares come from EEDB account proportions, rework is split by the Cost Reduction Tool's standalone rework factors, and financing formulas are explicitly stated. The circular step is concentrated in the low-productivity causer attribution. Table 4 builds an author-constructed possible-causer matrix, derives per-stakeholder minima and maxima that cannot be jointly attained, takes their arithmetic midpoints, and normalizes the resulting 114% total to 100%. Equation 6 then defines each stakeholder's low-productivity cost overrun as the total low-productivity overrun multiplied by this assumed normalized midpoint vector. Thus the causer shares in Figure 3(C) are the inputs themselves, renamed as 'estimated' cause shares; because low productivity is one of the two largest overrun categories, the cause-vs-received mismatches and Table 2 profit deltas are substantially forced by this assumption. The paper is transparent that the midpoint is assumed and notes that other sensitivities may be examined, but transparency does not make the quantity an inference. The reliance on the authors' own Cost Reduction Tool is not separately flagged as circular because the tool is open-source, deterministic, and its assumptions are stated; the circularity is the midpoint-to-cause-share identity, not the self-citation itself.
Assumptions & free parameters
free parameters (4)
- Financing rate r =
4%
- FOAK LPSR cost/schedule calibration =
OCC ~ $15,000/kWe; construction + startup ~119 months
- Low-productivity responsibility midpoints =
Construction 43%, Design & Management 45%, Equipment 12%
- Illustrative contract parameters =
30% contingency, 8% margin at 30% overrun, 0% at 60%, etc.
assumptions (7)
- domain assumption EEDB PWR12-ME indirect-cost proportions (Account 91 = 30.6%, Accounts 92+93 = 69.4%) remain valid for modern LPSR/AP1000-style projects.
- domain assumption The regulator causes zero cost overruns in the modeled scenarios.
- domain assumption The 1970s survey distribution of non-rework unproductive hours is representative across modern nuclear projects.
- domain assumption The timing of each stakeholder's schedule-causing overruns is uniformly random over the construction period.
- domain assumption Supply-chain delay schedule overruns are caused entirely by Equipment Suppliers.
- domain assumption A 'well-executed' project with zero rework and maximum productivity is the correct baseline for defining overruns.
- standard math Standard interest-during-construction mathematics (sinusoidal spend curve, compounding) applies to project financing.
invented entities (1)
-
Design & Management aggregate stakeholder
Cite this review
Pith. "Pith review of Analysis of Stakeholder Involvement in Nuclear Power Plant Cost Overruns and Implications for Contract Structuring." pith.science (2026). https://pith.science/paper/BMQ5BCIC
@misc{pith2026260114558,
  author       = {Pith},
  title        = {Pith review of: Analysis of Stakeholder Involvement in Nuclear Power Plant Cost Overruns and Implications for Contract Structuring},
  year         = {2026},
  howpublished = {\url{https://pith.science/paper/BMQ5BCIC}},
  note         = {Machine review of arXiv:2601.14558}
}
read the original abstract
Existing evidence on nuclear power plant construction suggests that individual stakeholders involved in project delivery are often not responsible for all of the cost overruns in their scope of the project, which can lead to costly and time-consuming litigation to determine who is truly at fault for overruns. This study introduces a framework to model the share of overruns caused and received as payment by five stakeholders in a nuclear construction project: equipment suppliers, construction subcontractors, the design and management team, creditors, and the nuclear regulator. We then perform a contract analysis under three common contract structures - fixed-price, cost-plus, and performance-based - to show the profit misallocations that can result, revealing the advantages and disadvantages of each contract type for aligning stakeholder incentives. Regardless of the contract type chosen, strong owner involvement is crucial for project success, and we conclude with specific recommendations for project owners seeking to minimize cost overruns.
Figures

Figures from the paper (5 more)


Reference graph
Works this paper leans on
-
[1]
W. R. Stewart and K. Shirvan, Capital Cost Evaluation of Advanced Reactor Designs Under Uncertainty and Risk, Department of Nuclear Science and Engineering, Massachusetts Institute of Technology, 2022
2022
-
[2]
The Future of Nuclear Energy in a Carbon -Constrained World,
Massachusetts Institute of Technology, "The Future of Nuclear Energy in a Carbon -Constrained World," MIT Energy Initiative, Cambridge, 2018
2018
-
[3]
Sources of Cost Overrun in Nuclear Power Plant Construction Call for a New Approach to Engineering Design,
P. Eash-Gates, M. M. Klemun, G. Kavlak, J. McNerney, J. Buongiorno and J. E. Tranick, "Sources of Cost Overrun in Nuclear Power Plant Construction Call for a New Approach to Engineering Design," Joule, vol. 4, no. 11, pp. 2348-2373, 2020
2020
-
[4]
Phase IX Update (1987) Report for the Energy Economic Data Base Program,
United Engineers & Constructors, Inc., "Phase IX Update (1987) Report for the Energy Economic Data Base Program," U.S. Department of Energy, 1988
1987
-
[5]
Power Plant Cost Escalation: Nuclear and Coal Capital Costs, Regulation, and Economics,
C. Komanoff, "Power Plant Cost Escalation: Nuclear and Coal Capital Costs, Regulation, and Economics," Van Nostrand Reinhold Company Inc., New York, 1981
1981
-
[6]
An Analysis of Nuclear Power Plant Construction Costs,
U.S. Energy Information Administration (EIA), "An Analysis of Nuclear Power Plant Construction Costs," U.S. Department of Energy, 1985
1985
-
[7]
Analysis of Nuclear Power Construction Costs,
G. L. Jansma and J. D. Borcherding, "Analysis of Nuclear Power Construction Costs," in AACE Transactions, 1988
1988
-
[8]
The Successful Delivery of Megaprojects: A Novel Research Method,
G. Locatelli, M. Mikic, M. Kovacevic, N. Brookes and N. Ivanisevic, "The Successful Delivery of Megaprojects: A Novel Research Method," Project Management Journal, vol. 48, no. 5, pp. 78-94, 2017
2017
Show all 27 references
-
[9]
Why are Megaprojects, Including Nuclear Power Plants, Delivered Overbudget and Late? Reasons and Remedies,
G. Locatelli, "Why are Megaprojects, Including Nuclear Power Plants, Delivered Overbudget and Late? Reasons and Remedies," Center for Advanced Nuclear Energy Systems (CANES), Massachusetts Institute of Technology, Cambridge, MA, 2018
2018
-
[10]
Quantifying Capital Cost Reduction Pathways for Advanced Nuclear Reactors,
C. Bolisetti, A. Abou-Jaoude, B. Hanna, L. M. Larsen, J. Zhou and K. Shirvan, "Quantifying Capital Cost Reduction Pathways for Advanced Nuclear Reactors," Idaho National Laboratory, 2024
2024
-
[11]
Potential Cost Reduction in New Nuclear Deployments Based on Recent AP1000 Experience,
R. Spangler, S. Qin, L. M. Larsen, C. Bolisetti, A. Abou -Jaoude, M. Asgari, K. Shirvan, W. R. Stewart, J. Krellenstein and G. Wilkinson, "Potential Cost Reduction in New Nuclear Deployments Based on Recent AP1000 Experience," Idaho National Laboratory, 2025
2025
-
[12]
Capital cost estimation for advanced nuclear power plants,
W. Stewart and K. Shirvan, "Capital cost estimation for advanced nuclear power plants," Renewable and Sustainable Energy Reviews
-
[13]
Construction schedule and cost risk for large and small light water reactors,
W. Stewart and K. Shirvan, "Construction schedule and cost risk for large and small light water reactors," Nuclear Engineering and Design, 2023
2023
-
[14]
Why Does Nuclear Power Plant Construction Cost So Much?,
B. Potter, "Why Does Nuclear Power Plant Construction Cost So Much?," Institute for Progress, 2023
2023
-
[15]
Will Claims By Contractors on Big Design -Build Projects Ever End?,
R. Korman, "Will Claims By Contractors on Big Design -Build Projects Ever End?," 2023. 31
2023
-
[16]
Plant Vogtle's contractors sue Georgia Power, project's co -owners,
K. E. Swartz, "Plant Vogtle's contractors sue Georgia Power, project's co -owners," 2012
2012
-
[17]
V.C. Summer Nuclear Generating Station Units 2 & 3 Project Assessment Report,
Bechtel Corporation, "V.C. Summer Nuclear Generating Station Units 2 & 3 Project Assessment Report," 2015
2015
-
[18]
Exhibit (K_P -2): Bechtel Report Issues as Discussed in Prior Quarterly Reports and Testimony and in Correspondence From and With ORS,
South Carolina Public Service Commission, "Exhibit (K_P -2): Bechtel Report Issues as Discussed in Prior Quarterly Reports and Testimony and in Correspondence From and With ORS," 2018
2018
-
[19]
Schedule-Based Construction Incentives,
S. F. Abu-Hijleh and C. W. Ibbs, "Schedule-Based Construction Incentives," Journal of Construction Engineering and Management, vol. 115, no. 3, pp. 339-486, 1989
1989
-
[20]
Flyvbjerg and D
B. Flyvbjerg and D. Gardner, How Big Things Get Done: The Surprising Factors That Determine the Fate of Every Project, from Home Renovations to Space Exploration and Everything In Between, McClelland & Stewart, 2023
2023
-
[21]
2024 Total Cost Projection of Next AP1000,
K. Shirvan, "2024 Total Cost Projection of Next AP1000," Center for Advanced Nuclear Energy Systems (CANES), Cambridge, MA, 2024
2024
-
[22]
Pathways to Commercial Liftoff: Advanced Nuclear,
U.S. Department of Energy, "Pathways to Commercial Liftoff: Advanced Nuclear," 2024
2024
-
[23]
Analysis of GW-Scale Overnight Capital Costs,
R. Rosner and S. Goldberg, "Analysis of GW-Scale Overnight Capital Costs," Energy Policy Institute at Chicago (EPIC), University of Chicago, 2011
2011
-
[24]
Laying the Foundation for New and Advanced Nuclear Reactors in the United States,
National Academies of Sciences, Engineering, and Medicine, "Laying the Foundation for New and Advanced Nuclear Reactors in the United States," Washington, DC, The National Academies Press, 2023
2023
-
[25]
A Generalized Nuclear Code of Accounts for Cost Estimation Standardization,
D. Moneghan, A. Abou-Jaoude, C. Bolisetti, I. Trivedi, D. Lutchenkov, P. Ayerle and R. Langhans, "A Generalized Nuclear Code of Accounts for Cost Estimation Standardization," Electric Power Research Institute; Idaho National Laboratory, 2024
2024
-
[26]
Technical Reference Book for the Energy Economic Data Base Program,
United Engineers and Constructors Inc., "Technical Reference Book for the Energy Economic Data Base Program," U.S. Department of Energy, 1984
1984
-
[27]
Major Factors Influencing Craft Productivity in Nuclear Power Plant Construction,
S. J. Sebastian and J. D. Borcherding, "Major Factors Influencing Craft Productivity in Nuclear Power Plant Construction," Transactions of the American Association of Cost Engineers, 1980. Funding Acknowledgement This material is based upon work funded by the U.S. Department o...
1980
Reviewed August 4, 2026 · model on record in the stance chip above.
Discussion (0). Continue with ORCID to comment.