pith. machine review for the scientific record. sign in

arxiv: 2601.18338 · v2 · submitted 2026-01-26 · ⚛️ physics.ins-det

Recognition: 1 theorem link

· Lean Theorem

Precision Light Yield and Crosstalk Characterization for the SuperFGD scintillator cubes

Authors on Pith no claims yet

Pith reviewed 2026-05-16 11:15 UTC · model grok-4.3

classification ⚛️ physics.ins-det
keywords scintillator cubeslight yieldoptical crosstalkSuperFGDT2K ND280SiPMWLS fiberspion beam test
0
0 comments X

The pith

A 5x5x5 scintillator cube prototype shows spatially uniform light yield and 2-6% optical crosstalk when read out by WLS fibers and SiPMs.

A machine-rendered reading of the paper's core claim, the machinery that carries it, and where it could break.

The paper reports precision measurements on a small SuperFGD prototype exposed to a 730 MeV/c pion beam. Light yield was mapped at 0.5 mm steps across 27 cubes by combining tracking data, revealing good spatial uniformity. Crosstalk to neighboring cubes was measured in four directions and found to range from 2% to 6%, peaking near the interfaces. A simple Monte Carlo model reproduces both the uniformity map and the crosstalk values. These results are presented as evidence that the cube design can be scaled to the full ND280 upgrade without major optical problems.

Core claim

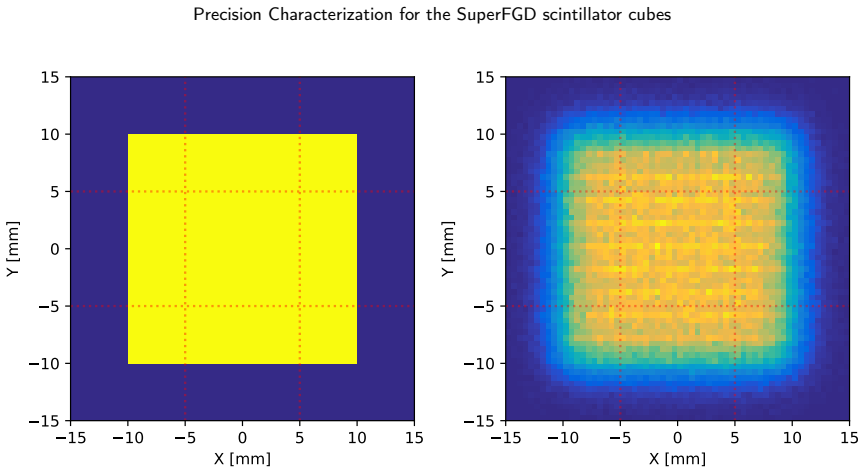
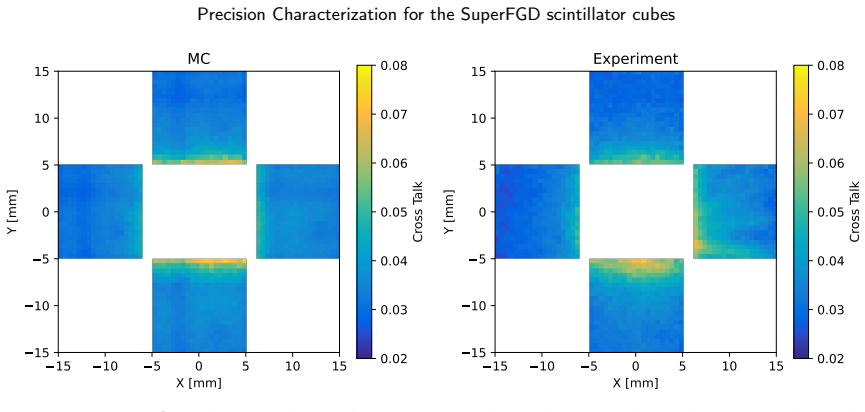
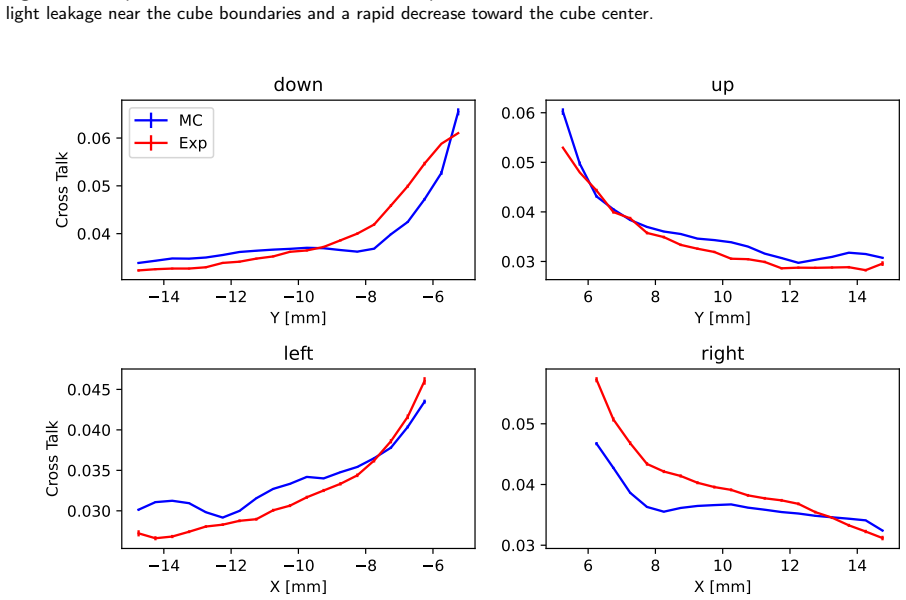
High-resolution beam data establish that the average light response across the 5x5x5 array is uniform at the few-percent level while optical crosstalk between adjacent cubes remains between 2% and 6% in a position-dependent manner, with both quantities reasonably well described by a basic Monte Carlo simulation of the optical setup.

What carries the argument

Orthogonal wavelength-shifting fiber readout inside plastic scintillator cubes, which collects and transports scintillation photons to SiPMs while limiting light leakage to neighboring cubes.

If this is right

  • Uniform light yield supports three-dimensional charged-particle tracking with position resolution set by the 1 cm cube size.
  • Crosstalk levels of a few percent allow energy deposited in one cube to be assigned with limited contamination from neighbors.
  • The simple MC model can be used to tune simulation and reconstruction codes for the ND280 upgrade.
  • Position-dependent crosstalk maps provide input for correcting edge effects in event reconstruction.

Where Pith is reading between the lines

These are editorial extensions of the paper, not claims the author makes directly.

  • If the uniformity holds at full scale, reconstruction algorithms could achieve better particle identification than current T2K near-detector performance.
  • The measured crosstalk values suggest that interface polishing or reflective coatings may be the dominant variables for further reduction.
  • Similar cube geometries with WLS readout could be evaluated for other fine-grained neutrino or dark-matter detectors that require low channel-to-channel optical coupling.

Load-bearing premise

The optical and light-collection behavior observed in the 5x5x5 prototype with 730 MeV/c pions is representative of the full-scale SuperFGD inside the T2K ND280 detector.

What would settle it

A full-scale module measurement showing light-yield variations larger than 10% across individual cubes or average crosstalk exceeding 10% would falsify the claim that the prototype performance scales directly.

Figures

Figures reproduced from arXiv: 2601.18338 by A. Chvirova, A. Khotjantsev, A. Krapiva, A. Mefodiev, D. Novinsky, D. Svirida, E. Samigullin, I. Alekseev, M. Danilov, M. Kolupanova, N. Kozlenko, N. Skrobova, O. Mineev, S. Fedotov, Y. Kudenko.

Figure 1
Figure 1. Figure 1: Left: readout of 27 WLS fibers by the digitizer; inactive fibers are not shown. Right: top view of the full test setup. 4. Experimental setup The prototype for beam test was assembled as 5× 5× 5 array of the cubes covered by an outer protective shell made of thin, hard material. A total of 75 WLS fibers were installed through the holes of the cubes. The fibers were 1-mm diameter Y11(200) Kuraray S-type, ea… view at source ↗
Figure 2
Figure 2. Figure 2: Test setup at the pion beam line 1 of the PNPI synchrocyclotron. 5. Signal waveform analysis In this section, we describe the procedure for reconstructing key signal parameters from the digitized SiPM waveforms recorded in the SuperFGD prototype. The waveforms contain detailed information about the light signals produced in scintillator cubes, and allow for precise extraction of observables such as light y… view at source ↗
Figure 3
Figure 3. Figure 3: Examples of digitized SiPM signals. Left: clean single pulse. Right: waveform with afterpulsing or pile up with accidentals. 0 20 40 60 80 100 120 ADC 0 100 200 300 400 500 600 700 800 ADC 1 10 2 10 3 10 4 10 N 0 20 40 60 80 100 120 ADC 0 100 200 300 400 500 600 700 800 ADC 1 10 2 10 3 10 4 10 N [PITH_FULL_IMAGE:figures/full_fig_p005_3.png] view at source ↗
Figure 4
Figure 4. Figure 4: Left: Amplitude vs. integrated charge for calibration events. The diagonal band corresponds to clean single pulses. Right: Off-diagonal events are rejected. • par[0] – amplitude, • par[2] – pulse start time, • par[4] – baseline. Examples of waveform fits are shown in Fig.6. Saturated parts of the waveform were excluded from the fit. To assess the fit performance, the fitted amplitude 𝐴fit was compared with… view at source ↗
Figure 5
Figure 5. Figure 5: Left: Amplitude vs. integrated charge for beam-triggered events. Right: A looser selection is applied. hWaveForm__15 p0 2165 p1 3.879 p2 21.4 p3 1.63 p4 4.894 0 10 20 30 40 50 60 t, [8ns] 0 500 1000 1500 2000 ADC hWaveForm__15 p0 2165 p1 3.879 p2 21.4 p3 1.63 p4 4.894 hWaveForm__9 p0 4346 p1 9.33 p2 18.8 p3 1.025 p4 10.13 0 10 20 30 40 50 60 t, [8ns] 0 500 1000 1500 2000 2500 3000 3500 4000 4500 ADC hWaveF… view at source ↗
Figure 6
Figure 6. Figure 6: Waveform fit examples. Left: standard signal. Right: saturated signal with excluded overflow region. In this section, we describe the procedure used to extract the SiPM gain and optical crosstalk probability from waveform data. The calibration was based on the analysis of dark noise signals collected during dedicated runs without beam. By studying the distribution of signal amplitudes and integrated charge… view at source ↗
Figure 7
Figure 7. Figure 7: Relative difference between fitted and measured peak amplitudes: (𝐴fit − 𝐴)∕𝐴 for non-saturated signals. 0 20 40 60 80 100 120 140 Amplitude [ADC] 0 500 1000 1500 2000 2500 3000 3500 Number 1 1.5 2 2.5 3 3.5 4 Peak number 20 30 40 50 60 70 80 ADC channels / ndf 2 χ 0.01677 / 2 p0 19.85 ± 0.5609 p1 −0.03274 ± 1.126 / ndf 2 χ 0.01677 / 2 p0 19.85 ± 0.5609 p1 −0.03274 ± 1.126 [PITH_FULL_IMAGE:figures/full_fi… view at source ↗
Figure 8
Figure 8. Figure 8: Peak amplitude distribution from SiPM dark noise signals: (left) raw data including background; (right) the distances between adjacent peaks were then fitted with a linear function, and the slope was interpreted as the SiPM gain . where 𝐴 is the average signal amplitude, 𝐴pedestal is the pedestal level, and 𝐴1pe is the mean position of the first p.e. peak. This estimate assumes that the mean signal amplitu… view at source ↗
Figure 9
Figure 9. Figure 9: Reconstructed hit position maps for cubes 0, 5, and 26 in the (𝑋, 𝑌 ) plane. The maps show event densities based on the pion track reconstruction. For each cube, an event map was constructed by selecting events in which all three associated readout channels (X, Y, and Z) registered signals above a threshold of 5 photoelectrons to suppress electronic noise and reduce contributions from low-energy background… view at source ↗
Figure 10
Figure 10. Figure 10: Light yield distributions for cubes connected to channel 6 (left), channel 21 (center), and all channels combined (right). The variation is primarily attributed to fiber-SiPM coupling differences. where 𝑅fit = 1.013 was obtained from the residual difference between real and fitted amplitudes (see Section 5). During the analysis, we observed notable variations in light yield between different channels. The… view at source ↗
Figure 11
Figure 11. Figure 11: Left: position-dependent light yield obtained from the sum of 𝑋 and 𝑌 fiber signals for a 3 × 3 cube region. Right: example of a light yield distribution in a single spatial bin, fitted with a Gaussian function. −30 −20 −10 0 10 20 X[mm] −20 −10 0 10 20 30 Y[mm] 35 40 45 50 55 LY (X) [p.e.] / ndf 2 χ 34.07 / 35 Constant13.35 ± 1.10 Mean 53.67 ± 1.01 Sigma 15.08 ± 0.87 0 20 40 60 80 100 120 140 160 LY [p.e… view at source ↗
Figure 12
Figure 12. Figure 12: Left: position-dependent light yield from 𝑋-oriented fibers only. Right: example of a Gaussian fit to the light yield distribution in a single bin. Figures 12 and 13 illustrate the light yield distributions obtained using signals from the 𝑋 and 𝑌 fibers, respectively. In both cases, a spatial asymmetry is observed: the light yield increases as the particle track approaches the corresponding fiber axis. Sp… view at source ↗
Figure 13
Figure 13. Figure 13: Left: position-dependent light yield from 𝑌 -oriented fibers only. Right: example of a Gaussian fit to the light yield distribution in a single bin. algorithms and simulation tuning, especially when evaluating energy resolution and response linearity at the cube level. 10. Average Light Yield Distribution Across Multiple Cubes To characterize the typical light collection behavior of a scintillator cube in… view at source ↗
Figure 14
Figure 14. Figure 14: Light yield maps averaged over 27 cubes. Left: combined 𝑋 + 𝑌 fiber signals; middle: 𝑋 fiber only; right: 𝑌 fiber only. Bin size is 0.5 mm. The features at 𝑥 ∈ [7, 9] mm, 𝑦 ∈ [1, 3] mm correspond to the presence of the 𝑍-oriented fiber, leading to a localized reduction in light collection. 11. Consistency Check of Cube Alignment via Light Yield Maps To verify the geometric alignment and consistency of sci… view at source ↗
Figure 15
Figure 15. Figure 15: 1D projections of light yield from 𝑋 fibers along the 𝑋 direction (left) and from 𝑌 fibers along the 𝑌 direction (right). The red line shows the average over all cubes; blue lines show individual fiber responses. In this section, we present a detailed study of the optical crosstalk as a function of the track position within a cube and the orientation of the readout fiber. The analysis is based on events w… view at source ↗
Figure 16
Figure 16. Figure 16 [PITH_FULL_IMAGE:figures/full_fig_p014_16.png] view at source ↗
Figure 17
Figure 17. Figure 17: 2D maps of average crosstalk for right (right panel) and left (left panel) neighbor cubes. The color scale indicates mean of the distribution for each bin. Similarly, [PITH_FULL_IMAGE:figures/full_fig_p014_17.png] view at source ↗
Figure 18
Figure 18. Figure 18: 2D maps of average crosstalk for up (left panel) and down (right panel) neighbor cubes. −10 −5 0 5 10 X[mm] 0 0.01 0.02 0.03 0.04 0.05 0.06 0.07 0.08 0.09 0.1 CrossTalk 0 5 10 15 20 X[mm] 0 0.01 0.02 0.03 0.04 0.05 0.06 0.07 0.08 0.09 0.1 CrossTalk [PITH_FULL_IMAGE:figures/full_fig_p015_18.png] view at source ↗
Figure 19
Figure 19. Figure 19: One-dimensional crosstalk profiles for left (left panel) and right (right panel) neighbor cubes. The 𝑋-axis indicates the distance from the cube boundary. These 1D profiles complement the 2D maps presented in Figures 17 and 18. The key difference is that each bin in the 1D profiles contains roughly 10 times more events than a bin in the corresponding 2D maps, resulting in smoother and statistically more r… view at source ↗
Figure 20
Figure 20. Figure 20: One-dimensional crosstalk profiles for up (left panel) and down (right panel) neighbor cubes. The 𝑋-axis indicates the distance from the cube boundary. 13. Monte Carlo Simulation and Comparison with Data To complement the experimental measurements and support the interpretation of detector response, a dedicated Monte Carlo simulation of the SuperFGD prototype was developed. The simulation reproduces the g… view at source ↗
Figure 21
Figure 21. Figure 21: Track distribution before (left) and after (right) applying proportional chamber reconstruction resolution. 4 2 0 2 4 X [mm] 4 2 0 2 4 Y [mm] Front view 4 2 0 2 4 Z [mm] 4 2 0 2 4 Y [mm] Left view 4 2 0 2 4 X [mm] 4 2 0 2 4 Z [mm] Bottom view [PITH_FULL_IMAGE:figures/full_fig_p017_21.png] view at source ↗
Figure 22
Figure 22. Figure 22: Example of photon propagation inside a cube. 13.2. Optical Properties Surface interactions were modeled using the GLISUR micro-facet model. In this approach, surface roughness is parameterized by a “polish” value in the range [0,1]. • Cube walls were modeled with diffuse reflections (polish = 0.0), with a constant reflectivity of 0.96. • Hole and fiber surfaces were modeled as polished (polish = 1.0). The… view at source ↗
Figure 23
Figure 23. Figure 23: Comparison of light yield maps for the 𝑋-fiber: (left) simulated LY for the central cube, (right) experimental average LY,. 13.3. SiPM Response The SiPM response was not explicitly simulated. Instead, photons captured by fibers were converted into p.e. equivalents using a global calibration coefficient. This coefficient provided correspondence between MC photon counts (“MC units”) and experimentally measu… view at source ↗
Figure 24
Figure 24. Figure 24: Comparison of one-dimensional LY profiles between data (red) and MC simulation (blue). Left column: profiles along the 𝑥-axis (bottom, middle, top regions). Right column: profiles along the 𝑦-axis (left, middle, right regions). 13.5. Crosstalk Maps: Simulation vs Data A similar procedure was applied to evaluate the optical crosstalk using the Monte Carlo simulation. Crosstalk maps were constructed from MC… view at source ↗
Figure 25
Figure 25. Figure 25: Comparison of two-dimensional crosstalk maps between data and Monte Carlo simulation. Both show enhanced light leakage near the cube boundaries and a rapid decrease toward the cube center. 14 12 10 8 6 Y [mm] 0.04 0.05 0.06 Cross Talk down MC Exp 6 8 10 12 14 Y [mm] 0.03 0.04 0.05 0.06 up 14 12 10 8 6 X [mm] 0.030 0.035 0.040 0.045 Cross Talk left 6 8 10 12 14 X [mm] 0.03 0.04 0.05 right [PITH_FULL_IMAGE… view at source ↗
Figure 26
Figure 26. Figure 26: Comparison of one-dimensional crosstalk profiles for down (top left), up (top right), left (bottom left), and right (bottom right) neighboring cubes. The 𝑋-axis indicates the distance from the cube boundary. Experimental data (red) and Monte Carlo simulation (blue). demonstrate overall consistency between data and simulation. The main trends – peak crosstalk near the boundaries (5–7%) and smooth falloff t… view at source ↗
read the original abstract

A detailed study of a $5\times5\times5$ cube prototype of the SuperFGD detector was performed using a 730 MeV/$c$ pion beam at the SC-1000 synchrocyclotron (PNPI, Gatchina, Russia). The detector, based on plastic scintillation cubes with orthogonal wavelength-shifting (WLS) fiber readout and silicon photomultipliers (SiPMs), was tested to evaluate its performance in terms of light yield, spatial uniformity, and optical crosstalk. Using high-resolution tracking, the spatial distribution of light yield was mapped with a granularity of 0.5 mm. An average light response map was obtained by combining data from 27 cubes. Optical crosstalk between adjacent cubes was also measured and characterized in four directions (left, right, up, down). Position-dependent crosstalk values ranged from 2% to 6%, with the highest levels observed near cube interfaces. These results confirm the excellent performance and scalability of the SuperFGD design, and provide valuable input for simulation tuning and reconstruction algorithms in the ND280 upgrade of the T2K experiment. The obtained result on the response uniformity and crosstalk are reasonably well described by simple MC model of the setup.

Editorial analysis

A structured set of objections, weighed in public.

Desk editor's note, referee report, simulated authors' rebuttal, and a circularity audit. Tearing a paper down is the easy half of reading it; the pith above is the substance, this is the friction.

Referee Report

2 major / 1 minor

Summary. The paper reports beam-test results from a 5×5×5 SuperFGD scintillator-cube prototype exposed to 730 MeV/c pions. High-resolution tracking is used to produce light-yield uniformity maps at 0.5 mm granularity by averaging data from 27 cubes; optical crosstalk is measured in four directions and found to range from 2 % to 6 %, highest near cube interfaces. The authors state that these observables are reasonably well described by a simple Monte Carlo model of the setup and conclude that the results confirm the excellent performance and scalability of the SuperFGD design for the T2K ND280 upgrade.

Significance. If the reported uniformity and crosstalk values hold, the work supplies useful empirical input for simulation tuning and reconstruction development in the ND280 upgrade. The high-granularity mapping is a clear experimental strength; however, the significance is reduced by the absence of quantitative MC-data comparison metrics and by the untested extrapolation from the isolated 5×5×5 prototype to full-scale ND280 optical boundary conditions.

major comments (2)
  1. [Abstract] Abstract: the claim that the uniformity and crosstalk results 'are reasonably well described by simple MC model' is presented without any quantitative metrics (e.g., χ², residuals, or percentage deviations) in the results or discussion sections, preventing assessment of the model's actual fidelity.
  2. [Conclusions] Conclusions: the assertion that the 5×5×5 prototype results 'confirm ... scalability' of the SuperFGD design for ND280 relies on the untested assumption that light-yield maps and 2–6 % crosstalk measured in an isolated small assembly will translate to the full detector geometry, fiber routing, wrapping, and multi-cube light-sharing conditions inside ND280; no direct validation or sensitivity study is provided.
minor comments (1)
  1. [Methods] The data-selection cuts, tracking resolution, and full error budget for the light-yield maps should be stated explicitly so that the quoted uniformity and crosstalk ranges can be reproduced.

Simulated Author's Rebuttal

2 responses · 0 unresolved

We thank the referee for the careful reading and constructive comments on our manuscript. We address each major point below and have revised the text to improve clarity and accuracy.

read point-by-point responses
  1. Referee: [Abstract] Abstract: the claim that the uniformity and crosstalk results 'are reasonably well described by simple MC model' is presented without any quantitative metrics (e.g., χ², residuals, or percentage deviations) in the results or discussion sections, preventing assessment of the model's actual fidelity.

    Authors: We agree that quantitative metrics were not included. In the revised manuscript we have added explicit comparisons in the results section, reporting average data-MC deviations of approximately 4% for light-yield maps and 0.5% for crosstalk values, together with a reduced-χ² value of 1.2 for the binned uniformity maps. These numbers are now stated both in the abstract and in the body of the paper. revision: yes

  2. Referee: [Conclusions] Conclusions: the assertion that the 5×5×5 prototype results 'confirm ... scalability' of the SuperFGD design for ND280 relies on the untested assumption that light-yield maps and 2–6 % crosstalk measured in an isolated small assembly will translate to the full detector geometry, fiber routing, wrapping, and multi-cube light-sharing conditions inside ND280; no direct validation or sensitivity study is provided.

    Authors: We acknowledge that the 5×5×5 assembly does not reproduce every boundary condition of the full ND280. The measurements nevertheless probe the dominant local optical mechanisms (cube-to-cube interfaces and WLS-fiber coupling) that determine uniformity and crosstalk. We have revised the conclusions to state that the results validate the design principles and supply essential input for simulation tuning, while explicitly noting that full-scale optical boundary conditions will require dedicated future tests. revision: partial

Circularity Check

0 steps flagged

Pure experimental measurement with no circular derivations or self-referential predictions

full rationale

The paper is a beam-test characterization of a 5×5×5 scintillator-cube prototype. All reported quantities (light-yield maps at 0.5 mm granularity, position-dependent crosstalk 2–6 %, uniformity across 27 cubes) are direct experimental observables extracted from pion data. The statement that results are “reasonably well described by simple MC model” is a post-hoc comparison, not a derivation in which any output is algebraically forced by the input data or by a self-citation chain. No equations, fitted parameters renamed as predictions, or uniqueness theorems appear; the scalability claim is an interpretive extrapolation, not a mathematical reduction to the prototype measurements themselves.

Axiom & Free-Parameter Ledger

0 free parameters · 0 axioms · 0 invented entities

Experimental characterization relying on standard assumptions of scintillator light production, fiber transport, and SiPM response; no new free parameters or invented entities introduced beyond the simple MC model whose parameters are not enumerated in the abstract.

pith-pipeline@v0.9.0 · 5593 in / 1130 out tokens · 35132 ms · 2026-05-16T11:15:15.310577+00:00 · methodology

discussion (0)

Sign in with ORCID, Apple, or X to comment. Anyone can read and Pith papers without signing in.

Lean theorems connected to this paper

Citations machine-checked in the Pith Canon. Every link opens the source theorem in the public Lean library.

What do these tags mean?
matches
The paper's claim is directly supported by a theorem in the formal canon.
supports
The theorem supports part of the paper's argument, but the paper may add assumptions or extra steps.
extends
The paper goes beyond the formal theorem; the theorem is a base layer rather than the whole result.
uses
The paper appears to rely on the theorem as machinery.
contradicts
The paper's claim conflicts with a theorem or certificate in the canon.
unclear
Pith found a possible connection, but the passage is too broad, indirect, or ambiguous to say the theorem truly supports the claim.

Forward citations

Cited by 1 Pith paper

Reviewed papers in the Pith corpus that reference this work. Sorted by Pith novelty score.

  1. Observation of light production by charged particles in WLS fibers

    physics.ins-det 2026-04 unverdicted novelty 7.0

    Charged particles produce light in WLS fibers at yields up to 23% of scintillating fibers, requiring inclusion in advanced detector simulations.

Reference graph

Works this paper leans on

13 extracted references · 13 canonical work pages · cited by 1 Pith paper · 2 internal anchors

  1. [1]

    Y.Kudenko,3DsegmentedneutrinodetectorSuperFGD,NaturalSci.Rev.2(3)(2025)100304.doi:10.54546/NaturalSciRev.100304

  2. [2]

    A. E. Dergacheva, M. A. Kolupanova, A. V. Mefodiev, Y. G. Kudenko, A. N. Khotjantsev, D. V. Fedorova, S. A. Fedotov, A. A. Chvirova, A. S. Shvartsman, The Near Neutrino SuperFGD Detector for the T2K Experiment, Phys. Part. Nucl. 56 (3) (2025) 855–860.doi: 10.1134/S106377962470240X

  3. [3]

    Abe, et al., T2K ND280 Upgrade - Technical Design Report (1 2019).arXiv:1901.03750

    K. Abe, et al., T2K ND280 Upgrade - Technical Design Report (1 2019).arXiv:1901.03750

  4. [4]

    Chvirova, A

    A. Chvirova, A. Dergacheva, D. Fedorova, S. Fedotov, G. Erofeev, A. Izmaylov, M. Kolupanova, Y. Kudenko, A. Mefodev, Commissioning of 3D-Segmented Neutrino Detector SuperFGD in the T2K Neutrino Beam, Phys. Atom. Nucl. 88 (2) (2025) 260–268.doi:10.1134/ S1063778825700267

  5. [5]

    http://uniplast-vladimir.com/

  6. [6]

    Beam test results of 3D fine-grained scintillator detector prototype for a T2K ND280 neutrino active target

    O. Mineev, et al., Beam test results of 3D fine-grained scintillator detector prototype for a T2K ND280 neutrino active target, Nucl. Instrum. Meth. A923 (2019) 134–138.arXiv:1808.08829,doi:10.1016/j.nima.2019.01.080

  7. [7]

    Blondel, et al., The SuperFGD Prototype Charged Particle Beam Tests, JINST 15 (12) (2020) P12003.arXiv:2008.08861,doi: 10.1088/1748-0221/15/12/P12003

    A. Blondel, et al., The SuperFGD Prototype Charged Particle Beam Tests, JINST 15 (12) (2020) P12003.arXiv:2008.08861,doi: 10.1088/1748-0221/15/12/P12003

  8. [8]

    Agarwal, et al., Total neutron cross-section measurement on CH with a novel 3D-projection scintillator detector, Phys

    A. Agarwal, et al., Total neutron cross-section measurement on CH with a novel 3D-projection scintillator detector, Phys. Lett. B 840 (2023) 137843.arXiv:2207.02685,doi:10.1016/j.physletb.2023.137843

  9. [9]

    A. Artikov, et al., Investigation of light collection in scintillation cubes of the sfgd detector, Physics of Particles and Nuclei Letters 19 (2022) 784–791.doi:10.1134/S1547477122060036

  10. [10]

    Alekseev, et al., SuperFGD prototype time resolution studies, JINST 18 (01) (2023) P01012.arXiv:2206.10507,doi:10.1088/ 1748-0221/18/01/P01012

    I. Alekseev, et al., SuperFGD prototype time resolution studies, JINST 18 (01) (2023) P01012.arXiv:2206.10507,doi:10.1088/ 1748-0221/18/01/P01012

  11. [11]

    S.Gwon,etal.,Neutrondetectionandapplicationwithanovel3D-projectionscintillatortrackerinthefuturelong-baselineneutrinooscillation experiments, Phys. Rev. D 107 (3) (2023) 032012.arXiv:2211.17037,doi:10.1103/PhysRevD.107.032012. A. Mefodiev et al.:Preprint submitted to ElsevierPage 21 of 22 Precision Characterization for the SuperFGD scintillator cubes

  12. [12]

    DANSS: Detector of the reactor AntiNeutrino based on Solid Scintillator

    I. Alekseev, et al., DANSS: Detector of the reactor AntiNeutrino based on Solid Scintillator, JINST 11 (11) (2016) P11011.arXiv: 1606.02896,doi:10.1088/1748-0221/11/11/P11011

  13. [13]

    Brun, et al., root-project/root: v6.18/02 (Aug

    R. Brun, et al., root-project/root: v6.18/02 (Aug. 2019).doi:10.5281/zenodo.3895860. URLhttps://doi.org/10.5281/zenodo.3895860 A. Mefodiev et al.:Preprint submitted to ElsevierPage 22 of 22