REVIEW 4 major objections 6 minor 3 references
A multi-technique search for year-scale $\gamma$-ray quasi-periodic modulation in the high-redshift FSRQ PKS~2052$-$47
T0 review · 4 major / 6 minor · reviewed 2026-08-15 · deepseek-v4-flash
Pith's one-line read This paper argues that the gamma-ray light curve of the high-redshift quasar PKS 2052-47 carries a dominant ~600-630 day quasi-periodic modulation and a secondary ~1050-1110 day modulation, both standing above red-noise confidence levels…
desk verdict A solid multi-technique confirmation of the ~600 d QPO in PKS 2052-47, but the new ~1087 d period needs stronger significance and explicit handling of the unreliable frequency region. read the letter →
The pith
A machine-rendered reading of the paper's core claim, the machinery that carries it, and where it could break.
The reading
What carries the argument
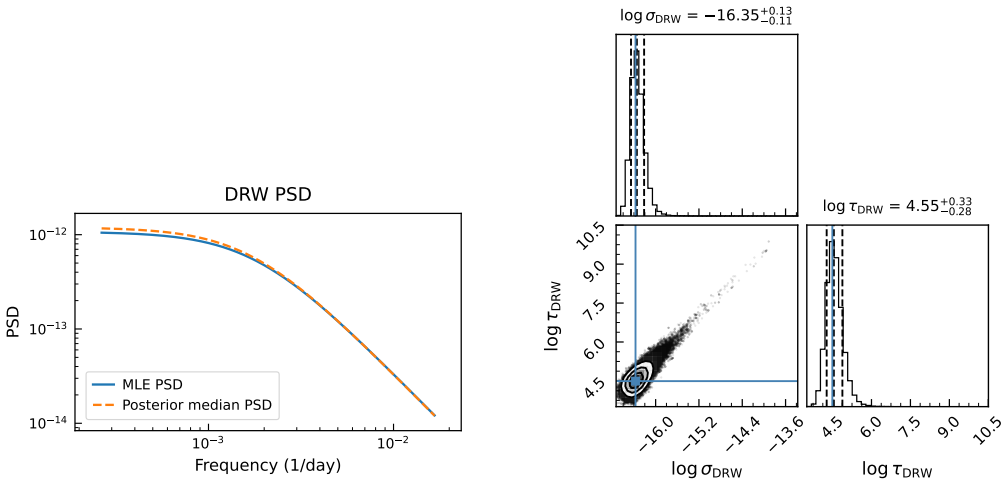
The central machinery is a cross-check of four complementary period estimators: the Lomb-Scargle periodogram, the weighted wavelet Z-transform, the REDFIT AR(1) spectrum, and the date-compensated discrete Fourier transform, each tested against synthetic red-noise light curves. Two separate noise models anchor the significance estimates: Monte Carlo realizations that preserve the observed power spectrum and flux distribution, and 20,000 damped-random-walk simulations whose parameters come from a Gaussian-process fit. The damped-random-walk fit itself yields a stochastic timescale of about 90 days, far shorter than the 600-day period, which is the key reason the periodic signal cannot be dismissed as the fitted noise.
What would settle it
Recompute the local significance of the ~604-day Lomb-Scargle peak using a red-noise power spectral density with a free low-frequency slope (for example, a broken power law with a break near 100 days) and see whether the peak still exceeds the 99 percent level; if it drops below it, the claimed quasi-periodicity is not distinct from the noise.
Extended reading notes
Core claim
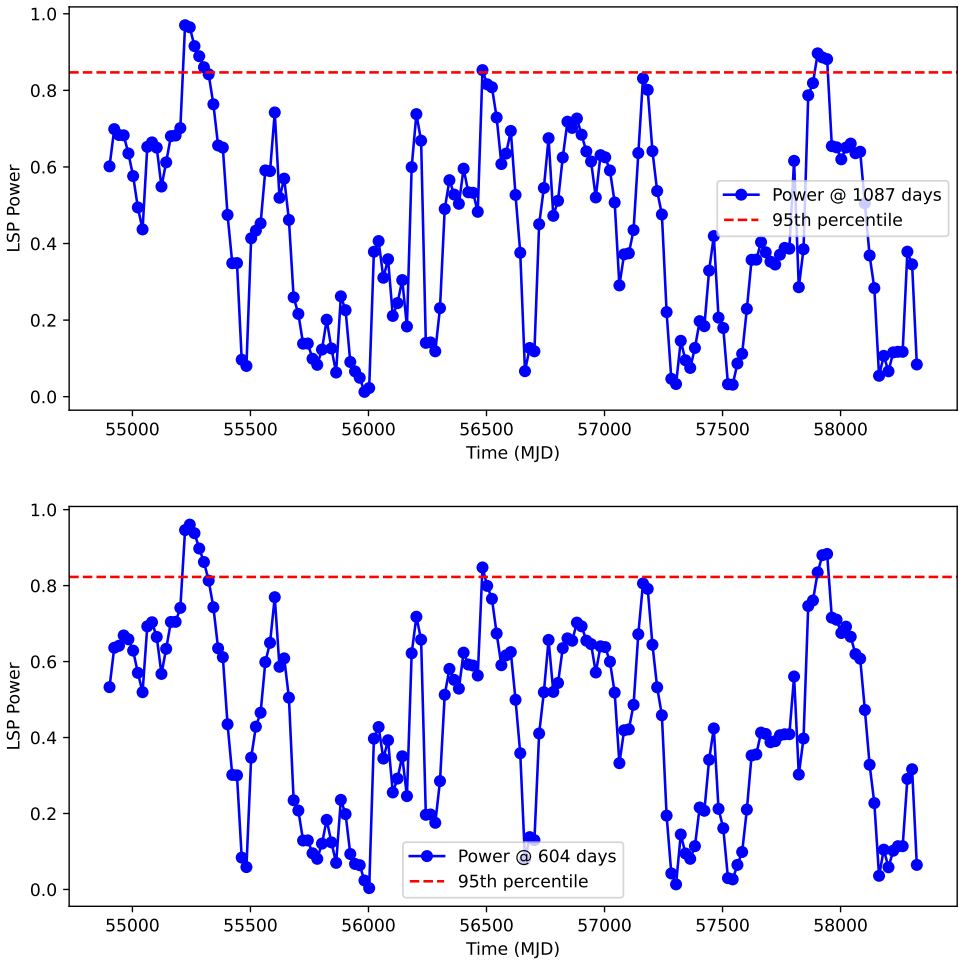
The central discovery is that PKS 2052-47's 11-year, monthly binned gamma-ray light curve contains two quasi-periodic features: a dominant peak at 604.2 +/- 23.4 days and a secondary peak at 1087.2 +/- 80.4 days in the Lomb-Scargle periodogram, with the short period consistently recovered as ~623-628 days by the wavelet, autoregressive, and date-compensated Fourier methods. Monte Carlo simulations that reproduce both the power spectral density and flux distribution of the data put the short-period peak above the 99.5 percent local confidence level, and 20,000 damped-random-walk realizations put both peaks above the 4-sigma envelope. Spectral-window periodograms show the features are not produced by the uneven sampling pattern, and a sliding-window analysis shows the quasi-periodic power switches on and off rather than persisting steadily. The paper interprets the two timescales as possible jet precession or helical Doppler modulation, accretion-flow instabilities, or supermassive-black-hole-binary dynamics, while cautioning that the long-period feature and the intermittency require continued monitoring.
Load-bearing premise
The reported confidence levels assume the background variability is a single power-law noise with slope 0.69, or a damped random walk fitted to the same data; if the real noise has extra low-frequency power or a broken power-law shape, the peaks' significance would be lower.
Editorial extensions
If this is right
- The ~600-630 day period extends the previously reported ~640 day modulation over a longer baseline and is consistent across four independent period estimators.
- The secondary ~1050-1110 day feature, if real, adds a second timescale with roughly four cycles observed, raising the possibility of a near-resonant or harmonic relationship with the short period.
- Because the sliding-window analysis shows the modulation is episodic, any physical model must account for the signal appearing only during parts of the 11-year baseline.
- If confirmed, PKS 2052-47 becomes a rare high-redshift gamma-ray quasi-periodic source, motivating broadband spectral energy distribution modelling and radio very-long-baseline interferometry monitoring of jet position angle.
Reading between the lines
- An implicit testable prediction is that the 604-day modulation should recur in future gamma-ray data if it is a true clock; failure to reappear within another ~5-10 years would favour a red-noise fluctuation over a physical oscillation.
- The ratio of the two periods (~1.8) is close to 2, so if the longer feature is a harmonic of the shorter, the two would be phase-locked; checking for phase coherence between the two folded light curves could discriminate between a single precessing jet and two independent modes.
- If the intermittency is caused by a Doppler-beamed precessing jet, the epochs of high quasi-periodic power should correlate with flaring states and with rotations of the optical polarization angle; coordinated polarimetric monitoring could test this without waiting for a longer gamma-ray baseline.
Signed reviews
Editorial analysis
A structured set of objections, weighed in public.
Referee Report
Summary. The paper analyzes the monthly binned Fermi-LAT gamma-ray light curve of the FSRQ PKS 2052-47 over MJD 54727.99-58507.99 and searches for year-scale quasi-periodic modulation using Lomb-Scargle periodograms, weighted wavelet Z-transforms, REDFIT, DCDFT, and damped random walk modeling. It reports a dominant quasi-periodicity at ~600-630 d and a secondary feature at ~1050-1110 d. Significance is assessed with Emmanoulopoulos-type Monte Carlo simulations using an adopted power-law PSD slope beta=0.69 and with 20,000 DRW-based simulations, and the authors claim that both peaks exceed a 4-sigma envelope in the LSP analysis. Spectral-window and sliding-window diagnostics are presented to argue against sampling artifacts and to show that the QPO power is episodic. The paper concludes with physical interpretations in terms of jet precession, helical motion, accretion instabilities, and supermassive black hole binaries, while explicitly cautioning about the short baseline and the tentative nature of the longer period.
Significance. The shorter-period signal at ~604 d, if real, would confirm and refine the previously reported ~640 d modulation of Prokhorov and Moraghan (2017), and the secondary ~1087 d feature would add a new candidate timescale. The multi-technique approach, the use of PSD- and PDF-preserving simulations, the explicit spectral-window check, and the sliding-window analysis are appropriate strengths. The main scientific value depends on whether the reported significances survive a global (trial-corrected) test and on whether the adopted red-noise models are adequate; the secondary period is currently supported only at local significance and by method-dependent confidence levels, making it the weaker part of the claim.
major comments (4)
- [Section 4, Figure 2] The Monte Carlo significance estimates are local rather than global. The text states that local significance is estimated from the distribution of spectral powers at the candidate frequencies, but no look-elsewhere correction is applied for the number of independent frequencies scanned in the LSP and WWZ analyses. Since the periodogram is searched over a broad frequency range, the quoted >99.5% and >99% levels overstate the probability that such peaks arise by chance. Please report trial-corrected (global) significances or an effective number of independent frequencies, and reconcile these with the Baluev false-alarm probabilities already computed in Section 3.1.
- [Section 4] The red-noise PSD slope beta=0.69 is adopted from Prokhorov and Moraghan (2017) rather than fitted to the monthly binned light curve analyzed here. If the true low-frequency PSD is steeper (beta>=1) or has a broken power-law shape without low-frequency flattening, the simulated confidence levels at f~9.20e-4 d^-1 and f~1.66e-3 d^-1 will be underestimated, directly inflating the reported significance of both peaks. Please perform a sensitivity test with beta values such as 1.0 and 1.5, or fit beta to the actual monthly light curve, and report how the significances change.
- [Section 4, Figure 6] The DRW-based 4-sigma envelope is derived from a model whose PSD flattens below f~1/tau_DRW~0.011 d^-1 (Eq. 6). For periods of 600-1100 d, the relevant frequencies are far below the DRW break, so the 4-sigma threshold depends entirely on the assumed low-frequency flattening. If the true stochastic process has no such flattening, the envelope is underestimated. The manuscript should justify that the DRW low-frequency behavior is appropriate for this source or present an alternative red-noise model (e.g., a fitted power-law PSD) and show whether both peaks still exceed the corresponding threshold.
- [Section 4, Figure 6] The text and Figure 6 caption state that a cyan-shaded frequency range is considered unreliable owing to the finite duration of the light curve and cadence-based criteria, but the paper never states whether the ~1087 d peak at f=9.20e-4 d^-1 falls inside this region. This must be stated explicitly. If the longer-period peak does fall in the unreliable region, the claim that both peaks exceed the 4-sigma DRW envelope is not supported. In addition, the WWZ analysis gives only ~97% confidence for the longer period while the LSP and REDFIT analyses claim >99%, and this method-dependence should be reconciled or discussed as a limitation.
minor comments (6)
- [Section 2.1 and Section 6] The baseline MJD 54727.99-58507.99 is approximately 10.35 yr, not ~11 yr; please correct this and the corresponding cycle counts in Section 6, which should be about 3.5 cycles for the ~1087 d period and 6.3 cycles for the ~604 d period rather than 'four and six'.
- [Section 3.1] The frequency search range is stated as f_min=1/T to f_max=1/(2 Delta T); please define Delta T explicitly for the monthly binned light curve and report the number of independent frequencies used in the false-alarm-probability calculation.
- [Section 3.4, Table 1] The DCDFT confidence levels are quoted as >99% in Table 1 and Figure 4, but Section 3.4 does not describe the null model or simulation used to derive these confidence levels; please add that description.
- [Section 3.5, Figure 5] The DRW parameters are fit to the same data that are later used for significance testing; this should be stated explicitly wherever the 4-sigma envelope is discussed, since fitting the noise model to the data introduces a mild but nonzero circularity.
- [Figure 2 caption] The average WWZ spectrum labels the 97.0% and 99.5% confidence levels, but the text in Section 4 says the longer-timescale feature reaches ~97% while Figure 2 top shows the LSP peaks above 99.5%; please clarify in the caption which confidence levels are local and which are global, if any.
- [General] The paper does not mention data or code availability; if the journal requires it, please include a statement on how the Fermi-LAT data products and analysis scripts can be accessed.
Circularity Check
No circularity: detected peaks are tested against aperiodic red-noise nulls, and self-citations are methodological rather than load-bearing.
full rationale
The paper's central claim is that two quasi-periodic peaks near 604 d and 1087 d appear in the Fermi-LAT light curve of PKS 2052-47. These periods are read directly from periodograms of the observed data, and their significance is evaluated against null models that contain no periodic component. The Emmanoulopoulos et al. (2013) Monte Carlo simulations use a power-law PSD slope beta=0.69 adopted from Prokhorov & Moraghan (2017); this is an external red-noise assumption, not an input that encodes the detected periods, and the paper does not fit the null to the peaks. The DRW simulations fit tau_DRW and sigma_DRW to the same light curve and then generate 20,000 aperiodic realizations; fitting a null model to the data is standard significance-testing practice, not a construction that forces the detected periods. The paper also reports method-dependent significance for the longer period (WWZ ~97 per cent versus LSP >99.5 per cent) and explicitly cautions that the finite baseline and modest cycle count temper the interpretation, so the central claim is not asserted as a forced or self-defined result. Self-citations to Akbar et al. (2025), Nazir et al. (2026), and Tantry et al. (2025) are used for methodology (LSP implementation choices, DRW significance framework, spectral-window and unreliable-region criteria) rather than as the evidence that the periodicities exist. The skeptical concerns about the adopted beta value, the DRW low-frequency envelope, and the possible placement of the longer peak in an 'unreliable' region are model-validity and statistical-robustness issues, not circularity: no equation or fitted parameter is shown to reduce the predicted periods to the inputs by construction. No load-bearing claim rests on a self-citation chain. Therefore the derivation is self-contained with respect to the periodicity claim, and no circular step is identified.
Assumptions & free parameters
free parameters (3)
- DRW long-term amplitude sigma_DRW =
ln sigma_DRW = -16.35 (median), -16.37 (MLE)
- DRW damping timescale tau_DRW =
ln tau_DRW = 4.55 (median, i.e. about 95 d), 4.49 (MLE)
- PSD power-law slope beta =
0.69 (adopted from Prokhorov & Moraghan 2017)
assumptions (5)
- domain assumption The stochastic variability of blazars can be adequately described by a power-law PSD of the form P(f) ~ A f^-beta or by a DRW process.
- standard math The Emmanoulopoulos et al. (2013) method, which simulates light curves matching the observed PSD and PDF, provides a valid null distribution for periodogram peaks.
- domain assumption The adopted PSD slope beta=0.69 from Prokhorov & Moraghan (2017) is applicable to the current 11-year data set.
- domain assumption Monthly binning of the Fermi-LAT light curve does not introduce significant aliasing or distortion of the long-period signals.
- domain assumption The DRW model with parameters fitted to the same data is an appropriate null hypothesis for testing periodic signals.
Cite this review
Pith. "Pith review of A multi-technique search for year-scale $\gamma$-ray quasi-periodic modulation in the high-redshift FSRQ PKS~2052$-$47." pith.science (2026). https://pith.science/paper/GREVXIU2
@misc{pith2026260120471,
  author       = {Pith},
  title        = {Pith review of: A multi-technique search for year-scale $\gamma$-ray quasi-periodic modulation in the high-redshift FSRQ PKS~2052$-$47},
  year         = {2026},
  howpublished = {\url{https://pith.science/paper/GREVXIU2}},
  note         = {Machine review of arXiv:2601.20471}
}
abstract
We investigate year-scale quasi-periodic oscillations in the $\gamma$-ray emission of the high-redshift flat-spectrum radio quasar PKS~2052$-$47 using monthly binned \emph{Fermi}-LAT data spanning MJD~54727.99--58507.99. To assess the statistical significance of periodic features embedded in red-noise-dominated variability, we apply several complementary timing techniques, including the Lomb--Scargle periodogram, weighted wavelet $Z$-transform, date-compensated discrete Fourier transform, REDFIT assuming an AR(1) process, and damped random walk modelling. The analyses reveal a dominant quasi-periodic modulation on a timescale of $\sim600$--630~d, together with a secondary longer-timescale feature near $\sim1050$--1110~d. Monte Carlo simulations show that the shorter-period signal exceeds the highest local confidence levels, while the longer modulation reaches $\gtrsim99$ per cent local significance in several tests; independent DRW-based simulations place both peaks above the $4\sigma$ envelope in the Lomb--Scargle analysis. Spectral-window diagnostics indicate that the detected periodicities are not artefacts of uneven sampling, and a sliding-window analysis shows that the QPO power is episodic across the $\sim11$~yr baseline. We discuss possible physical interpretations in terms of geometric Doppler modulation associated with jet precession or helical motion, accretion-driven instabilities, and SMBBH-induced dynamics.
Figures


Figures from the paper (4 more)


Reference graph
Works this paper leans on
-
[501]
Astronomy and Astrophysics, v. 347, p. 30-36 (1999) 347, 30–36. Wood, M., Caputo, R., Charles, E., Di Mauro, M., Magill, J., Perkins, J.S., Fermi-LAT Collaboration, 2017. Fermipy: An open-source Python package for analysis of Fermi-LAT Data, in: 35th International Cos- mic Ray Conference (ICRC2017), p. 824. doi:10.22323/1.301.0824, arXiv:1707.09551. Xie, ...
arXiv 1999
-
[2005]
The Astrophys- ical Journal Supplement Series 156, 13
A chandra survey of quasar jets: First results. The Astrophys- ical Journal Supplement Series 156, 13. URL:https://doi.org/10. 1086/425578, doi:10.1086/425578. Moreno, J., Vogeley, M.S., Richards, G.T., Yu, W., 2019. Stochastic mod- eling handbook for optical agn variability. Publications of the Astro- nomical Society of the Pacific 131, 063001. Nazir, Z....
-
[2016]
Extragalactic Jets from the TANAMI Sample as Seen by Fermi/LAT
Detection of possible quasi-periodic oscillations in the long- term optical light curve of the bl lac object oj 287. The Astrophysical Journal 832, 47. Boeck, M., Kadler, M., Tosti, G., Burnett, T., Ojha, R., Mueller, C., Wilms, J., 2009. Extragalactic Jets from the TANAMI Sample as Seen by Fermi/LAT. arXiv e-prints , arXiv:0912.4192doi:10.48550/arXiv. 09...
work page Pith review arXiv doi:10.48550/arxiv.0912.4192 2009
Reviewed August 15, 2026 · model on record in the stance chip above.
Discussion (0). Continue with ORCID to comment.