REVIEW 4 major objections 5 minor 1 cited by
Modeling the recent interactions between the Magellanic Clouds and Milky Way
T0 review · 4 major / 5 minor · reviewed 2026-08-03 · deepseek-v4-flash
Pith's one-line read A best-matching N-body model of the Magellanic Clouds over the past 2.5 Gyr finds two close Cloud–Cloud encounters and attributes the LMC's U-shaped warp to the recent one, 140 Myr ago.
desk verdict A credible, honest N-body reconstruction of recent LMC–SMC–MW interactions with a plausible 140 Myr encounter, but the headline claim that this encounter causes the observed U-shaped warp is not robust to plausible LMC halo concentrations—and the feature matches are post-hoc, not fitted. read the letter →
The pith
A machine-rendered reading of the paper's core claim, the machinery that carries it, and where it could break.
The reading
What carries the argument
The load-bearing machinery is a genetic algorithm coupled to live N-body simulations (each with stellar and dark matter particles) that searches the initial positions and velocities of the LMC and SMC 2.5 Gyr ago. Unlike analytical orbit integration, the N-body treatment lets the galaxies deform, so tidal stripping and dynamical friction are captured self-consistently during close passages. The warp mechanism itself is a vertical bending wave: the recent direct impact displaces the outer disc, which then oscillates with a period of roughly 600 Myr, and the observed U-shape is the inner part of that wave.
What would settle it
Measure the three-dimensional kinematics of stars in the outer LMC disc (beyond ~7–8 kpc). If the outer disc is not oscillating vertically with a period of roughly 600 Myr and an amplitude of ~1 kpc, or if the warp is found to pre-date 140 Myr (e.g., in the age distribution of warp stars), then the claim that the recent SMC collision caused the warp is falsified. Alternatively, an independent measurement of the LMC's dark matter halo scale radius showing it to be as compact as model F (~13 kpc) would predict only small ripples, contradicting the observed U-shaped warp.
Extended reading notes
Core claim
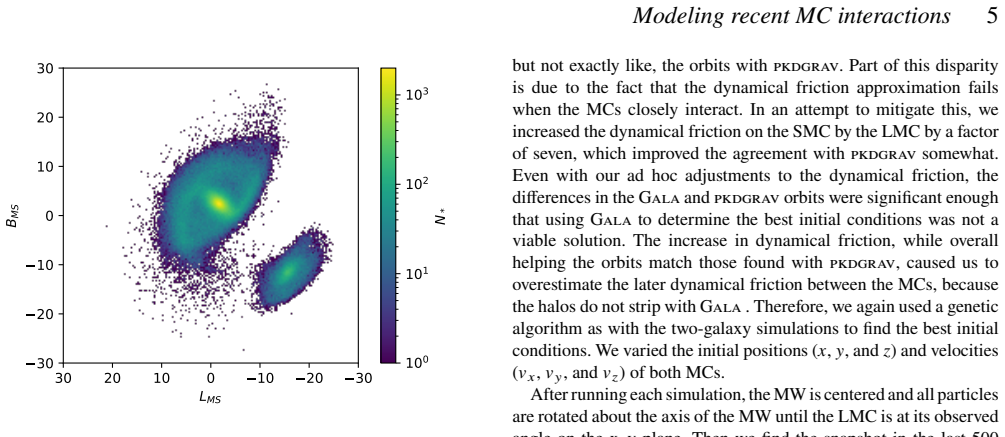
The central discovery is that the LMC's current U-shaped warp is a bending wave excited by a direct collision with the SMC about 140 Myr ago, not a static tidal distortion. In the best-fitting simulation, the LMC and SMC have two close passages (940 Myr and 140 Myr ago); the second sends vertical ripples outward through the LMC disc with mean amplitude ~1.3 kpc, and the observed southern and northern warps correspond to the inner edge of these oscillations. The same simulation reproduces the LMC ring overdensity as a temporary overlap of two spiral arms, the SMC's radial tidal expansion with slope ~10 km/s/kpc, and the eastern SMC distance bimodality as a close retrograde tidal arm stripped
Load-bearing premise
The LMC's dark matter halo must be neither too compact nor too diffuse in just the right way: with a compact halo the recent SMC encounter produces only small ripples, and with a diffuse halo it produces an S-shaped warp, so the claim that the 140 Myr collision caused the observed U-shaped warp hinges on the real LMC halo falling in between.
Editorial extensions
If this is right
- The interaction times are pinned to ~940 Myr and ~140 Myr before the present, giving a timeline that other observations (e.g., star formation histories, stellar populations) can be checked against.
- The LMC's outer disc should exhibit vertical oscillations with a ~600 Myr period and amplitude ~1.3 kpc; deep imaging or proper motions of outer-disc stars can test this directly.
- The ring-shaped overdensity is a transient feature formed by two overlapping spiral arms; it should be expanding outward and will dissipate, meaning the LMC's appearance changes on a few hundred Myr timescale.
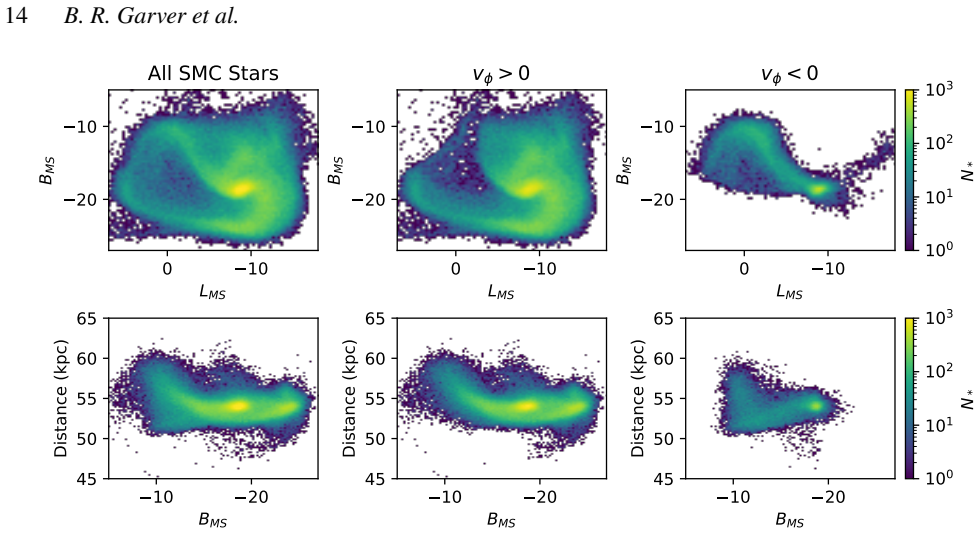
- The SMC's radial expansion and the eastern distance bimodality both derive from the same recent collision, so measurements of SMC kinematics and composition across the eastern side probe the collision geometry.
- The absence of the southern hooks and the SMC Northern Overdensity in the best model suggests those structures formed more than 2.5 Gyr ago, motivating earlier-time simulations.
Reading between the lines
- If the warp is a bending wave, the LMC's vertical velocity field should show a coherent radial pattern (rising on one side, falling on the other) that can be looked for in Gaia proper motions and future spectroscopic surveys.
- The two-interaction timeline predicts that the LMC's star formation may have been triggered twice in the past ~1 Gyr; comparing age distributions of LMC and SMC stellar populations could corroborate or reject the 940 Myr encounter.
- The halo-concentration sensitivity of the warp suggests that measuring the LMC's dark matter halo shape (e.g., through kinematics of the outer disc or stellar streams) is a direct way to validate the model; if the halo is compact, the proposed origin of the U-shaped warp is in trouble.
Editorial analysis
A structured set of objections, weighed in public.
Referee Report
Summary. The paper uses a large suite of N-body simulations (pkdgrav) and a genetic algorithm to reconstruct the past 2.5 Gyr of interactions among the Milky Way, LMC, and SMC. The GA varies the initial positions and velocities of the two Clouds, running ~8,000 low-resolution simulations, and identifies a best-fit model that places the Clouds near their observed center-of-mass positions and velocities at the present day. This model has two close LMC-SMC encounters, ~940 Myr and ~140 Myr ago, and the authors claim it reproduces several observed stellar substructures: an LMC ring, the LMC northern stream, a U-shaped LMC warp, SMC tidal expansion, and an eastern SMC distance bimodality. The paper attributes the LMC warp to the most recent SMC encounter, which excites vertical oscillations with a mean amplitude of 1.3 kpc. The authors also vary LMC disc/halo parameters (models A-G) to test robustness; they find that a more compact halo (model F) suppresses the warp and a more diffuse halo (model G) produces an S-shaped warp.
Significance. If the reconstructed interaction history is correct, the paper would provide a unified dynamical explanation for several observed Magellanic substructures and would pin down the recent encounter times between the Clouds. The ambitious use of a genetic algorithm with live N-body galaxies is a methodological step forward, and the public release of the fiducial simulation is a valuable resource. The paper also makes a falsifiable prediction that vertical oscillations in the outer LMC should be observable. However, the strength of the claims is undercut by the qualitative nature of several feature matches, the large residuals in the GA fit, and the strong dependence of the central warp claim on an uncertain halo parameter. The paper is honest about its limitations but does not always carry that caution into the abstract and conclusions.
major comments (4)
- [Sec. 5.10 / Abstract] The central claim that the ~140 Myr SMC encounter caused the observed U-shaped LMC warp is not robust to the assumed LMC dark-matter halo concentration. The paper shows (Sec. 5.10) that model F (R_h=13 kpc) produces only small-scale ripples with no coherent warp, while model G (R_h=32 kpc) produces an S-shaped warp rather than the observed U-shape. Since the halo concentration is not tightly constrained, the fiducial R_h=21.4 kpc result is just one plausible outcome. The authors themselves state, 'The range of parameter values we looked at left much uncertainty in the characteristics of the LMC.' Yet the abstract and Sec. 7 present the warp as a robust consequence of the interaction. This needs to be either softened to a conditional claim or supported by a quantitative warp comparison (amplitude, radial shape, U-shape parameter) across a range of halo concentrations to show that the U-sh
- [Sec. 5.2] The simulated LMC ring is described as having a position angle of ~30° West of North (or ~150° East of North), whereas the observed ring has a position angle of roughly 20–30° East of North. This is a ~60° difference in orientation, yet the text states it is 'similar to what is seen in the simulation.' A 60° position-angle discrepancy is not a reproduction of the feature. The authors should either quantify the orientation uncertainty and show that projection effects or model choices can reconcile the difference, or present the ring match as partial and discuss what this discrepancy implies for the interaction geometry.
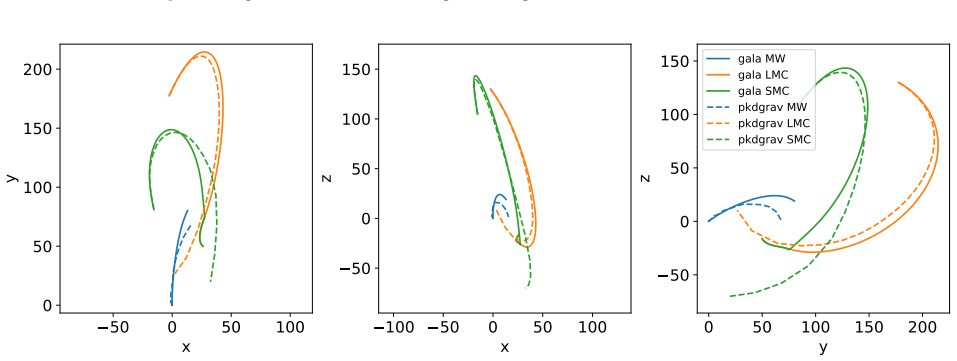
- [Sec. 5.1 / Eq. (1)] The genetic algorithm fitness (Eq. 1) only uses the center-of-mass positions and velocities of the LMC and SMC. The final residuals are sizable: the SMC position is offset by 13.6 kpc (roughly 30% of its distance) and its velocity by 13.2 km/s. Because the substructure features (warp, ring, stream) were not part of the fitness function, their matches are post-hoc by construction. Moreover, the large SMC position offset means the derived interaction geometry—impact parameter and encounter times—is not tightly constrained. The paper should assess how the range of acceptable GA solutions (e.g., finalists or a nearby region of parameter space) changes the interaction times (940 Myr, 140 Myr) and whether the substructure matches persist. Without this, the specific encounter timing is not shown to be a robust result.
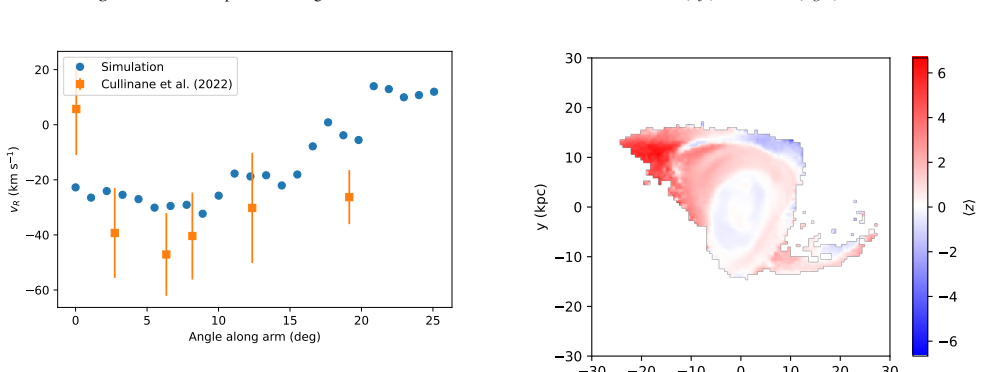
- [Secs. 5.4, 5.5] The comparisons to observed features are largely qualitative. For the northern stream, Fig. 16 shows that the simulated in-plane radial velocity is lower in magnitude than the observed for much of the arm and even changes sign at the end; the authors call the trend 'similar' but offer no quantitative metric (e.g., rms difference, correlation). For the warp, Figs. 17–18 demonstrate vertical oscillations but there is no quantitative comparison of warp amplitude, radial extent, or U-shape against the Choi et al. (2018a) and Saroon & Subramanian (2022) measurements. Given the strong model dependence shown in Sec. 5.10, quantitative metrics are essential to support the claim that the model 'reproduces' the observed warp. I recommend adding such metrics for both features.
minor comments (5)
- [Sec. 5.5] The text says 'At 140 Myr after the interaction the warp is above the disc plane... while at 300 Myr after the interaction it is below,' but the current snapshot is defined when the LMC crosses L_MS=0, which may not be exactly 140 Myr after the interaction. Please clarify the exact time offset between the current snapshot and the last encounter.
- [Sec. 5.6] The simulated SMC rotation reaches ~38 km/s at 6 kpc after the interaction, while Zivick et al. (2021) find a maximum of ~20 km/s at 1 kpc. The paper notes this factor-of-two discrepancy but does not discuss its possible cause (e.g., mass model, stripping efficiency). A brief comment would help.
- [Sec. 5.10] The statement that 'in all models, there are two interactions that occur at about the same times' is complicated by the fact that models B, C, and G cross L_MS=0 20–80 Myr earlier than model A, so the 'current' snapshot is not at the same physical time. Please clarify how this affects the comparison.
- [Fig. 15 caption] Typo: 'Magellenic Stream' should be 'Magellanic Stream.'
- [Fig. 28] The per-panel model labels (A, B, C, D, F, G) are small and partially obscured; larger labels would improve readability.
Circularity Check
No significant circularity: the fitted quantities are COM positions/velocities; the reported substructures and interaction times emerge from the N-body evolution.
full rationale
The derivation chain is self-contained and non-circular. The genetic algorithm fitness (Eq. 1) is explicitly based on the final LMC/SMC median positions and velocities compared to observed values, and Section 4.1 states that adding density/radial velocity/proper-motion map comparisons 'did not have much of an effect' on the fits. The claimed outputs — the two close encounters at 940 Myr and 140 Myr, the LMC ring, the northern stream, the SMC tidal expansion, the eastern distance bimodality, and the LMC warp — are emergent properties of the evolved N-body models, not quantities entered into the fitness function. The paper reports offsets (LMC position 2.8 kpc, velocity 14.8 km/s; SMC position 13.6 kpc, velocity 13.2 km/s) rather than claiming exact reproduction of the fitted targets, further showing the outputs are not trivially forced. The LMC and SMC masses and halo parameters are adopted from external dynamical studies (Erkal et al. 2019; Besla et al. 2012) and are not derived from the features the paper claims to reproduce. The paper's own admission that the warp direction/amplitude differs across models F and G (Section 5.10) is a robustness limitation, not a circularity: it shows the causal claim depends on halo concentration, but the interaction itself exists in all models and the warp is not fitted. Self-citations such as Nidever et al. (2017, 2020) are observational data papers used for comparison, not load-bearing theoretical claims. No equation or parameter is defined in terms of the target results, no prediction reduces to a fitted input, and no uniqueness theorem or ansatz is imported from the authors' prior work. Therefore the paper's central derivation is independent of its own conclusions, and the correct circularity finding is a score of 0.
Assumptions & free parameters
free parameters (2)
- Initial positions and velocities of LMC and SMC at t=-2.5 Gyr (12 numbers) =
not quoted in paper; outputs of genetic algorithm
- LMC stellar mass =
7.2 x 10^9 M_sun
assumptions (5)
- domain assumption Observed COM positions and velocities in Table 2 are accurate and representative of the LMC and SMC centers.
- domain assumption The isolated-6-Gyr-then-interacting-2.5-Gyr setup with masses from Erkal et al. (2019) and Besla et al. (2012) captures the relevant physics.
- ad hoc to paper The GA search over ~8000 simulations approximates the global optimum of the fitness landscape.
- ad hoc to paper The LMC disc/halo models A-G bracket the real LMC, and the fiducial model A is the correct representation for drawing conclusions.
- domain assumption pkdgrav simulations at the stated resolutions resolve the tidal features being compared.
Cite this review
Pith. "Pith review of Modeling the recent interactions between the Magellanic Clouds and Milky Way." pith.science (2026). https://pith.science/paper/F3OF6MXB
@misc{pith2026260205021,
  author       = {Pith},
  title        = {Pith review of: Modeling the recent interactions between the Magellanic Clouds and Milky Way},
  year         = {2026},
  howpublished = {\url{https://pith.science/paper/F3OF6MXB}},
  note         = {Machine review of arXiv:2602.05021}
}
read the original abstract
The Large and Small Magellanic Clouds (LMC and SMC, respectively) are the largest satellite galaxies of the Milky Way (MW) and their interactions with each other have given rise to multiple stellar substructures in their periphery as well as the gaseous Magellanic Stream. To better understand the origin of the stellar substructures and constrain their past orbit, we model the past 2.5 Gyr of the interactions between the MW and the LMC and SMC using N-body simulations. Due to the strong interactions, analytical orbit integrations are insufficient to analyze the past galaxy orbits accurately. Therefore, we use a genetic algorithm in combination with N-body simulations to determine the LMC and SMC initial positions and velocities 2.5 Gyr ago that result in the Magellanic Clouds (MCs) arriving near their observed locations and velocities at the current time. After running ~8,000 simulations, our best matching model includes two close interactions between the MCs (940 Myr and 140 Myr ago) and reproduces some observed features of the MCs, including the LMC disc warp, a ring-shaped overdensity in the LMC, the tidal expansion of the SMC, and a greater distance dispersion on the eastern side of the SMC. The LMC disc warp is caused by the most recent interaction with the SMC, which occurred ~140 Myr before the present. The interaction causes global ripples in the LMC disc with a mean amplitude of 1.3 kpc.
Figures

Figures from the paper (22 more)





Forward citations
Cited by 1 Pith paper
-
LMC-induced Perturbations in the Milky Way Halo II: Bridging Field-level Inference and Summary-level Simulation-Based Inference
A field-level flow-matching likelihood shows the raw 6D halo phase-space distribution carries 2.5-9.9x more MW-LMC parameter information than velocity moments; adding BFE+MOPED summaries recovers much of this gap.
Reference graph
Works this paper leans on
-
[1]
Abdurro’uf et al., 2022, ApJS, 259, 35 Almeida A., et al., 2024, MNRAS, 529, 3858 Andrae R., Rix H.-W., Chandra V., 2023, ApJS, 267, 8 Barger K. A., Haffner L. M., Bland-Hawthorn J., 2013, ApJ, 771, 132 Belokurov V. A., Erkal D., 2019, MNRAS, 482, L9 Besla G., 2015, arXiv e-prints, p. arXiv:1511.03346 BeslaG.,KallivayalilN.,HernquistL.,RobertsonB.,CoxT.J....
arXiv 2022
Reviewed August 3, 2026 · model on record in the stance chip above.
Discussion (0). Sign in to comment.