REVIEW 3 major objections 6 minor 3 references
Effects of Dynamo-Generated Large-Scale Magnetic Fields on the Surface Gravity ($f$) Mode
T0 review · 3 major / 6 minor · reviewed 2026-08-03 · deepseek-v4-flash
Pith's one-line read This paper argues that dynamo-generated, equipartition-strength magnetic fields can, by themselves, strengthen and broaden the Sun's surface-gravity f-mode.
desk verdict Self-consistent dynamo replaces imposed fields, but the saturated-phase comparison doesn't isolate magnetic from hydrodynamic effects on the f-mode. read the letter →
The pith
A machine-rendered reading of the paper's core claim, the machinery that carries it, and where it could break.
The reading
What carries the argument
Two-layer isothermal Cartesian domain with a free surface at the interface; helical forcing in the lower layer drives an alpha^2 dynamo that self-consistently generates large-scale magnetic fields. The f-mode is analyzed via k–omega diagrams of vertical velocity at the interface, and its parameters—mode strength, frequency shift, linewidth—are extracted by Lorentzian fits with a linear background. The paper uses the analytic two-layer f-mode dispersion relation omega_f^2 = g k_h (1-q)/(1+q) as the reference for the frequency shift. The dynamo's saturation at near-equipartition field strengths is the key condition that produces the observed effects.
What would settle it
A control simulation with the same helical forcing and the same saturated kinetic-energy spectrum but with the Lorentz force artificially removed (e.g., setting J×B = 0 after saturation) would settle whether the f-mode enhancement persists. If it does, the paper's magnetic-field attribution is wrong. Alternatively, a series of runs with different magnetic diffusivity, producing different saturated field strengths at the interface, should show that the mode-strength enhancement scales with the local field strength near z=0, not with the energy spectrum.
Extended reading notes
Core claim
In the saturated phase of a self-consistent alpha^2 dynamo, with B_rms = 1.4 B_eq, the f-mode's integrated mode strength, relative frequency shift, and relative linewidth all increase with horizontal wavenumber relative to both the non-magnetic run and the kinematic phase; the kinematic phase acts like the non-magnetic case. The paper concludes that the dynamically generated large-scale magnetic field near the interface—where the f-mode eigenfunction is localized and plasma beta is small—causes the enhancement, consistent with earlier reports of f-mode strengthening in the presence of strong subsurface magnetic fields.
Load-bearing premise
The load-bearing premise is that the magnetic field itself—not the accompanying hydrodynamic reorganization of the flow, which also changes as the dynamo saturates—causes the observed strengthening; the two effects are never separated by a control run.
Editorial extensions
If this is right
- If the claim is correct, the kinematic phase of a dynamo can serve as an effectively magnetic-free reference for f-mode analysis.
- The strengthening and broadening scale with wavenumber, so high-degree helioseismic observations are the most promising place to look for this signal.
- The results qualitatively support the interpretation of observed f-mode strengthening before active-region emergence as caused by strong subsurface magnetic fields, without requiring imposed-field models.
- The mode parameters measured in the saturated phase are consistent with the magnetic field near the interface being the controlling factor, since the f-mode eigenfunction is localized where plasma beta is low.
- The 'fanning out' (broadening) previously seen with imposed nonuniform fields also appears with self-generated fields.
Reading between the lines
- The paper does not separate the magnetic field effect from the concurrent change in the kinetic energy spectrum; a control run with the same hydrodynamic reorganization but no Lorentz force would discriminate. If such a run shows the same strengthening, the magnetic-field attribution would be weakened.
- Because the isothermal stratification causes f/p mode overlap at low k_x (ℓ ≲ 2800), the observable regime is high-degree; a polytropic version would extend the prediction to lower degrees, testable against solar observations near active regions.
- The saturation-level dependence could be tested by varying the magnetic Prandtl number or forcing helicity to change B_eq; the prediction is that the enhancement tracks the local field strength at the interface, not the volume-averaged energy.
- The paper's own caveat about f/p overlap suggests that mode-fitting ambiguity is a plausible alternative explanation for the apparent strengthening; a time-domain analysis or full spectral inversion could check this.
Editorial analysis
A structured set of objections, weighed in public.
Referee Report
Summary. The paper presents 3D MHD simulations of a Cartesian two-layer (free-surface) solar-like domain in which a small-scale helical forcing drives an alpha^2 dynamo in the lower layer. Using k-omega diagrams constructed from vertical velocity at the interface, the authors measure the f-mode's strength, relative frequency shift, and relative linewidth in three states: a purely hydrodynamic run (h1), and the kinematic (kin) and saturated (sat) phases of the hydromagnetic run (d1). They report that the kinematic phase is essentially indistinguishable from the hydrodynamic case, while in the saturated phase the f-mode is significantly strengthened, shifted to higher frequency, and broadened, with effects increasing with horizontal wavenumber. The authors interpret this as the signature of self-consistently generated, near-equipartition subsurface magnetic fields, consistent with earlier imposed-field studies and with observed f-mode strengthening before active-region emergence.
Significance. If the causal interpretation is correct, the paper makes a useful contribution: it removes the artificiality of imposed magnetic fields and shows that a self-generated dynamo field at equipartition strength can perturb the f-mode in the same qualitative way as imposed fields. The design has genuine strengths: the kinematic-phase/hydrodynamic agreement is a clean internal check; the use of a free-surface within the domain allows direct measurement of the f-mode; the analysis pipeline (Lorentzian fits, mode-strength integral, relative frequency shift) follows established diagnostics; and the simulations use a publicly available code. The paper also honestly flags the overlap of f and p modes at low kx and the resulting limitation for observations at moderate harmonic degrees. The central result, however, hinges on separating magnetic from hydrodynamic causes, and this separation is not demonstrated in the present manuscript.
major comments (3)
- [Sec. 4.2, Fig. 3b and Fig. 5] The load-bearing claim is that the saturated-phase f-mode changes are caused by the magnetic field, not by the simultaneously altered hydrodynamic turbulence. The paper itself notes in Sec. 4.2: 'This increase in kinetic energy at large scales can, in turn, strengthen different modes. Below, we confirm that this is indeed the case.' Yet the same section later attributes the strengthening to the magnetic field: 'This enhancement is directly proportional to the magnitude of the magnetic field near the interface.' The saturated phase differs from the kinematic phase in both the magnetic-field strength and the kinetic-energy spectrum (Fig. 3b). No control run — e.g., a hydrodynamic run with a velocity spectrum matched to the saturated phase, or a run with the Lorentz force artificially suppressed while the same kinetic-energy spectrum is imposed — is presented. As it stands, the observed enh
- [Fig. 5; Sec. 3.1] The quantitative trends in Fig. 5 rest on a single realizations and single chosen time intervals, with no error bars or realization spread. The claim that the kinematic phase is 'identical' to the non-magnetic case and the claim that the saturated-phase enhancement is significant would be strengthened substantially by estimates of statistical uncertainty, e.g., by dividing each phase into shorter subintervals, by bootstrap resampling of the time series, or by performing at least one additional dynamo run with a different seed. Without such error estimates, it is difficult for the reader to judge whether the differences between kin and sat phases exceed the natural level of mode-fitting and turbulent fluctuations.
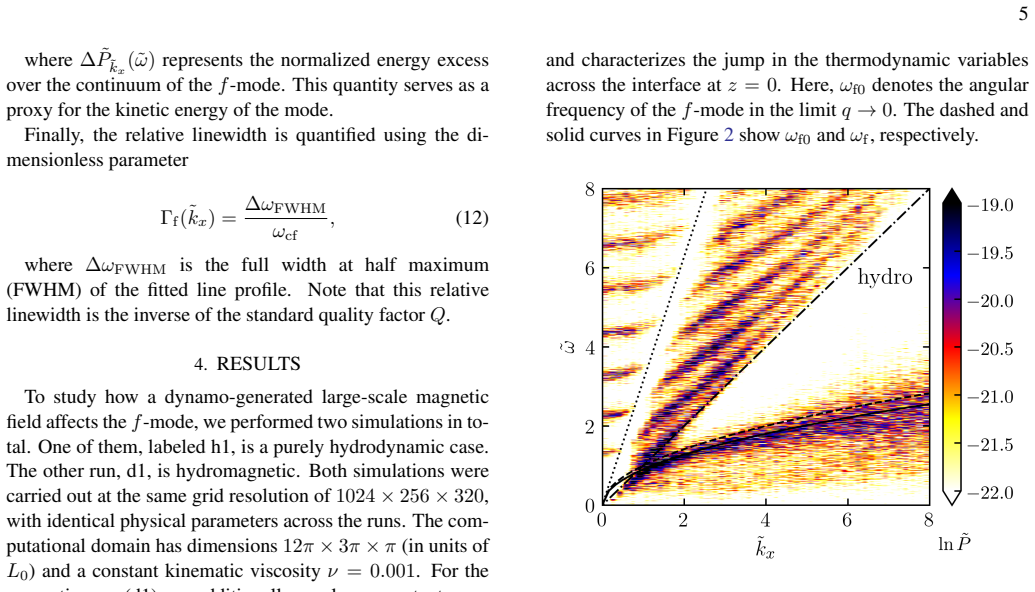
- [Sec. 3.1, Eq. (9)] At low kx, the f-mode overlaps with the p0 and p1 modes (Fig. 4, right panel), and the fitting assumes that a sum of Lorentzians plus a linear background accurately separates the modes. The paper states this is done by fitting all three modes together in the saturated phase, but no validation of the fitting procedure is given, e.g., synthetic tests using the known theoretical dispersion relation and Lorentzian profiles with similar overlap. The fitted linewidths and central frequencies at the lowest kx may therefore absorb misfit uncertainties. This is a correctness risk for the quantitative comparison at low ℓ, where the paper's extrapolation to observations is made. It does not undermine the overall trend, but it should be addressed.
minor comments (6)
- [Abstract and Sec. 1] The abstract states 'the frequencies and the strengths of the f-mode are enhanced'; 'strength' here is the integrated excess power (µ_f), not an amplitude in physical units. Please clarify this terminology early to avoid confusion.
- [Sec. 2.1] The text says 'we can work in the framework of parallel plane approximation'; this should be 'plane-parallel approximation'.
- [Fig. 1 caption] 'Schematic of the the two-layer simulation domain' — remove the duplicated 'the'.
- [Sec. 4.2] The sentence 'What particularly striking' is missing a verb; it should be 'What is particularly striking'.
- [Sec. 4.2, last paragraph] The phrase 'the p-modes too are relatively more broadened and their frequencies are higher' would be clearer as 'the p-modes are also relatively more broadened and their frequencies are higher'.
- [Sec. 4.2, end of first paragraph] The statement 'B_rms = 1.4B_eq' is reported to one decimal place; specify how this is computed (volume/time average over which region and time window) so the reader can reproduce it.
Circularity Check
No significant circularity: f-mode parameters are measured directly and compared against an independent dispersion relation.
full rationale
The paper's derivation chain is not circular. The f-mode diagnostics (strength, frequency shift, linewidth) are extracted by Lorentzian fitting of power spectra from the simulation (Eqs. 9-12) and compared with the analytic f-mode dispersion relation (Eq. 13, attributed to Lamb 1932), which is an external, textbook result rather than an input fitted to the data. The non-magnetic run h1 and the kinematic phase of the dynamo run serve as measured controls for the saturated phase; the saturated phase is a simulated state measured directly from PENCIL CODE output, not a quantity predicted from a fitted parameter. Self-citations to Singh et al. (2014, 2015, 2020) appear only as methodological antecedents or prior reports of f-mode broadening ('we adopt three diagnostic parameters proposed by Singh et al. (2015)', 'Such broadening of f-mode was first reported by Singh et al. (2014)'); they are not load-bearing for the conclusion, which rests on the simulation's own k-omega diagrams. The paper itself notes a limitation in Sec. 4.2 relevant to causal attribution: as the dynamo saturates, 'the kinetic energy shifts from smaller scales to larger scales... This increase in kinetic energy at large scales can, in turn, strengthen different modes', and the later claim that 'this enhancement is directly proportional to the magnitude of the magnetic field near the interface' is not isolated by a control run. That is a confound or causal-identification concern, not circularity: no input is redefined as the output, and no fitted parameter is renamed as a prediction. The Sec. 5 caveat about isothermal stratification and f/p overlap is also a modeling limitation, not a circular step. Overall score 1 reflects minor self-citations that are not load-bearing.
Assumptions & free parameters
free parameters (5)
- Relaxation rates in upper and lower layers =
tau_u^-1 = 0.45 g/c_sd, tau_d^-1 = 0.25 g/c_sd
- Kinematic viscosity nu =
0.001
- Magnetic diffusivity eta =
0.001
- Helical forcing amplitude / energy injection rate =
not stated
- Initial seed magnetic field amplitude =
small, not specified
assumptions (6)
- domain assumption A two-layer isothermal hydrostatic equilibrium with a sharp density/temperature discontinuity at z=0 is a valid local model of the solar near-surface layers and supports an f-mode.
- standard math The f-mode dispersion relation omega_f^2 = omega_f0^2 (1-q)/(1+q) with q = rho_u/rho_d applies to the simulated interface.
- domain assumption Helical stochastic forcing produces an alpha^2 dynamo that saturates near equipartition and represents solar subsurface dynamo action.
- ad hoc to paper The relaxation (Newtonian cooling) term in both subdomains maintains the background stratification without significantly altering f-mode dynamics.
- ad hoc to paper The Lorentzian-plus-linear background fit adequately separates f-mode from p-modes, including when modes overlap at low kx.
- domain assumption Periodic horizontal boundaries and perfectly conducting top/bottom boundaries do not contaminate the high-degree f-mode signals in the box.
Cite this review
Pith. "Pith review of Effects of Dynamo-Generated Large-Scale Magnetic Fields on the Surface Gravity ($f$) Mode." pith.science (2026). https://pith.science/paper/R7BWL7TI
@misc{pith2026260205529,
  author       = {Pith},
  title        = {Pith review of: Effects of Dynamo-Generated Large-Scale Magnetic Fields on the Surface Gravity ($f$) Mode},
  year         = {2026},
  howpublished = {\url{https://pith.science/paper/R7BWL7TI}},
  note         = {Machine review of arXiv:2602.05529}
}
abstract
By modelling the upper layers of the Sun in terms of a two-layer setup where a free-surface exists within the computational domain, we numerically study the interaction between the surface gravity, or the fundamental ($f$) mode, and the magnetic fields. Earlier such works were idealized in the sense that the static magnetic fields were imposed below the photosphere, i.e., the free-surface, to detect signatures of sub-surface magnetic fields and flows on the $f$-mode. In this work, we perform three-dimensional (3D) numerical simulations where the interior fluid below the photosphere is stirred helically at small scales, thus facilitating an $\alpha^2$-dynamo. This allows us to investigate how these self-consistently generated large-scale magnetic fields influence the properties of the $f$-mode. We find that when the magnetic fields saturate near the equipartition values with the turbulent kinetic energy of the flow, the $f$-mode is significantly perturbed. Compared to the non-magnetic case, or the kinematic phase of the dynamo when fields are too weak, we note that the frequencies and the strengths of the $f$-mode are enhanced in presence of saturated magnetic fields, with these effects being larger at larger wavenumbers. This qualitatively confirms the earlier findings from observational and numerical works which reported the $f$-mode strengthening due to strong sub-surface magnetic fields.
Figures


Figures from the paper (2 more)


Reference graph
Works this paper leans on
-
[1]
, " * write output.state after.block = add.period write newline
ENTRY address archivePrefix author booktitle chapter doi edition editor eprint howpublished institution journal key month number organization pages publisher school series title misctitle type volume year version url label extra.label sort.label short.list INTEGERS output.state before.all mid.sentence after.sentence after.block FUNCTION init.state.consts ...
-
[2]
write newline
" write newline "" before.all 'output.state := FUNCTION format.url url empty "" new.block "" url * "" * if FUNCTION format.eprint eprint empty "" archivePrefix empty "" archivePrefix "arXiv" = new.block " " eprint * " " * new.block " " eprint * " " * if if if FUNCTION format.doi doi empty "" " " doi * " " * if FUNCTION format.pid doi empty eprint empty ur...
-
[3]
^mҖBi K Q Qh` ( (DD BDD` ( (DD BDD` ( (DD BDD` ( (DD BDD` ( (DD BDD` ( (DD BDD` ( (DD H eXe iii
thebibliography [1] 20pt to REFERENCES 6pt =0pt -12pt 10pt plus 3pt =0pt =0pt =1pt plus 1pt =0pt =0pt -12pt =13pt plus 1pt =20pt =13pt plus 1pt \@M =10000 =-1.0em =0pt =0pt 0pt =0pt =1.0em @enumiv\@empty 10000 10000 `\.\@m \@noitemerr \@latex@warning Empty `thebibliography' environment \@ifnextchar \@reference \@latexerr Missing key on reference command E...
arXiv 2021
Reviewed August 3, 2026 · model on record in the stance chip above.
Discussion (0). Continue with ORCID to comment.