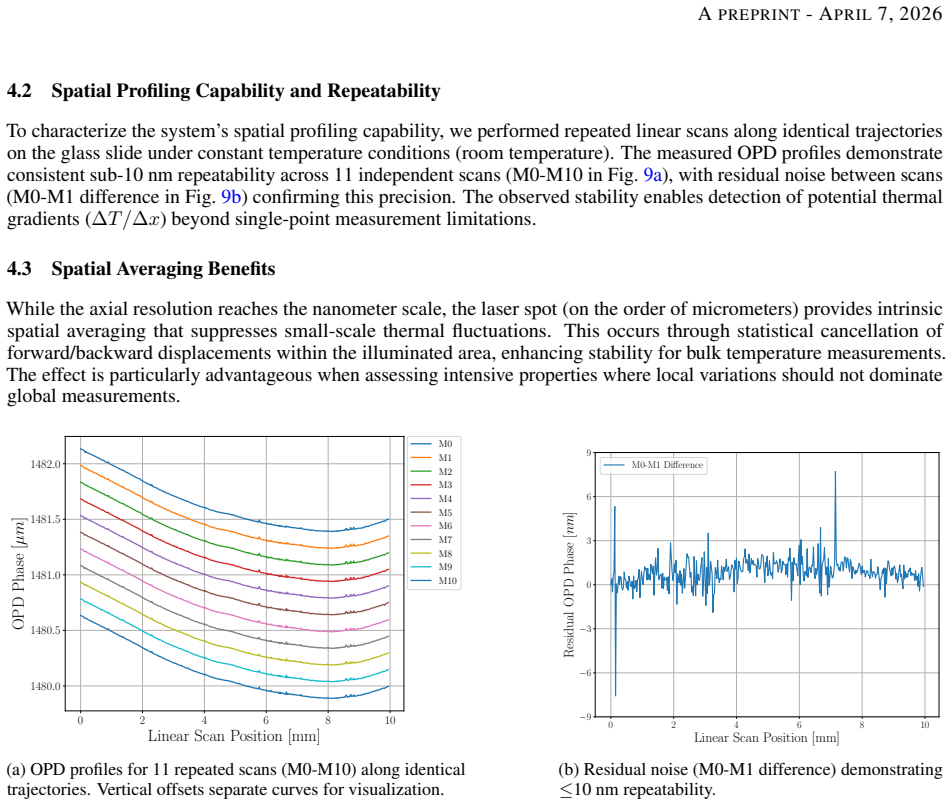
Temperature in Glass Slides: measurement using Phase Sensitive Optical Coherence Tomography and Computational Modeling
Pith reviewed 2026-05-15 08:03 UTC · model grok-4.3
The pith
Phase-sensitive OCT measures temperature in glass slides by tracking optical path changes at 12.4 nm per degree Celsius.
A machine-rendered reading of the paper's core claim, the machinery that carries it, and where it could break.
Core claim
The optical path difference through a 1-mm soda-lime glass slide varies linearly with temperature between 20 and 52 °C, yielding an experimental sensitivity of 12.4 ± 1.9 nm/°C. Finite-volume simulations that incorporate the thermo-optic coefficient and thermal expansion coefficient of glass reproduce the measured values within a 5 % error, confirming that the observed changes arise from the combined thermo-optic and expansion effects.
What carries the argument
Phase-sensitive optical coherence tomography in a common-path spectral-domain configuration that registers sub-nanometer optical path difference changes produced by temperature-driven refractive-index and thickness variations inside the glass.
If this is right
- The same optical path difference signal can be scanned laterally to produce spatially resolved temperature maps inside the slide.
- The validated model supplies a low-cost calibration route for thermal sensing in any transparent solid whose thermo-optic and expansion coefficients are known.
- Sub-10 nm repeatability at constant temperature allows the technique to monitor small thermal fluctuations without physical contact.
- The approach extends contactless temperature measurement to delicate or microscopic transparent samples where traditional sensors cannot be used.
Where Pith is reading between the lines
- The method could be applied to polymers or thin films once their thermo-optic coefficients are independently measured.
- Combining the OCT temperature signal with structural OCT imaging would allow simultaneous mapping of temperature and refractive-index fields.
- Calibration against a traceable thermometer remains necessary before quantitative use on materials whose coefficients are not already known.
Load-bearing premise
Observed optical path difference changes arise solely from the thermo-optic effect and thermal expansion of the glass, with negligible contributions from mechanical stress, optical-system drift, or bath-induced convection.
What would settle it
Place an independent contact thermometer at the exact location probed by the OCT beam and verify that the temperature change inferred from the measured optical path difference agrees with the thermometer reading to within 5 % across the 20–52 °C interval.
Figures


read the original abstract
Phase-sensitive optical coherence tomography (PhS-OCT) enables precise, contactless measurements of temperature-dependent changes in transparent solids. In this work, we used a common-path spectral-domain OCT system to measure optical path differences (OPD) in a 1-mm-thick soda-lime glass slide immersed in a thermal bath. The OPD variation showed a strong linear correlation with temperature in the range of 20-52{\deg}C, with an experimentally determined sensitivity of 12.4 +- 1.9 nm/{\deg}C. A theoretical model incorporating the thermo-optic and thermal expansion coefficients of glass was proposed to interpret the measurements, and numerical simulations based on finite volume methods were performed to account for spatial temperature gradients in the system. The simulations showed agreement with experimental results within 5% error, validating the approach. Additionally, repeatability tests using lateral scans at constant temperature demonstrated sub-10 nm stability, supporting future extensions to spatially resolved thermal mapping. This technique provides a low-cost platform for localized temperature sensing in solid transparent materials.
Editorial analysis
A structured set of objections, weighed in public.
Referee Report
Summary. The manuscript describes the use of phase-sensitive optical coherence tomography (PhS-OCT) to measure temperature-induced changes in optical path difference (OPD) in a 1-mm-thick soda-lime glass slide placed in a thermal bath. Experimental results show a linear relationship between OPD and temperature over 20-52°C, yielding a sensitivity of 12.4 ± 1.9 nm/°C. A finite-volume computational model incorporating thermo-optic and thermal expansion coefficients is used to simulate spatial temperature gradients, with results agreeing with experiments within 5%. Repeatability is demonstrated with sub-10 nm stability at constant temperature.
Significance. If the assumptions hold, this provides a contactless, low-cost platform for localized temperature sensing in transparent solids with potential for spatially resolved thermal mapping. The experimentally determined sensitivity and 5% simulation-experiment agreement constitute a concrete, falsifiable result that could support extensions of PhS-OCT to thermal characterization of solids.
major comments (3)
- [Results] Results section: The reported sensitivity of 12.4 ± 1.9 nm/°C and the 5% simulation agreement are presented without the underlying linear-fit statistics (number of points, R², or uncertainty propagation method), preventing independent assessment of whether the quoted error bar supports the claimed agreement level.
- [Computational modeling] Computational modeling section: The finite-volume model uses literature glass coefficients but provides no boundary-condition details at the glass-bath interface (e.g., convective heat-transfer coefficient) or sensitivity analysis; unmodeled convection could alter the internal temperature field and render the 5% match non-validating for the thermo-optic interpretation.
- [Experimental methods] Experimental methods: No independent verification (thermocouple array, alternate heating geometry, or stress measurement) is reported to bound contributions from mechanical constraint stress, bath convection, or system drift, which are assumed negligible relative to the thermo-optic term in the central OPD-temperature claim.
minor comments (2)
- [Abstract] Abstract and text use raw LaTeX fragments such as 20-52{°}C; these should be rendered as proper degree symbols in the final manuscript.
- [Results] The repeatability statement (“sub-10 nm stability”) would benefit from a quantitative metric (e.g., standard deviation over N lateral scans) and a figure showing the raw time series.
Simulated Author's Rebuttal
We thank the referee for the constructive comments and positive overall assessment of the work. We address each major comment below and indicate the revisions that will be made.
read point-by-point responses
-
Referee: [Results] Results section: The reported sensitivity of 12.4 ± 1.9 nm/°C and the 5% simulation agreement are presented without the underlying linear-fit statistics (number of points, R², or uncertainty propagation method), preventing independent assessment of whether the quoted error bar supports the claimed agreement level.
Authors: We agree that the linear-fit statistics should have been reported explicitly. In the revised manuscript we will add the number of data points used in the regression, the R² value of the fit, and a description of how the uncertainty on the slope was propagated from the phase measurements and temperature readings. This will allow independent evaluation of the quoted sensitivity and the claimed level of agreement with the simulations. revision: yes
-
Referee: [Computational modeling] Computational modeling section: The finite-volume model uses literature glass coefficients but provides no boundary-condition details at the glass-bath interface (e.g., convective heat-transfer coefficient) or sensitivity analysis; unmodeled convection could alter the internal temperature field and render the 5% match non-validating for the thermo-optic interpretation.
Authors: We acknowledge the omission of explicit boundary-condition values and sensitivity analysis. The revised manuscript will state the convective heat-transfer coefficient applied at the glass-bath interfaces and will include a short sensitivity study showing that plausible variations in this coefficient keep the predicted OPD within the reported 5 % agreement with experiment. This will strengthen the validation of the thermo-optic interpretation. revision: yes
-
Referee: [Experimental methods] Experimental methods: No independent verification (thermocouple array, alternate heating geometry, or stress measurement) is reported to bound contributions from mechanical constraint stress, bath convection, or system drift, which are assumed negligible relative to the thermo-optic term in the central OPD-temperature claim.
Authors: The sub-10 nm stability measured in the constant-temperature repeatability scans already constrains combined drift and mechanical contributions to a level far below the observed temperature-induced OPD changes. The close match to the thermo-optic model provides additional support that these effects are secondary. We will add an explicit discussion of this assumption and its limitations in the revised text, noting that independent verification (e.g., thermocouple arrays) would be a valuable extension for future work. revision: partial
Circularity Check
No circularity: experimental sensitivity measured directly from OPD-temperature data; model uses independent literature coefficients for validation.
full rationale
The paper's central result is a direct experimental measurement: OPD variation is recorded via PhS-OCT on a glass slide in a thermal bath, yielding a linear fit with sensitivity 12.4 ± 1.9 nm/°C over 20-52°C. The theoretical model simply inserts standard literature values for the thermo-optic coefficient and thermal expansion coefficient of soda-lime glass; these are not fitted to the present OPD dataset. Finite-volume simulations then solve the heat equation with those fixed coefficients and the known bath boundary conditions, producing a predicted OPD that is compared to the measured values (5% agreement reported). No equation reduces the reported sensitivity to a parameter fitted from the same data, no self-citation supplies a uniqueness theorem or ansatz, and the repeatability test (sub-10 nm stability) is an independent experimental check. The modeling assumptions (negligible stress, convection, drift) are explicit modeling choices whose consequences are tested by the external agreement rather than assumed by construction. This is a standard experimental-plus-simulation validation workflow with no load-bearing step that collapses to its own inputs.
Axiom & Free-Parameter Ledger
free parameters (1)
- experimentally determined sensitivity =
12.4 nm/°C
axioms (2)
- domain assumption Optical path difference changes are linearly proportional to temperature via the thermo-optic coefficient and the coefficient of thermal expansion of soda-lime glass
- domain assumption Finite-volume numerical simulation accurately reproduces the spatial temperature distribution inside the immersed glass slide
Reference graph
Works this paper leans on
-
[1]
A. A. Dos-Reis-Delgado, A. Carmona-Dominguez, G. Sosa-Avalos, I. H. Jimenez-Saaib, K. E. Villegas-Cantu, R. C. Gallo-Villanueva, V . H. Perez-Gonzalez, Recent advances and challenges in temperature monitoring and control in microfluidic devices, ELECTROPHORESIS 44 (1-2) (2023) 268–297. arXiv:https: //analyticalsciencejournals.onlinelibrary.wiley.com/doi/p...
-
[2]
D. Blackburn, Temperature measurements of semiconductor devices - a review, in: Twentieth Annual IEEE Semiconductor Thermal Measurement and Management Symposium (IEEE Cat. No.04CH37545), 2004, pp. 70–80.doi:10.1109/STHERM.2004.1291304
-
[3]
L. Michalski, K. Eckersdorf, J. Kucharski, J. McGhee, Temperature Measurement, John Wiley & Sons, 2001
work page 2001
-
[4]
F., Optical Measurements: Techniques and Applications, Springer Berlin Heidelberg, 2013
M. F., Optical Measurements: Techniques and Applications, Springer Berlin Heidelberg, 2013
work page 2013
-
[5]
B. R. Reddy, I. Kamma, P. Kommidi, Optical sensing techniques for temperature measurement, Appl. Opt. 52 (4) (2013) B33–B39.doi:10.1364/AO.52.000B33. URLhttps://opg.optica.org/ao/abstract.cfm?URI=ao-52-4-B33
-
[6]
T. Tsutsumi, T. Ohta, K. Ishikawa, K. Takeda, H. Kondo, M. Sekine, M. Hori, M. Ito, Rapid measurement of substrate temperatures by frequency-domain low-coherence interferometry, Applied Physics Letters 103 (2013) 182102–182102.doi:10.1063/1.4827426. 11 APREPRINT- APRIL7, 2026
-
[7]
P. V olkov, A. Goryunov, A. Y . Lukyanov, A. Okhapkin, A. Tertyshnik, V . Travkin, P. Yunin, Continuous monitoring of temperature and rate of plasma etching of semiconductor wafers, Applied Physics Letters 107 (11) (2015)
work page 2015
- [8]
-
[9]
Y . Zhao, Z. Chen, C. Saxer, S. Xiang, J. F. de Boer, J. S. Nelson, Phase-resolved optical coherence tomography and optical doppler tomography for imaging blood flow in human skin with fast scanning speed and high velocity sensitivity, Opt. Lett. 25 (2) (2000) 114–116.doi:10.1364/OL.25.000114. URLhttps://opg.optica.org/ol/abstract.cfm?URI=ol-25-2-114
-
[10]
D. C. Adler, S.-W. Huang, R. Huber, J. G. Fujimoto, Photothermal detection of gold nanoparticles using phase- sensitive optical coherence tomography, Opt. Express 16 (7) (2008) 4376–4393. doi:10.1364/OE.16.004376. URLhttps://opg.optica.org/oe/abstract.cfm?URI=oe-16-7-4376
-
[11]
G. Lan, M. Singh, K. V . Larin, M. D. Twa, Common-path phase-sensitive optical coherence tomography provides enhanced phase stability and detection sensitivity for dynamic elastography, Biomedical optics express 8 (11) (2017) 5253–5266
work page 2017
-
[12]
Y . Li, S. Moon, J. J. Chen, Z. Zhu, Z. Chen, Ultrahigh-sensitive optical coherence elastography, Light: Science & Applications 9 (1) (2020) 58
work page 2020
-
[13]
P. Huang, S. Xie, Z. Cao, Z. Ni, B. Dong, Y . Bai, Through-thickness strain field measurement of polymethyl methacrylate sheet using phase-contrast optical coherence tomography, Polymer Testing 110 (2022) 107566. doi:https://doi.org/10.1016/j.polymertesting.2022.107566. URLhttps://www.sciencedirect.com/science/article/pii/S0142941822000915
-
[14]
P. Huang, C. Wang, W. Zhang, Z. Ni, R. You, Monitoring the repair process of internal microdamages in thermoplastic composites using optical coherence tomography, Polymer Testing 143 (2025) 108689. doi:https: //doi.org/10.1016/j.polymertesting.2025.108689. URLhttps://www.sciencedirect.com/science/article/pii/S0142941825000030
-
[15]
P. Huang, Y . Lin, Y . Bai, Z. Ni, S. Xie, B. Dong, Simultaneous measurement of depth-resolved refractive index field and deformation field inside polymers during the curing process, Measurement 205 (2022) 112184. doi:https://doi.org/10.1016/j.measurement.2022.112184. URLhttps://www.sciencedirect.com/science/article/pii/S026322412201380X
- [16]
- [17]
-
[18]
A. Hamidi, Y . A. Bayhaqi, F. Canbaz, A. Navarini, P. C. Cattin, A. Zam, Imaging photothermal-induced expan- sion of bone during laser osteotomy by phase-sensitive oct: preliminary results, in: Biomedical Spectroscopy, Microscopy, and Imaging, V ol. 11359, SPIE, 2020, pp. 127–133
work page 2020
-
[19]
D. Veysset, Y . Zhuo, J. Hattori, M. Buckhory, D. Palanker, Interferometric thermometry of ocular tissues for retinal laser therapy, Biomed. Opt. Express 14 (1) (2023) 37–53.doi:10.1364/BOE.475705. URLhttps://opg.optica.org/boe/abstract.cfm?URI=boe-14-1-37
-
[20]
Y . Zhuo, M. Bhuckory, H. Li, J. Hattori, D. Pham-Howard, D. Veysset, T. Ling, D. Palanker, Retinal thermal deformations measured with phase-sensitive optical coherence tomography in vivo, Light: Science & Applications 14 (1) (2025) 151
work page 2025
-
[21]
Y . Verma, P. Nandi, K. D. Rao, M. Sharma, P. K. Gupta, Use of common path phase sensitive spectral domain optical coherence tomography for refractive index measurements, Appl. Opt. 50 (25) (2011) E7–E12. doi: 10.1364/AO.50.0000E7. URLhttps://opg.optica.org/ao/abstract.cfm?URI=ao-50-25-E7
-
[22]
L. G. Chej, A. G. Monastra, M. F. Carusela, Modeling considerations about a microchannel heat sink, Physics of Fluids 36 (8) (2024) 082005. arXiv:https://pubs.aip.org/aip/pof/article-pdf/doi/10.1063/5. 0218235/20115762/082005_1_5.0218235.pdf,doi:10.1063/5.0218235. URLhttps://doi.org/10.1063/5.0218235 12 APREPRINT- APRIL7, 2026
work page doi:10.1063/5 2024
-
[23]
Y . Yan, Z. Ding, Y . Shen, Z. Chen, C. Zhao, Y . Ni, High-sensitive and broad-dynamic-range quantitative phase imaging with spectral domain phase microscopy, Opt. Express 21 (22) (2013) 25734–25743. doi: 10.1364/OE.21.025734. URLhttps://opg.optica.org/oe/abstract.cfm?URI=oe-21-22-25734
-
[24]
H. C. Hendargo, A. K. Ellerbee, J. A. Izatt, Spectral Domain Phase Microscopy, V ol. 46 of Springer Se- ries in Surface Sciences, Springer Berlin Heidelberg, Berlin, Heidelberg, 2011, pp. 199–228. doi:10.1007/ 978-3-642-15813-1\_8. URLhttps://doi.org/10.1007/978-3-642-15813-1_8
-
[25]
URL https://www.industrialglasstech.com/wp-content/uploads/2018/07/ sodalimeproperties.pdf
Industrial Glass Technology, Soda lime glass properties, accessed: February 13, 2026 (2018). URL https://www.industrialglasstech.com/wp-content/uploads/2018/07/ sodalimeproperties.pdf
work page 2026
-
[26]
Department of Commerce, Gaithersburg, MD (Nov
National Institute of Standards and Technology, Certificate of Analysis, Standard Reference Material® 1822a: Refractive Index Standard, U.S. Department of Commerce, Gaithersburg, MD (Nov. 2008). URLhttps://tsapps.nist.gov/srmext/certificates/archives/1822a.pdf
work page 2008
-
[27]
G. Ghosh, Dispersion of thermooptic coefficients of soda–lime–silica glasses, Journal of the American Ceramic Society 78 (1) (1995) 218–220
work page 1995
-
[28]
Field Operation And Manipulation Software. https://openfoam.org/. [link]. URLhttps://openfoam.org/
-
[29]
Marienfeld Superior, Microscope slides - soda lime glass, Manufacturer’s datasheet, accessed: Apr. 30,
-
[30]
URLhttps://www.marienfeld-superior.com/microscope-slides-thickness-approx-1-mm.html 13
https://www.marienfeld-superior.com/microscope-slides-thickness-approx-1-mm.html (2025). URLhttps://www.marienfeld-superior.com/microscope-slides-thickness-approx-1-mm.html 13
work page 2025
discussion (0)
Sign in with ORCID, Apple, or X to comment. Anyone can read and Pith papers without signing in.