Recognition: no theorem link
UnrealVis: A Testing Laboratory of Optimization Techniques in Unreal Engine for Scientific Visualization
Pith reviewed 2026-05-13 18:33 UTC · model grok-4.3
The pith
UnrealVis provides a configurable lab in Unreal Engine to test and select rendering optimizations that reach performance targets while keeping structural fidelity in large scientific 3D datasets.
A machine-rendered reading of the paper's core claim, the machinery that carries it, and where it could break.
Core claim
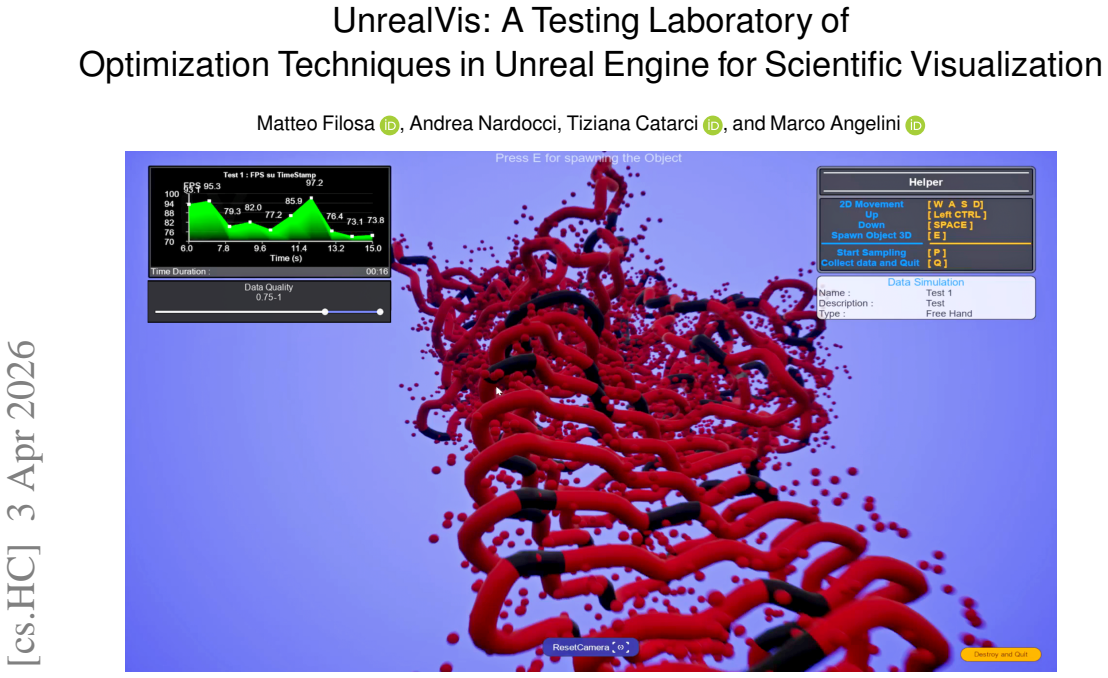
UnrealVis establishes a taxonomy of 22 optimization techniques across six families from a review of 55 papers and implements them through Unreal Engine subsystems including Nanite, LOD schemes, and culling. Its workflow of live telemetry and A/B comparisons enables users to evaluate and choose optimization sets that meet performance goals while preserving structural fidelity, as validated on ribosomal and flow-field datasets.
What carries the argument
UnrealVis, the Unreal Engine laboratory that supplies a taxonomy of 22 techniques in six families together with real-time telemetry and A/B comparison tools for configuring rendering subsystems.
Load-bearing premise
The taxonomy drawn from 55 papers and the implemented Unreal Engine subsystems cover the relevant techniques, and results from the ribosomal and flow-field studies generalize to other scientific datasets.
What would settle it
Finding a new scientific dataset for which no combination of the 22 available optimizations meets both the target frame rate and acceptable structural fidelity would show that UnrealVis does not facilitate such selections.
Figures


read the original abstract
Visualizing large 3D scientific datasets requires balancing performance and fidelity, but traditional tools often demand excessive technical expertise. We introduce UnrealVis, an Unreal Engine optimization laboratory for configuring and evaluating rendering techniques during interactive exploration. Following a review of 55 papers, we established a taxonomy of 22 optimization techniques across six families, implementing them through engine subsystems such as Nanite, Level of Detail(LOD) schemes, and culling. The system features an intuitive workflow with live telemetry and A/B comparisons for local and global performance analysis. Validated through case studies of ribosomal structures and volumetric flow fields, along with an expert evaluation, UnrealVis facilitates the selection of optimization combinations that meet performance goals while preserving structural fidelity. UnrealVis is available at https://github.com/XAIber-lab/UnrealVis
Editorial analysis
A structured set of objections, weighed in public.
Referee Report
Summary. The manuscript introduces UnrealVis, an Unreal Engine-based laboratory for configuring, testing, and evaluating optimization techniques for interactive visualization of large 3D scientific datasets. Following a review of 55 papers, the authors derive a taxonomy of 22 techniques across six families and implement them via engine subsystems such as Nanite, LOD schemes, and culling. The system offers an intuitive workflow with live telemetry and A/B comparisons for local and global performance analysis. Validation is performed through case studies on ribosomal structures and volumetric flow fields together with an expert evaluation. The central claim is that UnrealVis enables users to select optimization combinations that satisfy performance targets while preserving structural fidelity.
Significance. If the claims hold, UnrealVis would provide a practical, accessible platform that lowers the expertise barrier for domain scientists to leverage high-performance game-engine rendering in their work. The open-source release, structured taxonomy, and focus on fidelity-preserving trade-offs address a recurring challenge in scientific visualization. The work could serve as a reusable testbed for future studies on interactive rendering optimizations.
major comments (2)
- [Case Studies] Case Studies section: Validation rests on only two narrow datasets (ribosomal structures and volumetric flow fields) plus expert evaluation. These share specific traits (discrete geometry, coherent fields) that may not represent other domains such as unstructured meshes or time-varying medical volumes. No cross-dataset validation or sensitivity analysis is reported, so the claim that selected combinations preserve fidelity in general is not load-bearing supported.
- [Validation] Validation section: The manuscript states that validation occurred through case studies and expert evaluation yet supplies no quantitative metrics, error analysis, fidelity measures (e.g., structural similarity, visual quality scores), or detailed methodology for assessing preservation of structural fidelity. This absence directly undermines verification of the central facilitation claim.
minor comments (3)
- [Abstract] Abstract: Adding one or two concrete performance numbers or fidelity observations from the case studies would strengthen the summary of results.
- [Implementation] Implementation: A table mapping the six taxonomy families to the specific Unreal Engine subsystems (Nanite, LOD, culling) would improve clarity and traceability.
- [Workflow] Workflow description: Additional figures or annotated screenshots illustrating the live telemetry and A/B comparison interface would aid reader comprehension of the claimed intuitive workflow.
Simulated Author's Rebuttal
We thank the referee for the detailed and constructive review. The comments highlight important limitations in the current validation strategy. We agree that the evidence for generalizability and quantitative fidelity assessment requires strengthening and will revise the manuscript accordingly.
read point-by-point responses
-
Referee: [Case Studies] Case Studies section: Validation rests on only two narrow datasets (ribosomal structures and volumetric flow fields) plus expert evaluation. These share specific traits (discrete geometry, coherent fields) that may not represent other domains such as unstructured meshes or time-varying medical volumes. No cross-dataset validation or sensitivity analysis is reported, so the claim that selected combinations preserve fidelity in general is not load-bearing supported.
Authors: We agree that the two datasets share structural characteristics and that broader validation is needed to support claims of general applicability. In the revised manuscript we will add a third case study using an unstructured tetrahedral mesh from computational fluid dynamics and include a sensitivity analysis that varies data resolution, temporal coherence, and mesh irregularity. We will also report cross-dataset performance and fidelity trends to better substantiate the generalizability of the selected optimization combinations. revision: yes
-
Referee: [Validation] Validation section: The manuscript states that validation occurred through case studies and expert evaluation yet supplies no quantitative metrics, error analysis, fidelity measures (e.g., structural similarity, visual quality scores), or detailed methodology for assessing preservation of structural fidelity. This absence directly undermines verification of the central facilitation claim.
Authors: We acknowledge the absence of quantitative fidelity metrics and detailed methodology in the current draft. The revised version will add a dedicated subsection under Validation that reports SSIM, PSNR, and perceptual quality scores computed against ground-truth high-fidelity renders. We will also describe the exact protocol used for the expert evaluation (including rating scales, number of participants, and statistical analysis) together with error analysis comparing optimized versus baseline renderings across the case studies. revision: yes
Circularity Check
No significant circularity; contribution is implementation and taxonomy without derivations
full rationale
The paper introduces a software laboratory (UnrealVis) and a taxonomy of 22 techniques derived from a review of 55 external papers. No equations, fitted parameters, predictions, or mathematical derivations are present. Claims rest on case studies (ribosomal structures, flow fields) and expert evaluation using publicly available Unreal Engine subsystems (Nanite, LOD, culling). The taxonomy is constructed from cited literature rather than self-definition, and no self-citation chain or ansatz is load-bearing for the core facilitation claim. The work is self-contained as an engineering artifact.
Axiom & Free-Parameter Ledger
axioms (1)
- domain assumption Unreal Engine subsystems such as Nanite, LOD schemes, and culling can be configured to support scientific visualization workflows
Reference graph
Works this paper leans on
-
[1]
Ayachit.The ParaView Guide: A Parallel Visualization Application
U. Ayachit.The ParaView Guide: A Parallel Visualization Application. Kitware, 2015. 1, 2, 3, 4
work page 2015
- [2]
-
[3]
doi: 10.1039/C8FD00025D 2
- [4]
-
[5]
doi: 10.1111/cgf.14738 2
-
[6]
R. Beckmann et al. Cryo-em structure of human 80s ribosome with mrna and trnas. https://www.rcsb.org/structure/4V6W, 2015. Protein Data Bank entry 4V6W. 4, 5, 9
work page 2015
-
[7]
H. M. Berman, J. Westbrook, Z. Feng, G. Gilliland, T. N. Bhat, H. Weissig, I. N. Shindyalov, and P. E. Bourne. The protein data bank.Nucleic Acids Research, 28(1):235–242, 2000. doi: 10.1093/nar/28.1.235 1, 5
-
[8]
J. Brooke. Sus: A “quick and dirty” usability scale. In P. W. Jordan, B. Thomas, B. A. Weerdmeester, and I. L. McClelland, eds.,Usability Evaluation in Industry, pp. 189–194. Taylor & Francis, 1996. 6, 7
work page 1996
-
[9]
M. Chavent, A. Vanel, A. Tek, B. Levy, S. Robert, B. Raffin, and M. Baaden. GPU-accelerated atom and dynamic bond visualization using HyperBalls: a unified algorithm for balls, sticks, and hyperboloids.Journal of Compu- tational Chemistry, 32(13):2924–2935, 2011. doi: 10.1002/jcc.21861 2, 3
-
[10]
J. W. Choi, K. Y . Lee, and O. Narzulloev. Acceleration chimera hologram rendering with unreal engine.International Scientific Journal "Science and Innovation", 3(1), 2024. Series A. 2, 3, 5
work page 2024
-
[11]
K. W. Chong, V . Krishnan, L. Ho, et al. Gears: A game-engine-assisted research platform for scientific computing.IEEE Computer Graphics and Applications, 37(5):66–79, 2017. doi: 10.1109/MCG.2017.3273307 3, 4, 9
-
[12]
R. De Fabrizio et al. Immersive virtual reality in computational chemistry. International Journal of Quantum Chemistry, 116(10):739–749, 2016. doi: 10.1002/qua.25102 2
-
[13]
W. L. DeLano. Pymol: An open-source molecular graphics tool.CCP4 Newsletter on Protein Crystallography, 40(1):82–92, 2002. 2
work page 2002
-
[14]
M. Drouhard, C. A. Steed, S. Hahn, J. Daniel, and M. A. Matheson. Immersive visualization for materials science data analysis using the Oculus Rift. In2015 IEEE International Conference on Big Data (Big Data), pp. 2453–2461. IEEE, 2015. doi: 10.1109/BigData.2015.7364040 1
-
[15]
M. D. Díaz-Alemán, E. M. Amador-García, E. Díaz-González, and J. de la Torre-Cantero. Nanite as a disruptive technology for the interactive visualisation of cultural heritage 3D models: A case study.Heritage, 6(8):5607–5618, 2023. doi: 10.3390/heritage6080295 3, 4
-
[16]
Lumen global illumination and reflections in Un- real Engine 5
Epic Games. Lumen global illumination and reflections in Un- real Engine 5. https://docs.unrealengine.com/5.0/en-US/ lumen-global-illumination-and-reflections-in-unreal-engine/ ,
-
[17]
Accessed: 2026-02-04. 2, 3
work page 2026
-
[18]
Nanite virtualized geometry in Unreal En- gine 5
Epic Games. Nanite virtualized geometry in Unreal En- gine 5. https://docs.unrealengine.com/5.0/en-US/ nanite-virtualized-geometry-in-unreal-engine/ , 2021. Accessed: 2026-02-04. 2, 3, 4
work page 2021
-
[19]
K. A. Ericsson and H. A. Simon.Protocol Analysis: Verbal Reports as Data. MIT Press, Cambridge, MA, rev. ed. ed., 1993. 6, 7
work page 1993
-
[20]
N. Fedotova, M. Protsenko, I. Baranova, S. Vashchenko, and Y . Dehtiarenko. Research on calculation optimization methods used in computer games development.Infor- matyka, Automatyka, Pomiary w Gospodarce i Ochronie´Srodowiska, 13(3):37–42,
-
[21]
doi: 10.35784/iapgos.3828 2, 3, 5
-
[22]
C. Ferreira, J. Gomes, I. Matos, A. Gomes, A. C. Paiva, and A. Raposo. GPU shaders and hyperballs for real-time molecular visualization in unity. In2018 IEEE Conference on Virtual Reality and 3D User Interfaces (VR), pp. 655–656, 2018. doi: 10.1109/VR.2018.8446523 3
-
[23]
N. Fischer et al. Translating 70s ribosome in the unrotated state. https: //www.rcsb.org/structure/8B0X, 2022. Protein Data Bank entry 8B0X. 4, 5, 7, 9
work page 2022
-
[24]
S. Frey, F. Sadlo, and D. Weiskopf. On evaluating runtime performance of interactive visualizations.IEEE Transactions on Visualization and Computer Graphics, 25(1):626–636, 2019. doi: 10.1109/TVCG.2018.2865233 2, 4, 9
-
[25]
S. A. Fromm, F. Weis, J. Reichert, K. H. Nierhaus, and N. Fischer. The translating bacterial ribosome at 1.55 Å resolution generated by cryo-em imaging services. Nature Communications, 14:1095, 2023. doi: 10.1038/s41467-023-36742-3 5
-
[26]
R. J. García-Hernández and D. Kranzlmüller. Virtual reality toolset for material science: Nomad vr tools. InProceedings of the International Conference on High Performance Computing & Simulation (HPCS), pp. 593–600, 2017. doi: 10.1109/HPCS.2017.104 2
-
[27]
M. Garland and P. S. Heckbert. Surface simplification using quadric error metrics. InProceedings of the 24th annual conference on Computer graphics and interactive techniques (SIGGRAPH), pp. 209–216, 1997. doi: 10.1145/258734.258849 3
-
[28]
M. S. Greenwood and M. B. R. Smith. Method for visualizing radiation data using Unreal Engine. InTransactions of the American Nuclear Society, vol. 123 of Transactions of the American Nuclear Society, pp. 1167–1170. American Nuclear Society, La Grange Park, IL, USA, Nov. 2020. Presented at the 2020 American Nuclear Society Winter Meeting (Virtual). doi: 1...
-
[29]
W. Humphrey, A. Dalke, and K. Schulten. Vmd: Visual molecular dynamics.Journal of Molecular Graphics, 14(1):33–38, 1996. doi: 10.1016/0263-7855(96)00018-5 2, 4
-
[30]
B. Karis et al. Real-time global illumination and shadows with unreal engine 5. In ACM SIGGRAPH Talks, 2021. Virtual Shadow Maps technical overview. 3
work page 2021
-
[31]
O. Kreylos. Chisel: A next-generation visualization system. InAGU Fall Meeting Abstracts, 2012. Uses Unreal Engine for seismic visualization. 2
work page 2012
-
[32]
J. Krüger and R. Westermann. Acceleration techniques for gpu-based volume rendering. InProceedings of the 14th IEEE Visualization Conference (VIS), pp. 287–292, 2003. doi: 10.1109/VISUAL.2003.1250384 3
-
[33]
A. Lanrezac, N. Férey, and M. Baaden. Wielding the power of interactive molecular simulations.WIREs Computational Molecular Science, 12(4):e1594, 2022. doi: 10 .1002/wcms.1594 1, 3, 9
work page 2022
-
[34]
J. Laureanti, J. Brandi, E. Offor, D. Engel, R. Rallo, B. Ginovska, X. Martinez, M. Baaden, and N. A. Baker. Visualizing biomolecular electrostatics in virtual reality with UnityMol-APBS.Protein Science, 29(1):237–246, 2020. doi: 10.1002/pro.3773 2, 3
-
[35]
M. Le Muzic, L. Autin, J. Parulek, and I. Viola. cellVIEW: a tool for illustrative and multi-scale rendering of large biomolecular datasets. InEurographics Workshop on Visual Computing for Biology and Medicine (VCBM). The Eurographics Association,
-
[36]
doi: 10.2312/vcbm.20151209 2, 3
-
[37]
W. Li and K. Mueller. Empty space skipping and occlusion clipping for texture-based volume rendering. InProceedings of IEEE Visualization (VIS), pp. 317–324, 2003. doi: 10.1109/VISUAL.2003.1250395 3
- [38]
-
[39]
W. E. Lorensen and H. E. Cline. Marching cubes: A high resolution 3d surface construction algorithm.ACM SIGGRAPH Computer Graphics, 21(4):163–169, 1987. doi: 10.1145/37402.37422 3
-
[40]
Z. Lv, A. Tek, F. Franco, C. Sevilla, P. Derreumaux, B. J. Brewer, and M. Baaden. Game engines for molecular dynamics visualization.PLOS ONE, 8(3):e57418, 2013. doi: 10.1371/journal.pone.0057418 2, 3
-
[41]
F. Löffler, F. Servén, et al. NOMAD VR: Immersive visualization for materials science.Computer Physics Communications, 246:106864, 2019. doi: 10.1016/j.cpc .2019.106864 2, 3
-
[42]
C. Marsden and F. Shankar. Using unreal engine to visualize a cosmological volume.Universe, 6(10):207, 2020. Preprint arXiv:2010.02942. doi: 10. 3390/universe6100207 2, 4
-
[43]
X. Martinez, M. Krone, and M. Baaden. QuickSES: A library for fast computation of solvent excluded surfaces. InEurographics Workshop on Molecular Graphics and Visual Analysis of Molecular Data (MolVa). The Eurographics Association, 2019. doi: 10.2312/molva.20191095 3
-
[44]
G. Meng, N. Spahich, R. Kenjale, G. Waksman, and J. W. St Geme. Crystal structure of theHaemophilus influenzaehap adhesin. https: //www.rcsb.org/structure/3SYJ, 2011. Protein Data Bank entry 3SYJ. Resolution: 2.20 Å. doi: 10.2210/pdb3SYJ/pdb 1, 5, 7, 9
-
[45]
G. Meng, N. Spahich, R. Kenjale, G. Waksman, and J. W. St Geme. Crystal structure of theHaemophilus influenzaehap adhesin reveals an intercellular oligomerization mechanism for bacterial aggregation.The EMBO Journal, 30(19):3864–3874, 2011. doi: 10.1038/emboj.2011.279 1, 5
-
[46]
G. Reina, H. Childs, K. Matkovi´c, K. Bühler, M. Waldner, D. Pugmire, B. Kozlíková, T. Ropinski, P. Ljung, T. Itoh, E. Gröller, and M. Krone. The moving target of visualization software for an increasingly complex world.Computers & Graphics, 87:12–29, 2020. doi: 10.1016/j.cag.2020.01.005 1, 3, 4, 9
-
[47]
C. Rossant et al. Hardware-accelerated interactive data visualization for neuroscience. Frontiers in Neuroinformatics, 7:36, 2013. doi: 10.3389/fninf.2013.00036 2, 3, 9
-
[48]
M. W. Sawicki, M. Erman, T. Puranen, P. T. Riikonen, and P. Vihko. Structure of the ternary complex of human 17β-hydroxysteroid dehydrogenase type 1 with equilin and nadp+.Proceedings of the National Academy of Sciences, 96(3):840–845, 1999. doi: 10.1073/pnas.96.3.840 5, 6
-
[49]
M. W. Sawicki, M. Erman, T. Puranen, P. T. Riikonen, and P. Vihko. Type 1 17-beta hydroxysteroid dehydrogenase equilin complexed with nadp+. https://www.rcsb.org/structure/1EQU, 1999. Protein Data Bank entry 1EQU. Resolution: 2.20 Å. Release: 1999-12-02. doi: 10.2210/pdb1EQU/pdb 5, 6, 7, 9
-
[50]
T. Ulrich. Rendering massive terrains using chunked level of detail control. In SIGGRAPH Course Notes, 2002. 3
work page 2002
-
[51]
I. Wald, G. P. Johnson, J. Amstutz, C. Brownlee, A. Knoll, J. Jeffers, J. Günther, and P. A. Navrátil. OSPRay: A CPU ray tracing framework for scientific visualization. InIEEE Transactions on Visualization and Computer Graphics, vol. 23, pp. 931–940,
-
[52]
doi: 10.1109/TVCG.2016.2617865 1, 2, 3
Presented at IEEE VIS 2016. doi: 10.1109/TVCG.2016.2617865 1, 2, 3
-
[53]
J. Wang, N. Xiang, N. Kukreja, L. Yu, and H.-N. Liang. LVDIF: A framework for real-time interaction with large volume data.The Visual Computer, 39(8):3373–3386,
-
[54]
doi: 10.1007/s00371-023-02976-x 1, 2, 3
discussion (0)
Sign in with ORCID, Apple, or X to comment. Anyone can read and Pith papers without signing in.