Mean--Variance Risk-Aware Bayesian Optimal Experimental Design for Nonlinear Models
Pith reviewed 2026-05-14 21:50 UTC · model grok-4.3
The pith
Bayesian optimal experimental design for nonlinear models can achieve robust performance by optimizing a mean-variance utility criterion.
A machine-rendered reading of the paper's core claim, the machinery that carries it, and where it could break.
Core claim
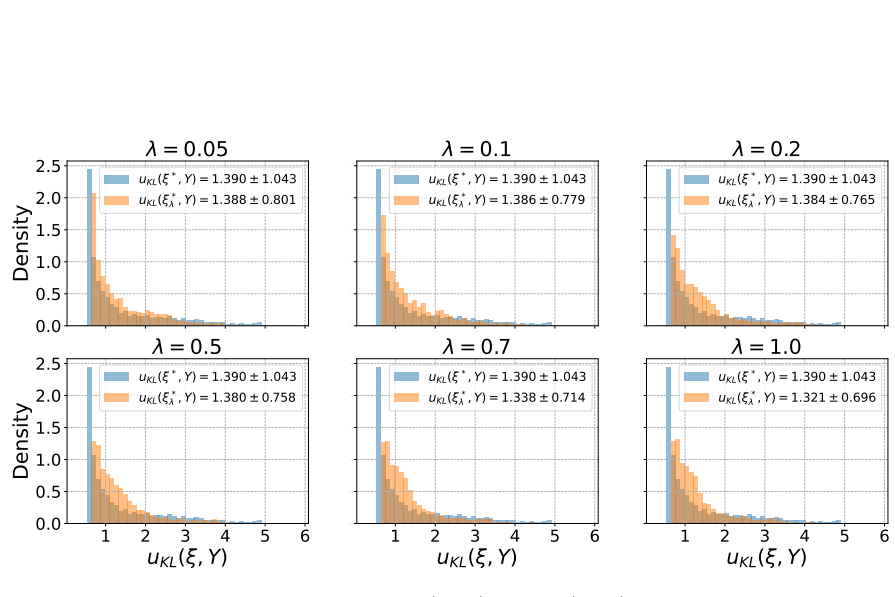
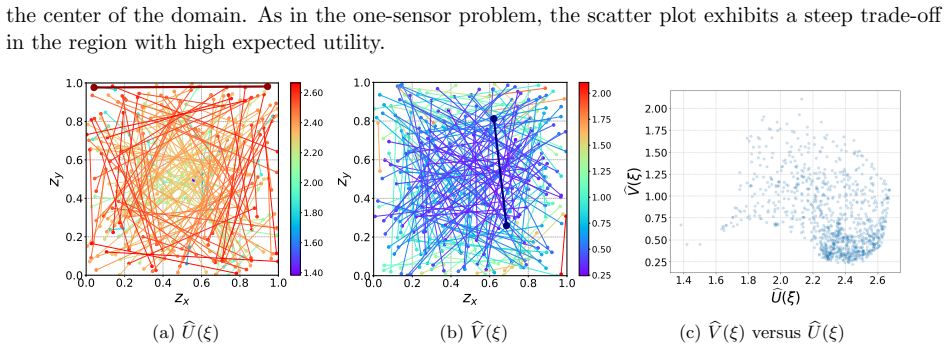
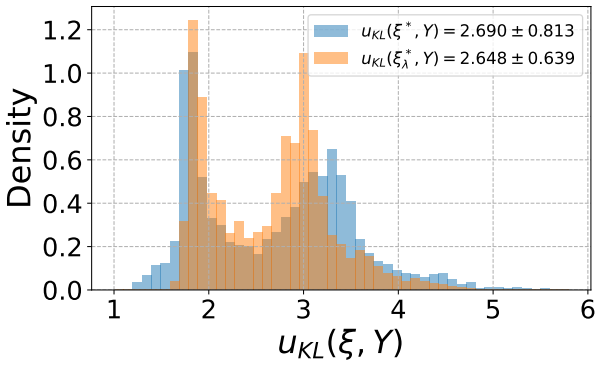
The proposed variance-penalized formulation of Bayesian optimal experimental design yields designs with substantially reduced utility variability while maintaining competitive expected utility values for nonlinear models.
What carries the argument
The mean-variance objective estimated by Monte Carlo from prior samples together with conditional delta-method approximations for bias and variance.
Load-bearing premise
The Monte Carlo estimators using prior sampling and the conditional delta-method expressions give accurate enough estimates of the utility variance for the optimization to succeed.
What would settle it
Compute the actual sample variance of the utility over a large number of independent draws from the posterior for the optimized mean-variance designs and compare it to that of standard expected-utility designs; lower variance would confirm the result.
Figures


read the original abstract
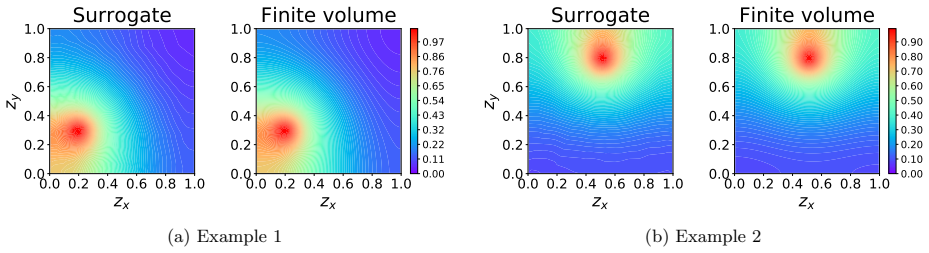
We propose a variance-penalized formulation of Bayesian optimal experimental design for nonlinear models that augments the classical expected utility criterion with a penalty on utility variability, yielding a mean--variance objective that promotes robust experimental performance. To evaluate this objective, we develop Monte Carlo estimators for the expected utility, its second moment, and the resulting utility variance using prior sampling, thereby avoiding explicit posterior sampling. We then derive leading-order bias and variance expressions using conditional delta-method arguments. The objective is optimized using Bayesian optimization with common random samples to reduce noise. Numerical examples, including a linear-Gaussian benchmark, a nonlinear test problem, and contaminant source inversion in diffusion fields, demonstrate that the proposed approach identifies designs with substantially reduced variability while maintaining competitive expected utility.
Editorial analysis
A structured set of objections, weighed in public.
Referee Report
Summary. The paper proposes a mean-variance risk-aware formulation of Bayesian optimal experimental design for nonlinear models. It augments the classical expected-utility criterion with a penalty on utility variability, derives Monte Carlo estimators for the mean and second moment of the utility from prior sampling (avoiding explicit posterior draws), obtains leading-order bias and variance corrections via conditional delta-method expansions, optimizes the resulting objective with Bayesian optimization that re-uses common random numbers, and illustrates the method on a linear-Gaussian benchmark, a nonlinear test problem, and a contaminant-source inversion example in diffusion fields.
Significance. If the delta-method approximations remain accurate across the design space, the work supplies a computationally attractive route to robust experimental designs that explicitly trade off expected utility against its variability. The prior-sampling strategy and common-random-number optimization are practical strengths that could be adopted in settings where full posterior sampling is prohibitive.
major comments (3)
- [§3.3] §3.3 (conditional delta-method derivations): the first-order Taylor expansions for bias and variance of the Monte Carlo utility estimators are presented without uniform remainder bounds or higher-order error controls. In nonlinear models the utility surface can exhibit strong curvature or non-differentiability with respect to the design variables; if the neglected terms are comparable in magnitude to the variance penalty itself, the optimizer may select designs whose reported robustness is an artifact of the approximation rather than a genuine reduction in utility variability.
- [§5] Numerical examples (§5): the reported reductions in utility variance are shown via point estimates only; no Monte Carlo standard errors, sensitivity plots versus sample size N, or cross-validation against exact posterior sampling are provided. Without these diagnostics it is impossible to determine whether the observed gains exceed the approximation error of the delta-method estimators.
- [§4] Optimization procedure (§4): the claim that common random numbers suffice to make the mean-variance objective sufficiently smooth for Bayesian optimization is stated without a convergence analysis or comparison to gradient-based alternatives that could exploit the explicit delta-method gradients.
minor comments (3)
- Notation for the risk-aversion weight λ is introduced without an explicit statement of its admissible range or scaling relative to the utility units.
- [§5] Figure captions in §5 should include the Monte Carlo sample size N used for each panel to allow direct reproducibility.
- The linear-Gaussian benchmark could usefully report the exact closed-form mean-variance optimum for direct comparison with the numerical optimizer.
Simulated Author's Rebuttal
We thank the referee for the constructive and detailed comments, which have helped us identify areas where the manuscript can be strengthened. We address each major comment below and outline the planned revisions.
read point-by-point responses
-
Referee: [§3.3] §3.3 (conditional delta-method derivations): the first-order Taylor expansions for bias and variance of the Monte Carlo utility estimators are presented without uniform remainder bounds or higher-order error controls. In nonlinear models the utility surface can exhibit strong curvature or non-differentiability with respect to the design variables; if the neglected terms are comparable in magnitude to the variance penalty itself, the optimizer may select designs whose reported robustness is an artifact of the approximation rather than a genuine reduction in utility variability.
Authors: We agree that the conditional delta-method yields only leading-order approximations and that uniform remainder bounds are not provided. This is a genuine limitation of the current theoretical development. In the revised manuscript we will expand the discussion in §3.3 to state the smoothness assumptions required for the expansion to be valid, note the absence of higher-order controls, and caution that the approximation may degrade for utilities with strong curvature or non-differentiability. We will also add a short numerical check comparing the delta-method estimates against direct Monte Carlo estimates of higher moments in the examples to illustrate practical accuracy. revision: partial
-
Referee: [§5] Numerical examples (§5): the reported reductions in utility variance are shown via point estimates only; no Monte Carlo standard errors, sensitivity plots versus sample size N, or cross-validation against exact posterior sampling are provided. Without these diagnostics it is impossible to determine whether the observed gains exceed the approximation error of the delta-method estimators.
Authors: We accept that the numerical results in §5 are reported only as point estimates and lack the requested statistical diagnostics. In the revision we will augment all tables and figures with Monte Carlo standard errors, add sensitivity plots that vary the Monte Carlo sample size N, and, for the linear-Gaussian benchmark where exact posterior quantities are available, include a direct comparison against exact sampling to verify that the observed variance reductions exceed the delta-method approximation error. revision: yes
-
Referee: [§4] Optimization procedure (§4): the claim that common random numbers suffice to make the mean-variance objective sufficiently smooth for Bayesian optimization is stated without a convergence analysis or comparison to gradient-based alternatives that could exploit the explicit delta-method gradients.
Authors: Common random numbers are employed to induce positive correlation across design evaluations and thereby reduce the variance of the estimated mean-variance objective, which empirically improves the stability of the Bayesian optimization surrogate. We do not supply a formal convergence analysis of this stochastic optimization procedure, as that would require substantial additional theory. In the revision we will add a brief discussion citing relevant variance-reduction literature and include an empirical comparison (in an appendix) of optimization trajectories obtained with and without common random numbers. While the delta-method supplies explicit gradients, the overall objective remains noisy; Bayesian optimization was selected for its robustness in this setting. A systematic comparison with gradient-based methods is feasible but lies outside the present scope and will be noted as future work. revision: partial
Circularity Check
No circularity in mean-variance BOED derivation chain
full rationale
The paper defines the mean-variance objective explicitly as E[U] minus lambda times Var(U), then constructs Monte Carlo estimators for E[U] and E[U^2] directly from prior samples of the utility function without any parameter fitting to the target quantities or self-referential definitions. The conditional delta-method bias and variance expressions are derived as standard asymptotic approximations applied to those estimators. No equations reduce to tautologies, no fitted inputs are renamed as predictions, and no load-bearing uniqueness claims or ansatzes are imported via self-citation. The derivation remains self-contained against external statistical primitives.
Axiom & Free-Parameter Ledger
free parameters (1)
- risk aversion weight
axioms (1)
- domain assumption Existence of a well-defined prior distribution over model parameters from which samples can be drawn
Reference graph
Works this paper leans on
-
[1]
A. Alexanderian. Optimal experimental design for infinite-dimensional Bayesian inverse prob- lems governed by PDEs: A review.Inverse Problems, 37(4):043001, 2021
work page 2021
-
[2]
J. Beck, B. M. Dia, L. F. Espath, Q. Long, and R. Tempone. Fast Bayesian experimental design: Laplace-based importance sampling for the expected information gain.Computer Methods in Applied Mechanics and Engineering, 334:523–553, 2018
work page 2018
-
[3]
K. Chaloner and I. Verdinelli. Bayesian experimental design: A review.Statistical Science, 10(3), 1995
work page 1995
- [4]
-
[5]
Y. Englezou, T. W. Waite, and D. C. Woods. Approximate Laplace importance sampling for the estimation of expected Shannon information gain in high-dimensional Bayesian design for nonlinear models.Statistics and Computing, 32(5):82, 2022
work page 2022
-
[6]
A layered multiple importance sampling scheme for focused optimal Bayesian experimental design
C. Feng and Y. M. Marzouk. A layered multiple importance sampling scheme for focused optimal Bayesian experimental design. arXiv:1903.11187, 2019
work page internal anchor Pith review Pith/arXiv arXiv 1903
-
[7]
A. Foster, M. Jankowiak, E. Bingham, P. Horsfall, Y. W. Teh, T. Rainforth, and N. Goodman. Variational Bayesian optimal experimental design. In H. Wallach, H. Larochelle, A. Beygelz- imer, F. d'Alch´ e-Buc, E. Fox, and R. Garnett, editors,Advances in Neural Information Pro- cessing Systems, volume 32. Curran Associates, Inc., 2019
work page 2019
-
[8]
A. Foster, M. Jankowiak, M. O’Meara, Y. W. Teh, and T. Rainforth. A unified stochastic gradient approach to designing Bayesian-optimal experiments. In S. Chiappa and R. Calandra, editors,Proceedings of the Twenty Third International Conference on Artificial Intelligence and Statistics, volume 108 ofProceedings of Machine Learning Research, pages 2959–2969...
work page 2020
-
[9]
P. I. Frazier.Bayesian Optimization, page 255–278. INFORMS, 2018
work page 2018
-
[10]
X. Huan, J. Jagalur, and Y. Marzouk. Optimal experimental design: Formulations and com- putations.Acta Numerica, 33:715–840, 2024
work page 2024
-
[11]
X. Huan and Y. Marzouk. Gradient-based stochastic optimization methods in Bayesian ex- perimental design.International Journal for Uncertainty Quantification, 4(6):479–510, 2014
work page 2014
-
[12]
X. Huan and Y. M. Marzouk. Simulation-based optimal Bayesian experimental design for nonlinear systems.Journal of Computational Physics, 232(1):288–317, 2013. 34
work page 2013
-
[13]
J. D. Jakeman, R. D. White, B. G. van Bloemen Waanders, A. Alexandarian, and D. P. Kouri. Risk-averse goal-oriented optimal experimental design using non-linear models. Sandia National Laboratories (SNL-NM), Albuquerque, NM (United States), 2023
work page 2023
-
[14]
D. R. Jones, M. Schonlau, and W. J. Welch. Efficient global optimization of expensive black- box functions.Journal of Global Optimization, 13(4):455–492, 1998
work page 1998
-
[15]
S. Kleinegesse and M. U. Gutmann. Bayesian experimental design for implicit models by mutual information neural estimation. In H. D. III and A. Singh, editors,Proceedings of the 37th International Conference on Machine Learning, volume 119 ofProceedings of Machine Learning Research, pages 5316–5326. PMLR, 2020
work page 2020
-
[16]
D. P. Kouri, J. D. Jakeman, and J. Gabriel Huerta. Risk-adapted optimal experimental design. SIAM/ASA Journal on Uncertainty Quantification, 10(2):687–716, 2022
work page 2022
-
[17]
K. P. Kusumo, K. Kuriyan, S. Vaidyaraman, S. Garc´ ıa-Mu˜ noz, N. Shah, and B. Chachuat. Risk mitigation in model-based experiment design: A continuous-effort approach to optimal campaigns.Computers & Chemical Engineering, 159:107680, 2022
work page 2022
-
[18]
D. V. Lindley. On a measure of the information provided by an experiment.The Annals of Mathematical Statistics, 27(4):986–1005, 1956
work page 1956
-
[19]
Q. Long, M. Scavino, R. Tempone, and S. Wang. Fast estimation of expected information gains for Bayesian experimental designs based on Laplace approximations.Computer Methods in Applied Mechanics and Engineering, 259:24–39, 2013
work page 2013
- [20]
-
[21]
Moˇ ckus.On Bayesian methods for seeking the extremum, page 400–404
J. Moˇ ckus.On Bayesian methods for seeking the extremum, page 400–404. Springer Berlin Heidelberg, 1975
work page 1975
- [22]
-
[23]
A. M. Overstall, J. M. McGree, and C. C. Drovandi. An approach for finding fully Bayesian op- timal designs using normal-based approximations to loss functions.Statistics and Computing, 28(2):343–358, 2017
work page 2017
-
[24]
T. Rainforth, R. Cornish, H. Yang, A. Warrington, and F. Wood. On nesting Monte Carlo estimators. In J. Dy and A. Krause, editors,Proceedings of the 35th International Conference on Machine Learning, volume 80 ofProceedings of Machine Learning Research, pages 4267–
-
[25]
T. Rainforth, A. Foster, D. R. Ivanova, and F. Bickford Smith. Modern Bayesian experimental design.Statistical Science, 39(1), 2024
work page 2024
-
[26]
R. T. Rockafellar and S. Uryasev. The fundamental risk quadrangle in risk management, optimization and statistical estimation.Surveys in Operations Research and Management Science, 18(1–2):33–53, 2013
work page 2013
-
[27]
J. O. Royset. Risk-adaptive approaches to stochastic optimization: A survey.SIAM Review, 67(1):3–70, 2025. 35
work page 2025
-
[28]
E. G. Ryan, C. C. Drovandi, J. M. McGree, and A. N. Pettitt. A review of modern computa- tional algorithms for Bayesian optimal design.International Statistical Review, 84(1):128–154, 2015
work page 2015
-
[29]
K. J. Ryan. Estimating expected information gains for experimental designs with applica- tion to the random fatigue-limit model.Journal of Computational and Graphical Statistics, 12(3):585–603, 2003
work page 2003
-
[30]
B. Shahriari, K. Swersky, Z. Wang, R. P. Adams, and N. de Freitas. Taking the human out of the loop: A review of Bayesian optimization.Proceedings of the IEEE, 104(1):148–175, 2016
work page 2016
-
[31]
A. Shapiro, D. Dentcheva, and A. Ruszczynski.Lectures on Stochastic Programming: Modeling and Theory, Third Edition. Society for Industrial and Applied Mathematics, 2021
work page 2021
-
[32]
D. Strutz and A. Curtis. Variational Bayesian experimental design for geophysical applications: Seismic source location, amplitude versus offset inversion, and estimating co2 saturations in a subsurface reservoir.Geophysical Journal International, 236(3):1309–1331, 2023
work page 2023
-
[33]
P. E. Valenzuela, C. R. Rojas, and H. Hjalmarsson. Uncertainty in system identification: Learning from the theory of risk.IFAC-PapersOnLine, 48(28):1053–1058, 2015
work page 2015
-
[34]
X. Wang, Y. Jin, S. Schmitt, and M. Olhofer. Recent advances in Bayesian optimization.ACM Computing Surveys, 55(13s):1–36, 2023
work page 2023
- [35]
- [36]
-
[37]
R. D. White, J. D. Jakeman, B. G. van Bloemen Waanders, D. P. Kouri, and A. Alexandar- ian. A Bayesian approach to designing experiments that account for risk. Sandia National Laboratories (SNL-NM), Albuquerque, NM (United States), 2023. 36
work page 2023
discussion (0)
Sign in with ORCID, Apple, or X to comment. Anyone can read and Pith papers without signing in.