Dynamic Factor Stochastic Volatility-in-Mean VAR for Large Macroeconomic Panels
Pith reviewed 2026-05-10 20:08 UTC · model grok-4.3
The pith
Embedding volatility directly into the conditional mean of a dynamic factor stochastic volatility VAR improves forecasts for macroeconomic variables during crises.
A machine-rendered reading of the paper's core claim, the machinery that carries it, and where it could break.
Core claim
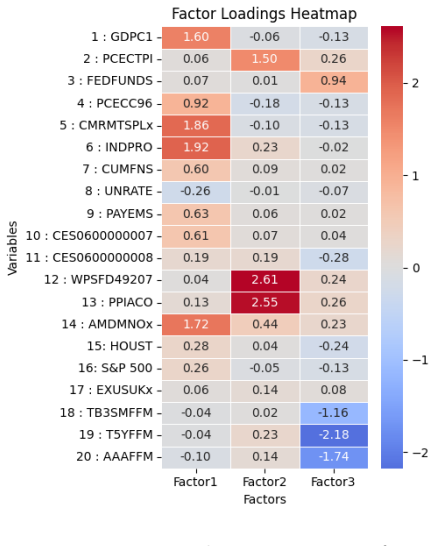
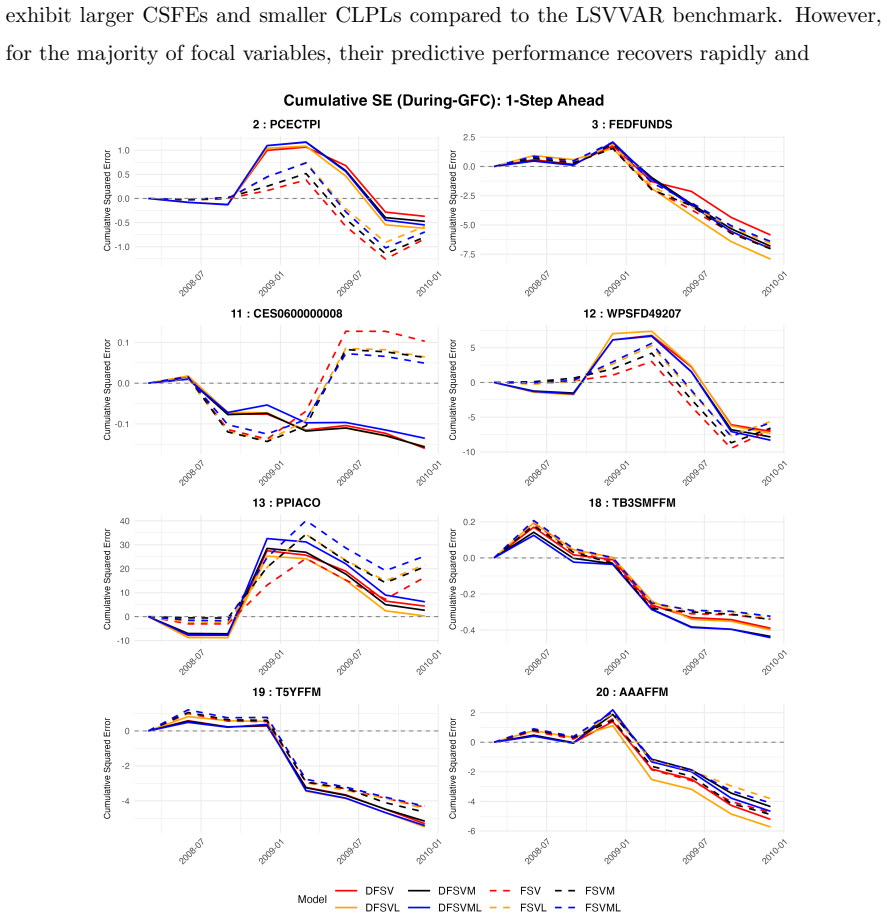
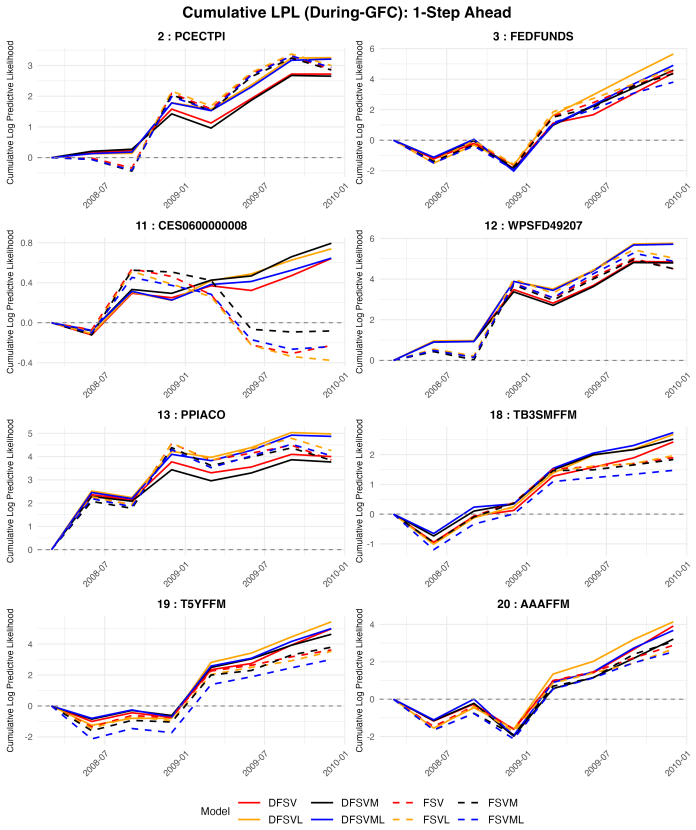
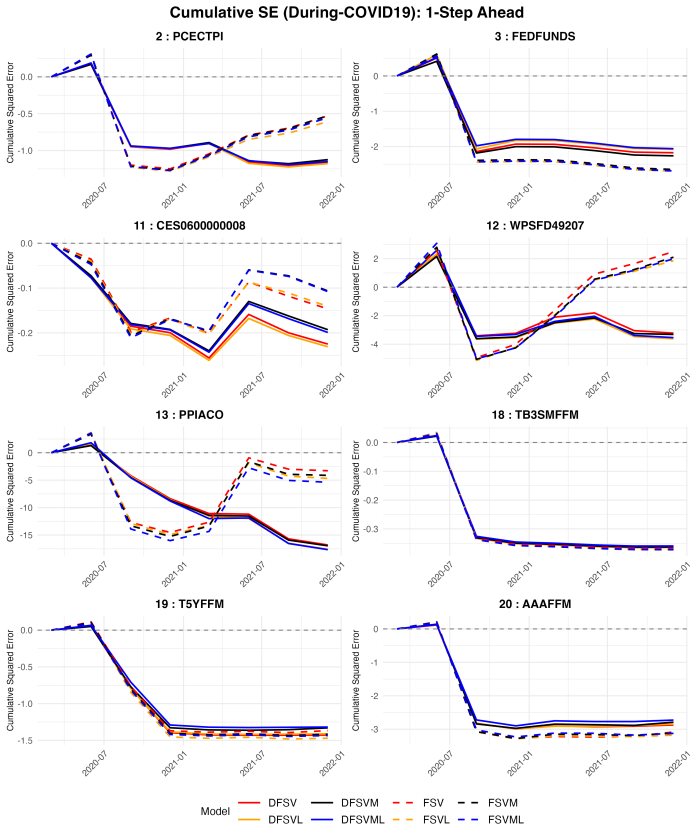
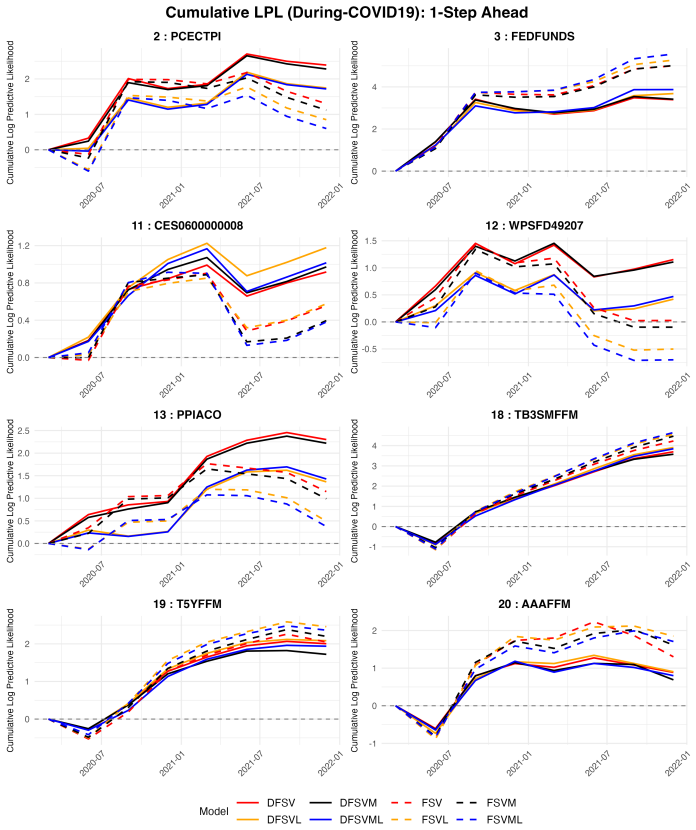
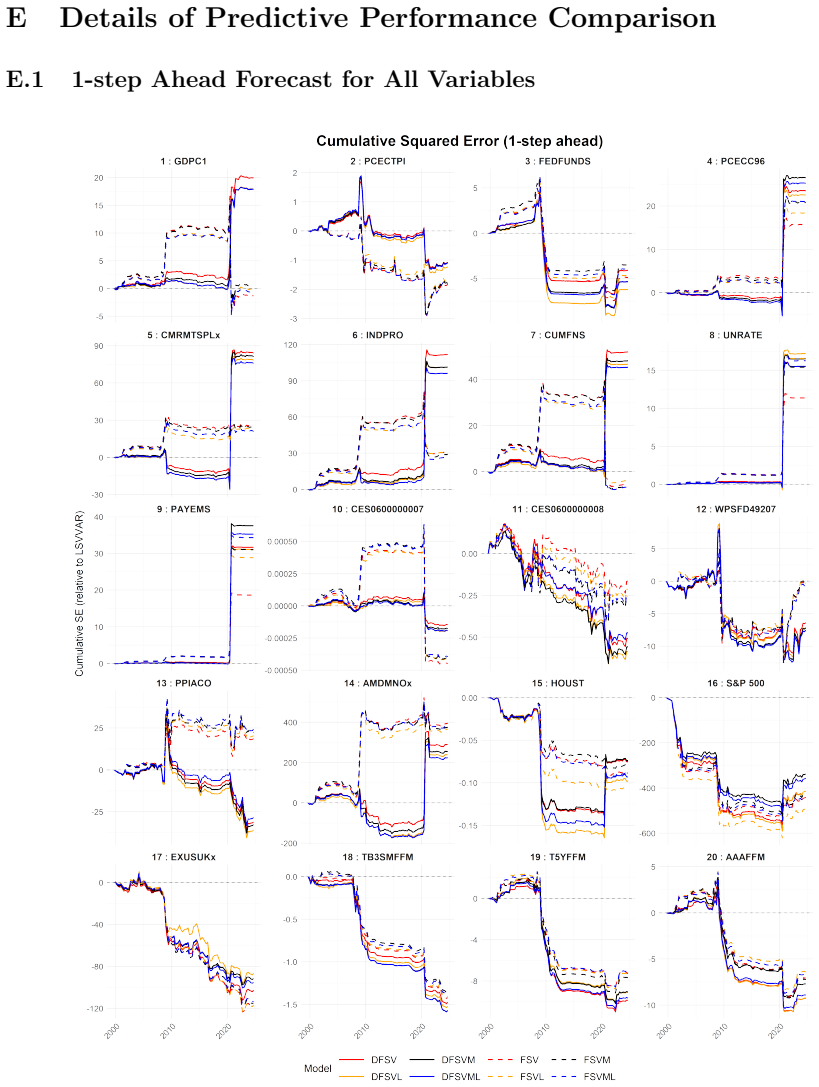
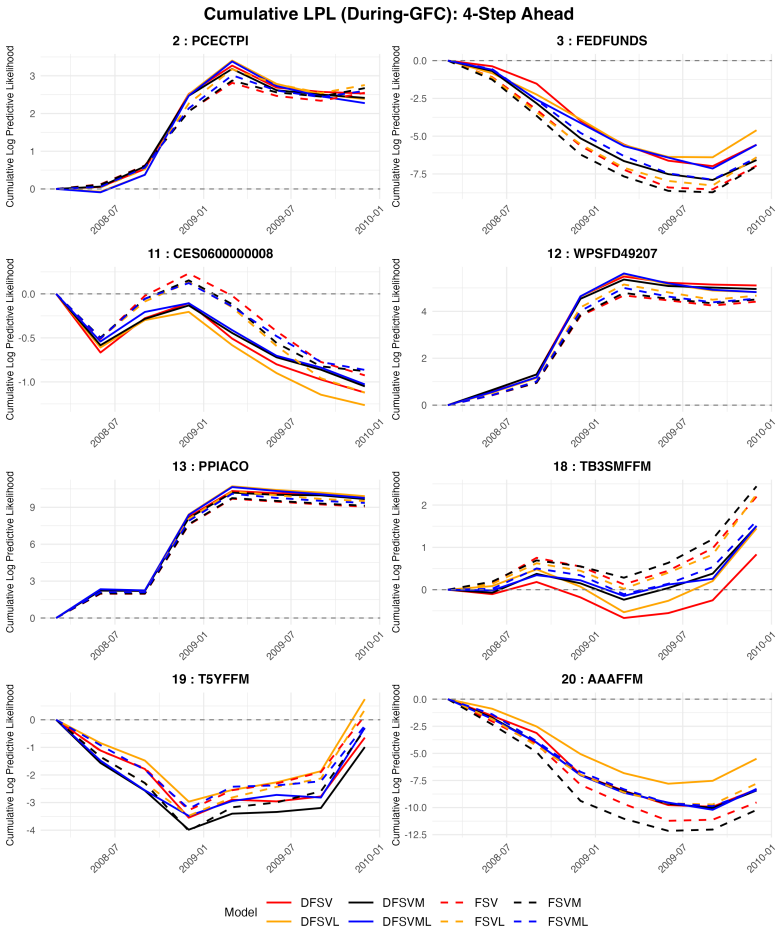
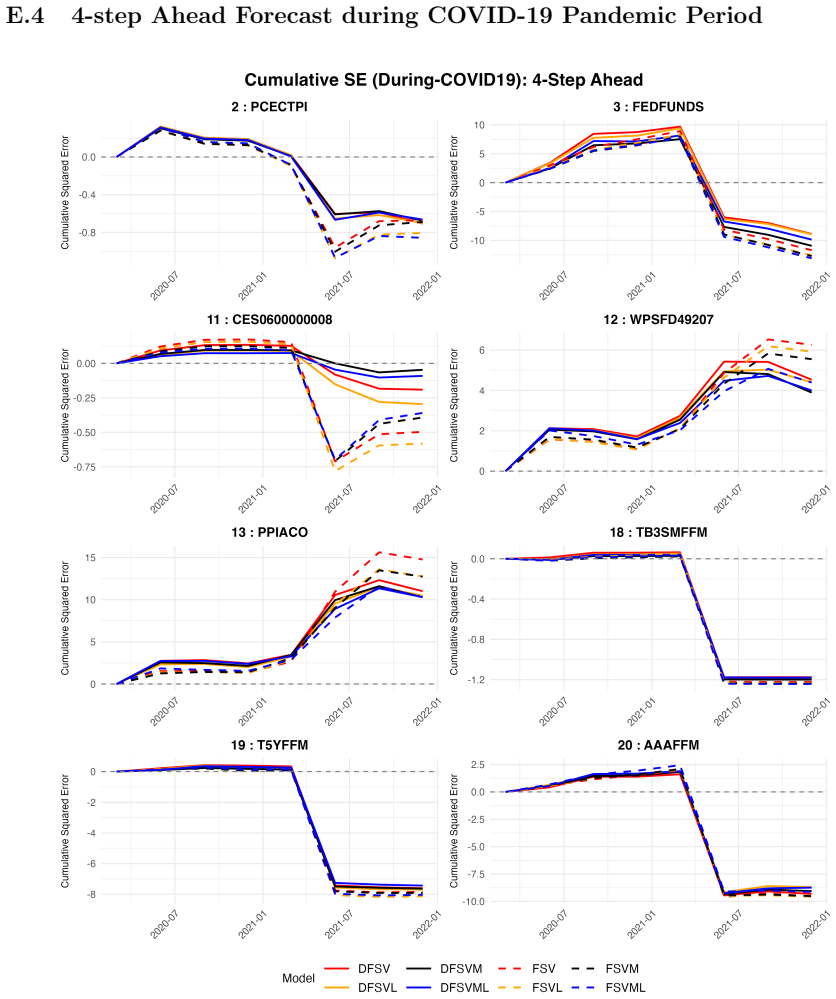
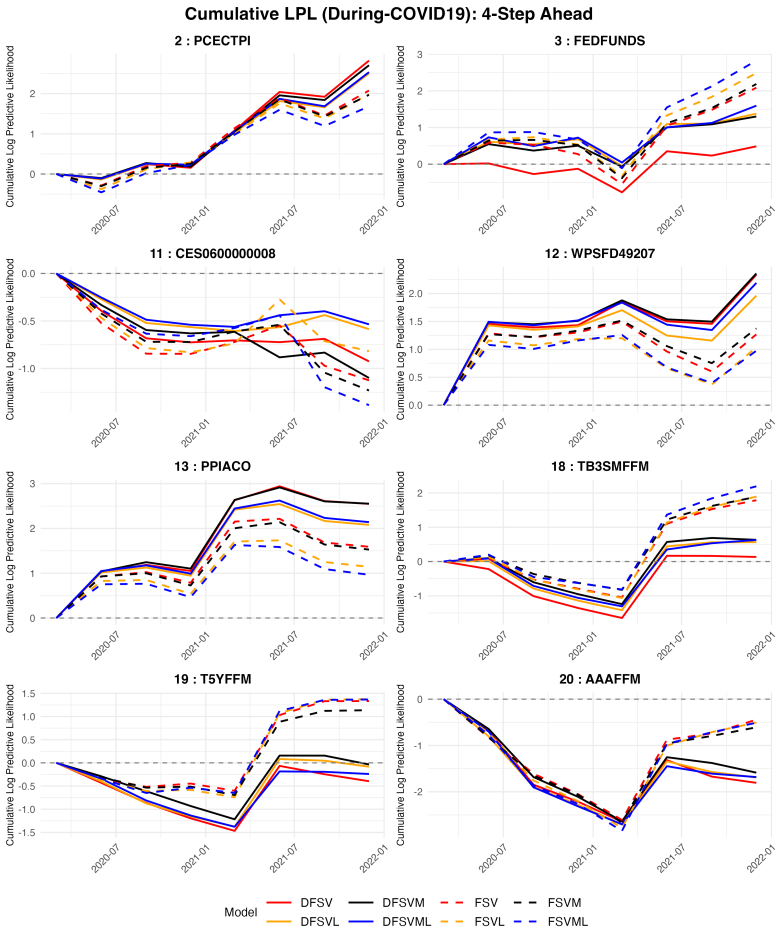
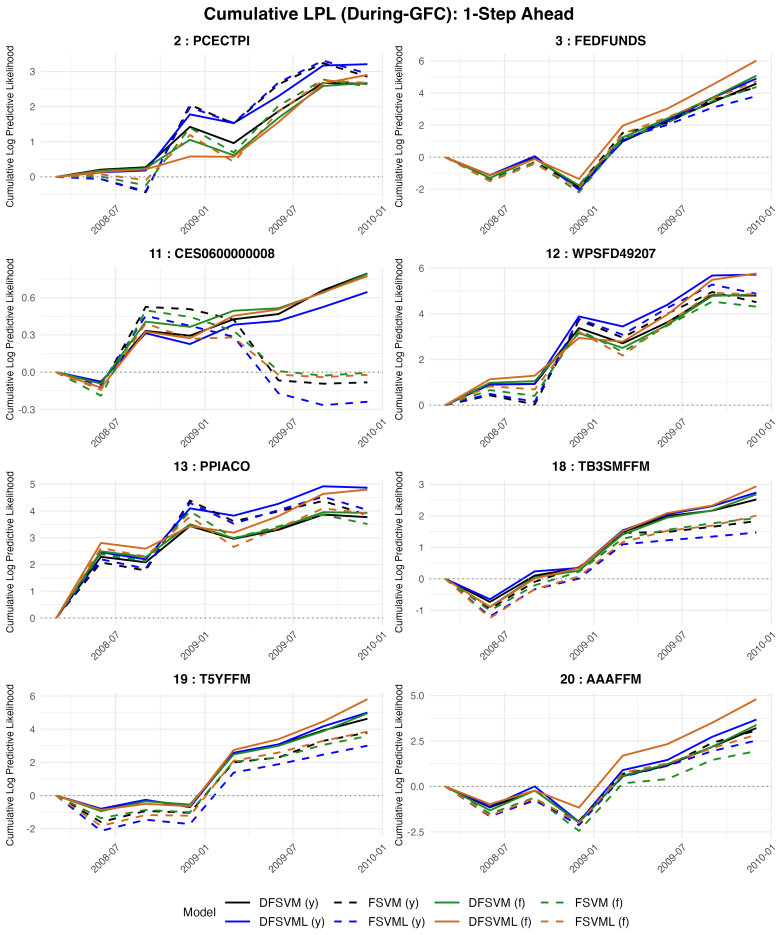
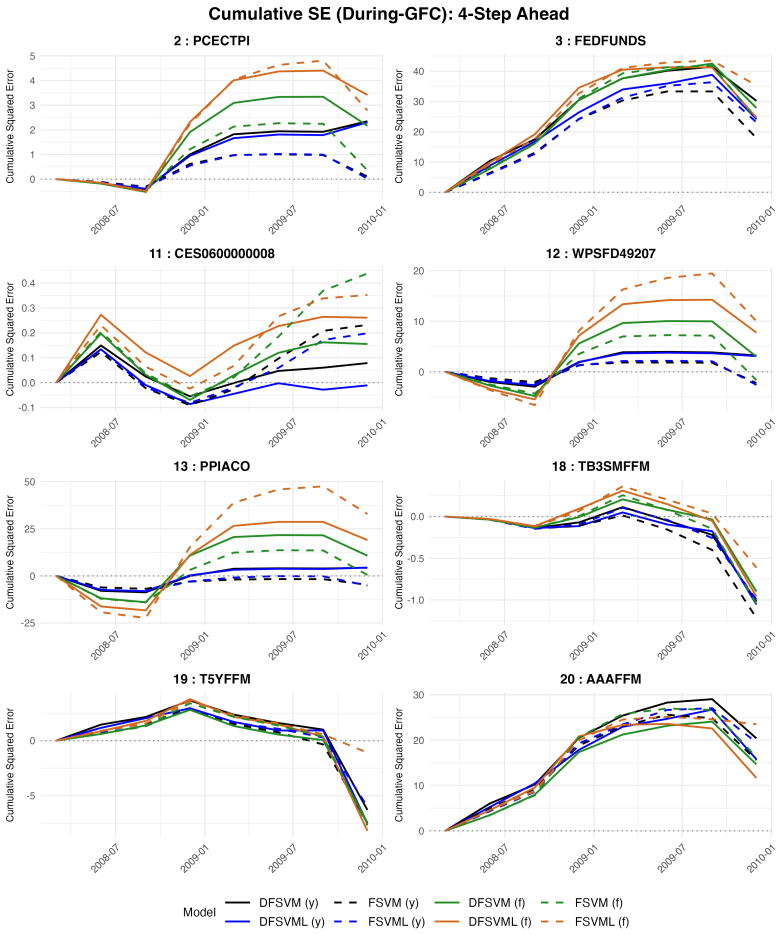
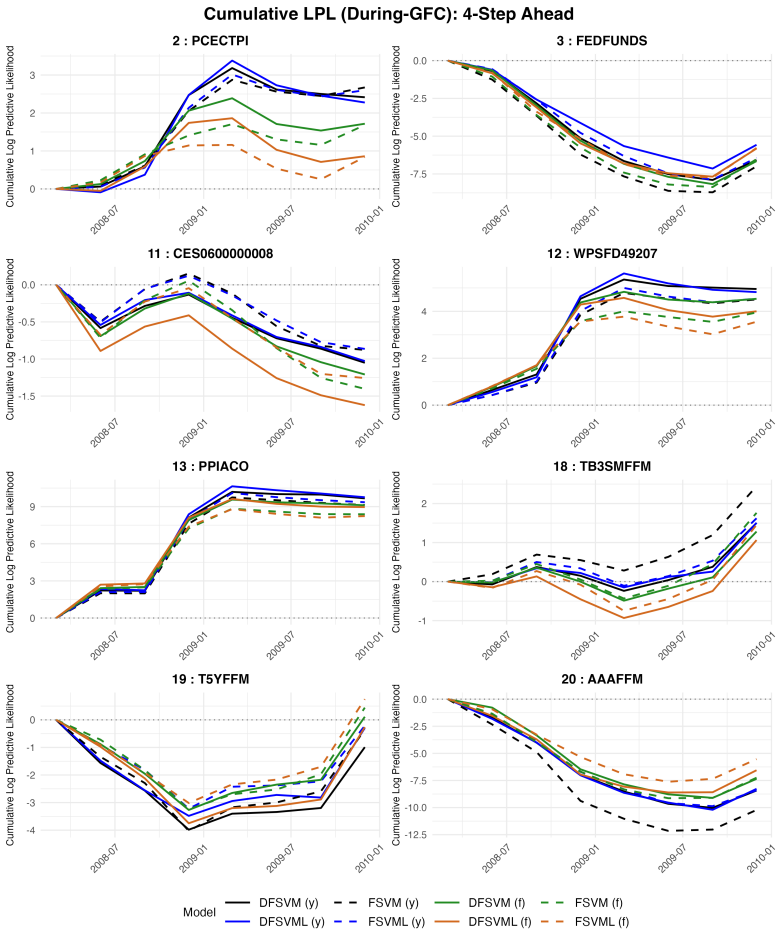
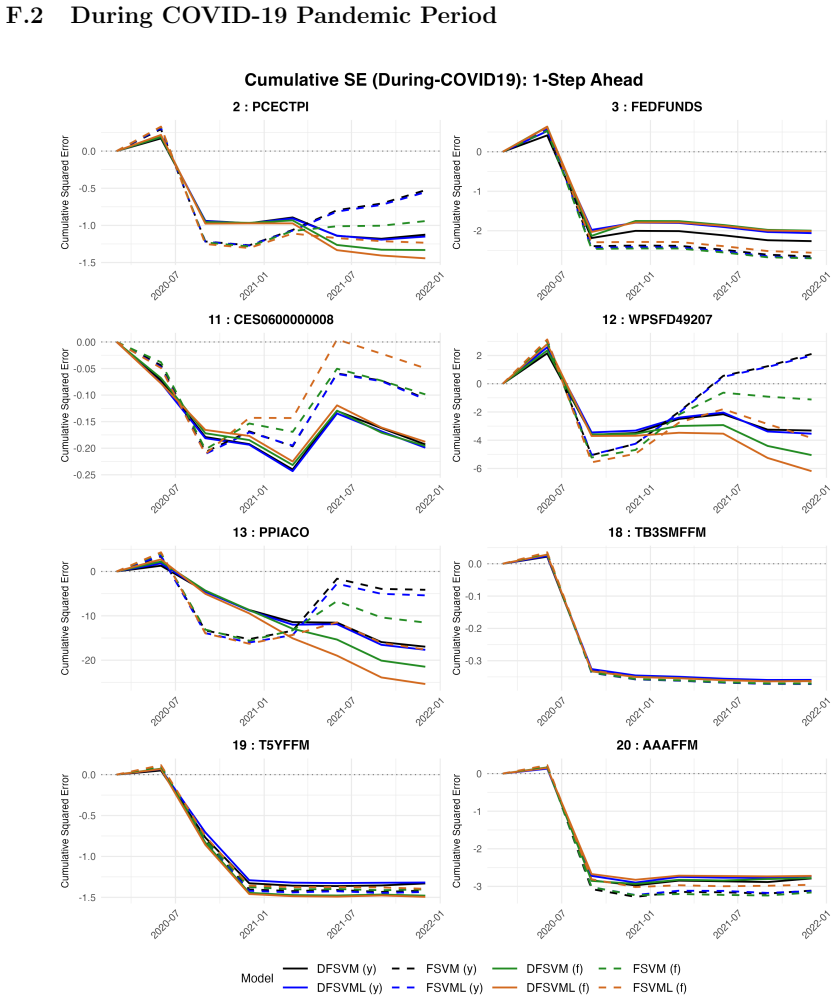
A dynamic factor stochastic volatility-in-mean VAR specification, in which latent volatility factors capture common conditional variance movements while volatility enters the conditional mean, delivers superior forecasts for more variables than a benchmark stochastic volatility VAR during the 2008 global financial crisis using quarterly FRED-QD data.
What carries the argument
The dynamic factor stochastic volatility-in-mean structure, which uses a small number of latent factors to drive common volatility dynamics and incorporates those volatilities into the VAR's conditional mean equations.
If this is right
- Forecast accuracy improves for a larger number of macroeconomic variables when volatility is allowed to influence expected outcomes directly.
- The model preserves computational tractability for panels with many variables despite the added mean channel.
- Time-varying uncertainty transmits to macroeconomic dynamics through both variance and mean effects.
- Markov chain Monte Carlo estimation remains feasible in this high-dimensional non-Gaussian setting.
Where Pith is reading between the lines
- Similar dynamic factor volatility-in-mean structures could be tested on other high-dimensional datasets or crisis periods to confirm the channel's importance.
- Policy analysis might benefit from simulating how changes in volatility expectations alter predicted paths for output and inflation.
- Extending the model to include more than a few latent volatility factors could reveal whether the common factors sufficiently capture all relevant volatility spillovers.
Load-bearing premise
The forecast gains arise specifically from the volatility-in-mean feature rather than from the dynamic factor structure or other implementation details.
What would settle it
Re-estimating the model without the volatility-in-mean channel on the same data and checking whether the superior performance during the 2008 crisis disappears.
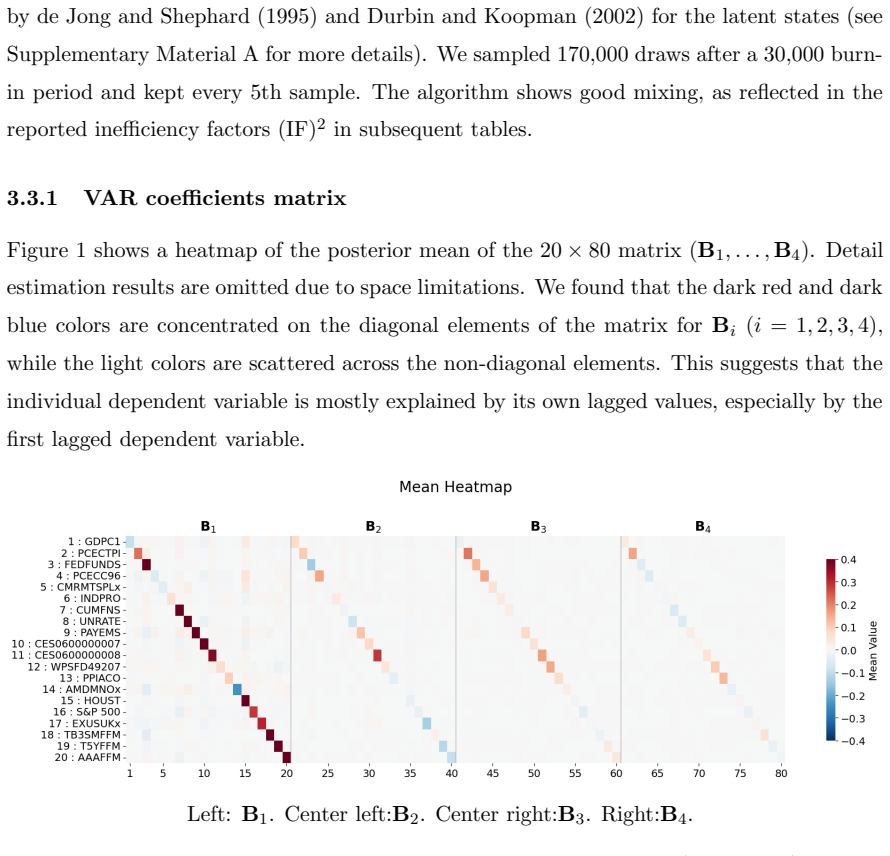
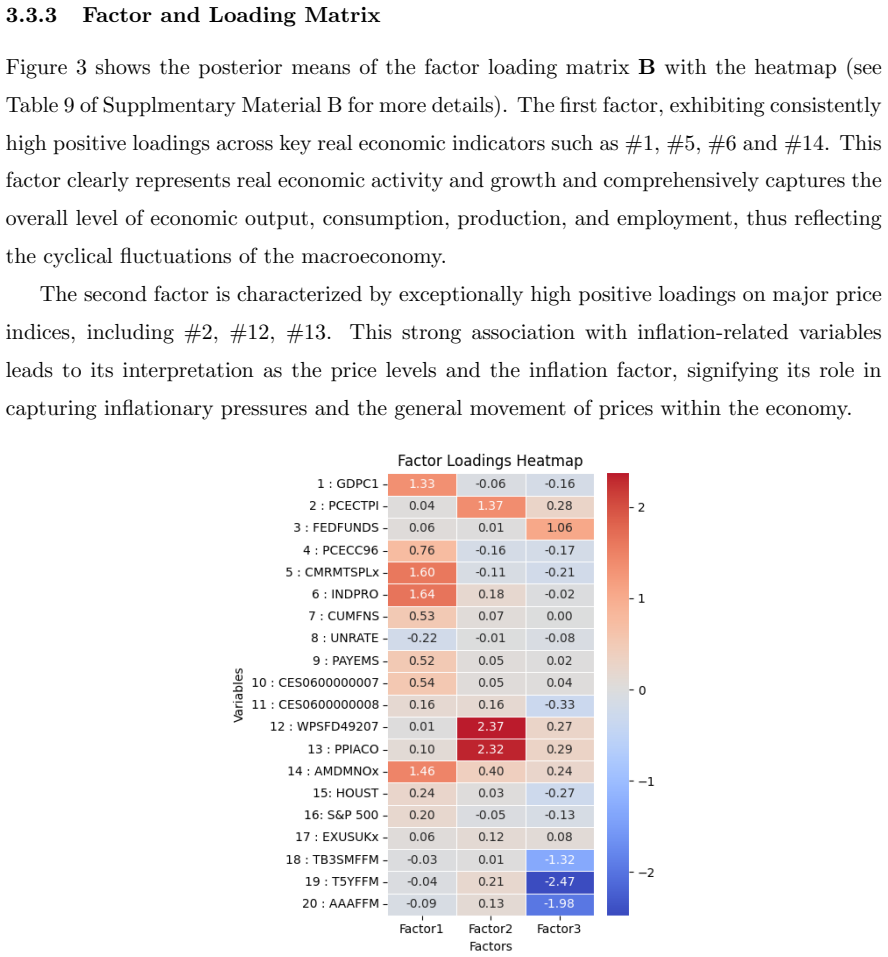
Figures
read the original abstract
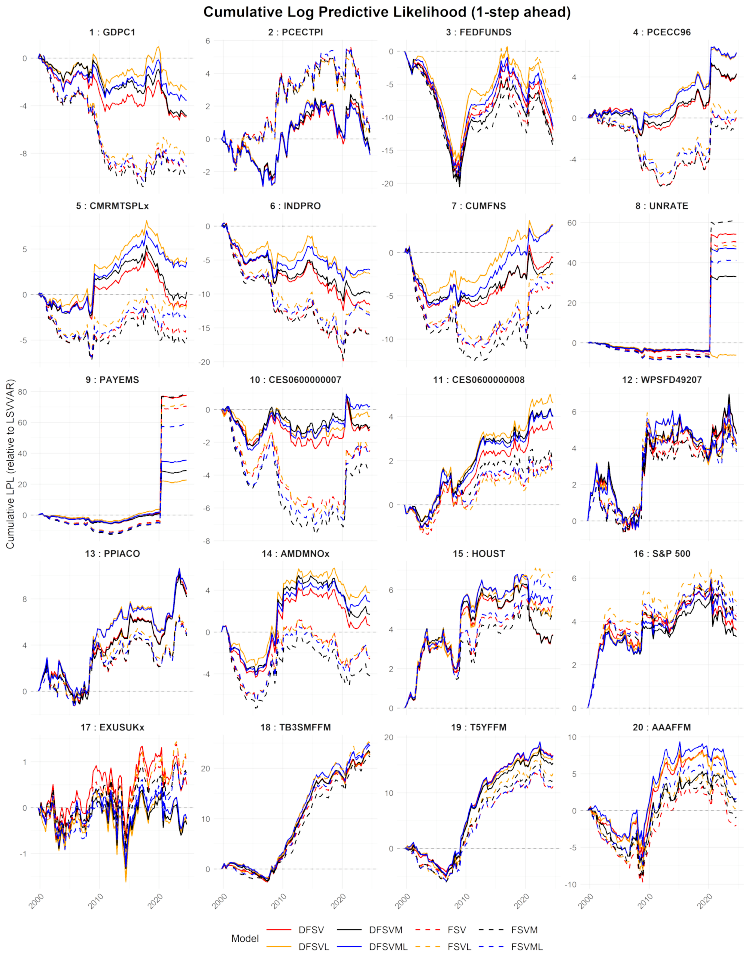
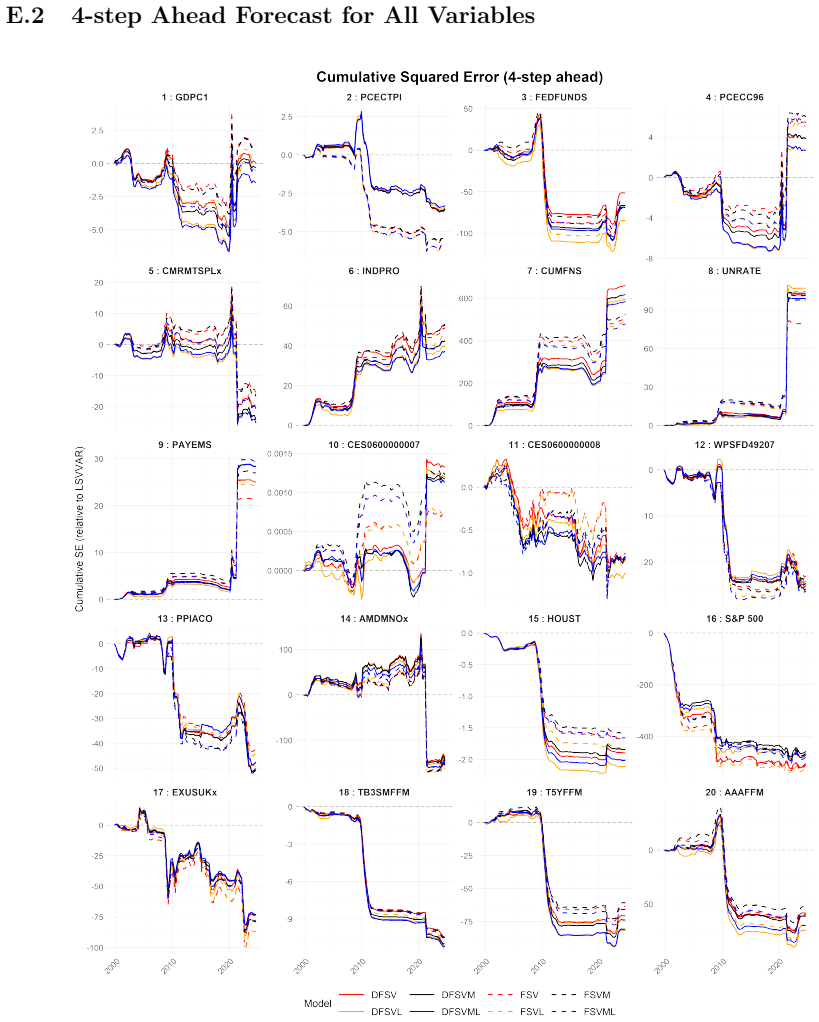
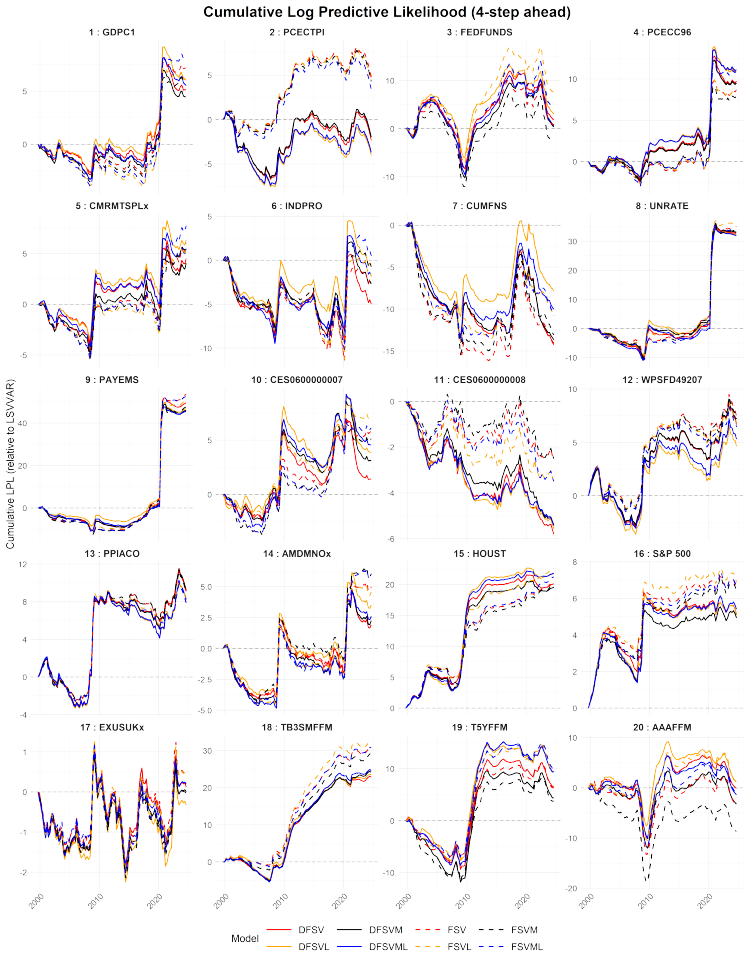
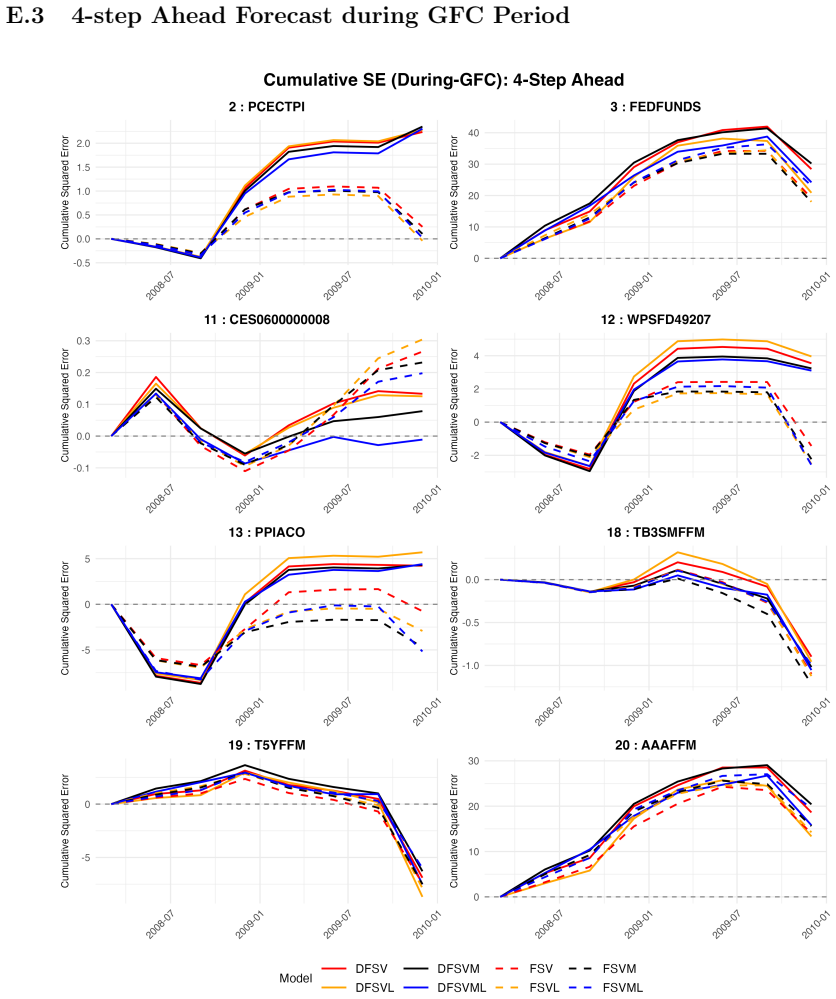
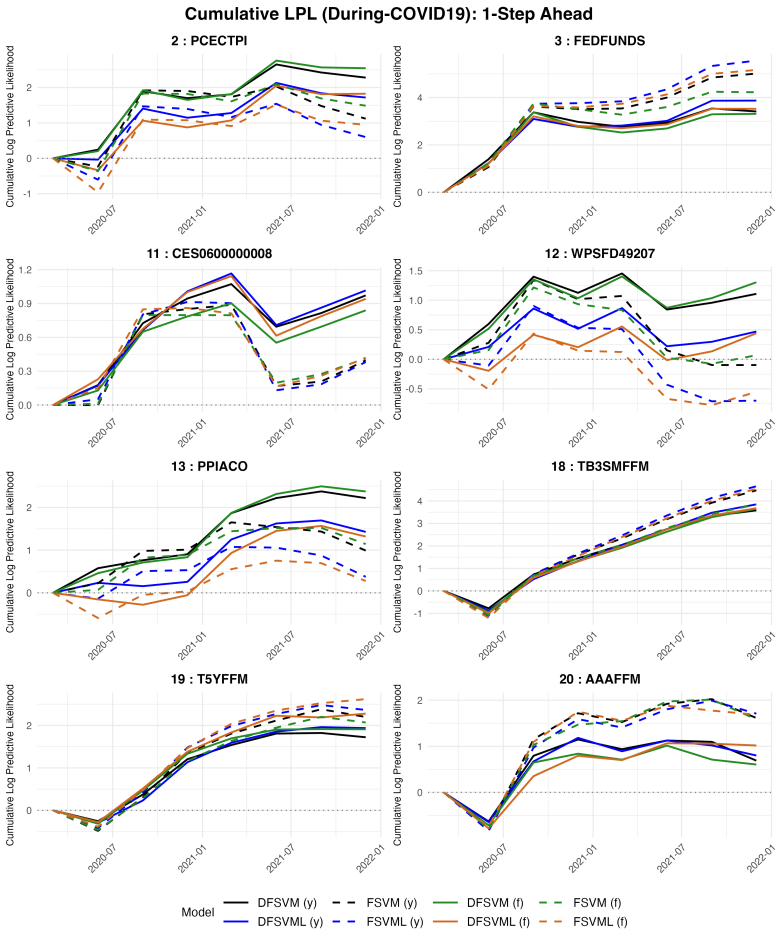
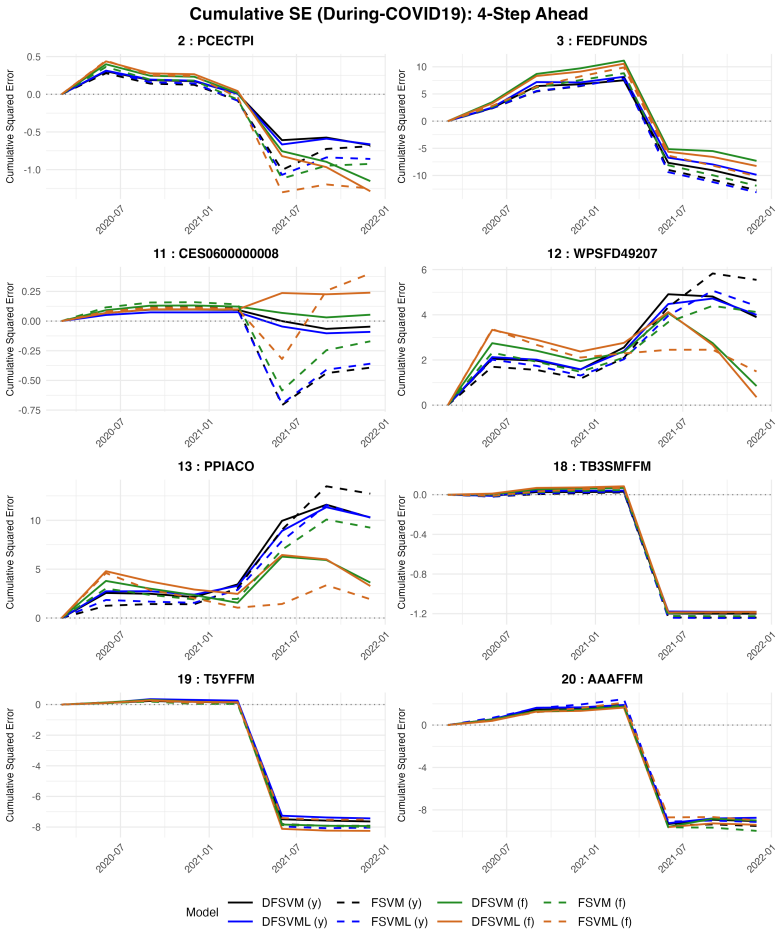
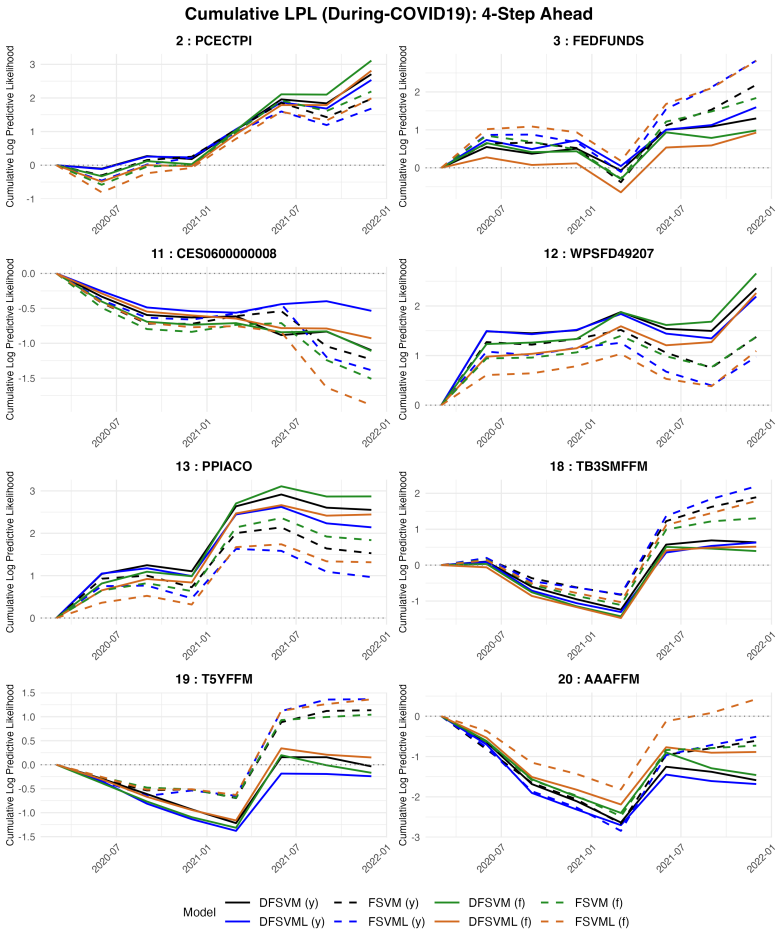
We develop a dynamic factor stochastic volatility-in-mean (SVM) specification for vector autoregressions (VARs) that embeds an SVM component within a dynamic factor stochastic volatility structure. A small number of latent volatility factors capture common movements in conditional variances, while volatility enters the conditional mean of the VAR. This specification allows time-varying uncertainty to influence macroeconomic dynamics through both second moments and expected outcomes while preserving tractability in large panels. We construct an efficient Markov chain Monte Carlo algorithm for estimation in this high-dimensional, non-Gaussian setting. Using quarterly data on twenty variables from the FRED-QD database, we compare predictive performance with the benchmark stochastic volatility VAR model. The dynamic factor SVM specification delivers superior forecasts for more variables during major macroeconomic disruptions such as the 2008 global financial crisis. The results indicate that allowing volatility to enter the mean captures an important transmission channel in macroeconomic dynamics.
Editorial analysis
A structured set of objections, weighed in public.
Referee Report
Summary. The paper develops a dynamic factor stochastic volatility-in-mean (SVM) VAR for large macroeconomic panels. A small number of latent volatility factors capture common conditional variance movements, volatility enters the conditional mean, and an efficient MCMC algorithm is constructed for estimation in high-dimensional non-Gaussian settings. On quarterly FRED-QD data for twenty variables, the model is reported to deliver superior out-of-sample forecasts relative to a standard stochastic volatility VAR benchmark, with gains concentrated during the 2008 global financial crisis.
Significance. If the reported forecast gains survive isolation of the volatility-in-mean channel and additional robustness checks, the specification would provide a tractable way to let time-varying uncertainty affect both second moments and expected outcomes in large panels. The dynamic factor structure on volatilities and the MCMC algorithm are practical contributions for high-dimensional macroeconometric modeling.
major comments (2)
- [Empirical results / forecast evaluation] Empirical application: the only benchmark reported is a standard stochastic volatility VAR. No results are shown for a dynamic factor stochastic volatility VAR that retains the latent volatility factors but removes the volatility-in-mean channel. Consequently, any improvement in 2008-crisis forecasts cannot be attributed specifically to volatility entering the conditional mean rather than to the factor structure on volatilities.
- [Abstract and empirical application] Forecast evaluation: the abstract states superior performance for more variables during the 2008 crisis but provides no details on exact variable selection from FRED-QD, the number of latent volatility factors retained, lag order, or robustness to alternative factor counts or prior specifications. These omissions make the central claim difficult to evaluate.
minor comments (1)
- [Abstract] The abstract would be clearer if it stated the number of latent volatility factors used and the precise out-of-sample evaluation window.
Simulated Author's Rebuttal
We thank the referee for the constructive comments. We address each major point below and have revised the manuscript to strengthen the empirical evidence and clarity of the claims.
read point-by-point responses
-
Referee: Empirical application: the only benchmark reported is a standard stochastic volatility VAR. No results are shown for a dynamic factor stochastic volatility VAR that retains the latent volatility factors but removes the volatility-in-mean channel. Consequently, any improvement in 2008-crisis forecasts cannot be attributed specifically to volatility entering the conditional mean rather than to the factor structure on volatilities.
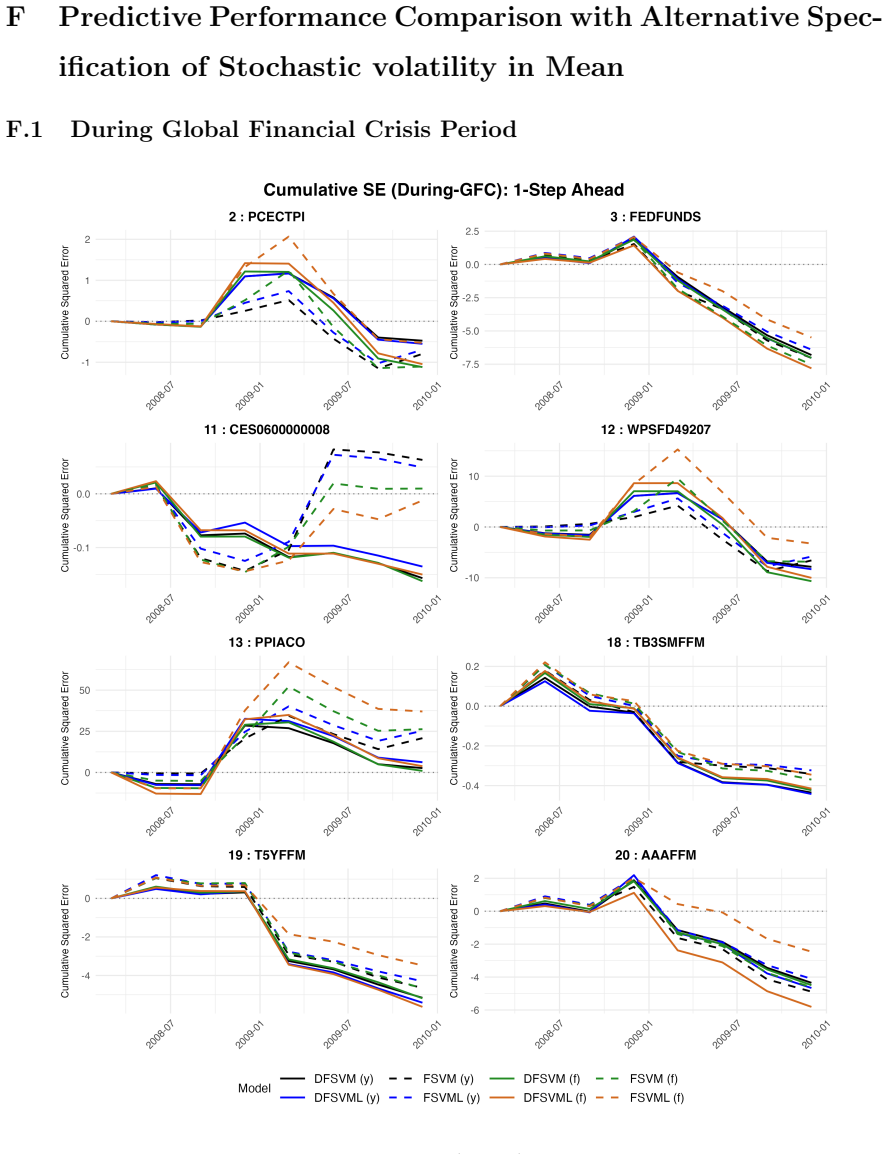
Authors: We agree that isolating the volatility-in-mean channel from the dynamic factor structure on volatilities is necessary to attribute forecast gains. In the revised manuscript we have added a dynamic factor stochastic volatility VAR (without the in-mean component) as an additional benchmark and report the corresponding out-of-sample results, which indicate that the in-mean channel contributes to the improvements observed during the 2008 crisis. revision: yes
-
Referee: Forecast evaluation: the abstract states superior performance for more variables during the 2008 crisis but provides no details on exact variable selection from FRED-QD, the number of latent volatility factors retained, lag order, or robustness to alternative factor counts or prior specifications. These omissions make the central claim difficult to evaluate.
Authors: We appreciate the referee highlighting these omissions. The revised abstract now specifies the use of twenty variables from FRED-QD, the number of retained latent volatility factors, and the lag order. We have also added a dedicated robustness subsection in the empirical application that examines sensitivity to alternative factor counts and prior specifications. revision: yes
Circularity Check
No circularity in derivation or forecast evaluation
full rationale
The paper specifies a new dynamic factor SVM VAR model, constructs an MCMC estimation algorithm, and evaluates out-of-sample predictive performance against an external benchmark SV VAR using FRED-QD data. No equations, fitting procedures, or self-citations are shown that reduce any claimed prediction or result to the model's inputs by construction. Forecasts are generated for future periods and compared to a separate benchmark model; the evaluation is statistically independent of the estimation step. The skeptic's concern about missing ablation studies for the volatility-in-mean channel identifies a potential limitation in experimental design but does not constitute a circular reduction of the derivation chain. This is a standard non-circular modeling and forecasting exercise.
Axiom & Free-Parameter Ledger
axioms (1)
- standard math Standard assumptions underlying VAR models and stochastic volatility processes hold.
invented entities (1)
-
Latent volatility factors
no independent evidence
Lean theorems connected to this paper
-
IndisputableMonolith/Foundation/RealityFromDistinction.leanreality_from_one_distinction unclear?
unclearRelation between the paper passage and the cited Recognition theorem.
dynamic factor stochastic volatility-in-mean (DFSVM) model... volatility enters the conditional mean... MCMC algorithm
-
IndisputableMonolith/Cost/FunctionalEquation.leanwashburn_uniqueness_aczel unclear?
unclearRelation between the paper passage and the cited Recognition theorem.
Λt = diag(exp(h1t/2),...,exp(hpt/2))... β scales the impact
What do these tags mean?
- matches
- The paper's claim is directly supported by a theorem in the formal canon.
- supports
- The theorem supports part of the paper's argument, but the paper may add assumptions or extra steps.
- extends
- The paper goes beyond the formal theorem; the theorem is a base layer rather than the whole result.
- uses
- The paper appears to rely on the theorem as machinery.
- contradicts
- The paper's claim conflicts with a theorem or certificate in the canon.
- unclear
- Pith found a possible connection, but the passage is too broad, indirect, or ambiguous to say the theorem truly supports the claim.
Reference graph
Works this paper leans on
-
[1]
Aguilar, O. and M. West (2000). Bayesian dynamic factor models and portfolio allocation.Journal of Business & Economic Statistics 18(3), 338–357. Arias, J. E., J. F. Rubio-Ramirez, and M. Shin (2023). Macroeconomic forecasting and variable ordering in multivariate stochastic volatility models.Journal of Econometrics 235(2), 1054–1086. Ba´ nbura, M., D. Gi...
work page 2000
-
[2]
Dynamic Factor Stochastic Volatility-in-Mean VAR for Large Macroeconomic Panels
Carriero, A., T. E. Clark, and M. Marcellino (2016). Common drifting volatility in large Bayesian VARs.Journal of Business & Economic Statistics 34(3), 375–390. Carriero, A., T. E. Clark, and M. Marcellino (2018). Measuring uncertainty and its impact on the economy.Review of Economics and Statistics 100(5), 799–815. Carriero, A., T. E. Clark, and M. Marce...
-
[3]
min ( 1, (1 +ψ † j)aψ−1(1−ψ † j)bψ−1 (1 +ψ j)aψ−1(1−ψ j)bψ−1 ) . Generation ofγ The conditional posterior distribution ofγisN q( ˆmγ, ˆSγ) where ˆmγ = ˆSγ ( nX t=1 (Iq −Ψ) ′Ω−1 2t {ft −Ψf t−1 −µ 2t}+S −1 γ mγ ) ˆSγ = nX t=1 (Iq −Ψ) ′Ω−1 2t (Iq −Ψ) +S −1 γ !−1 . Generation off Let us definez t to bez t =y t −PL ℓ=1 Bℓyt−ℓ. Givenhand parameters, the DFSVML ...
work page 1995
-
[4]
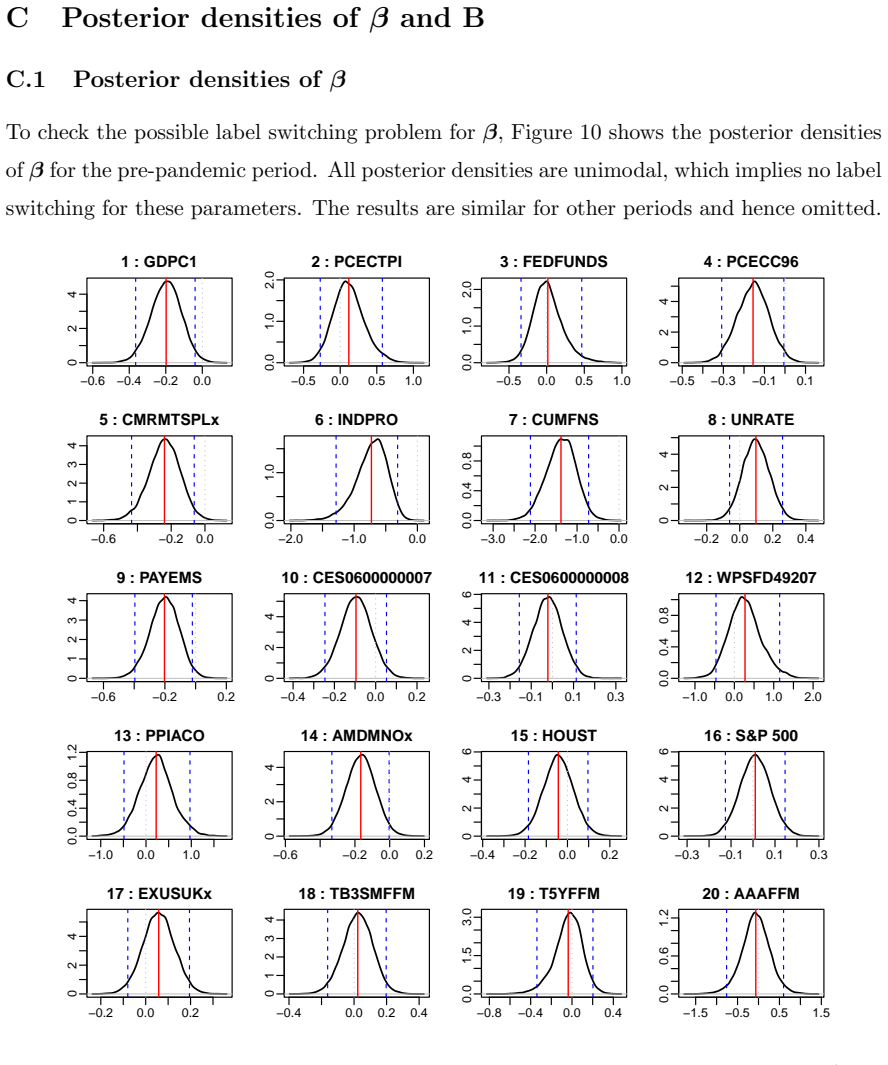
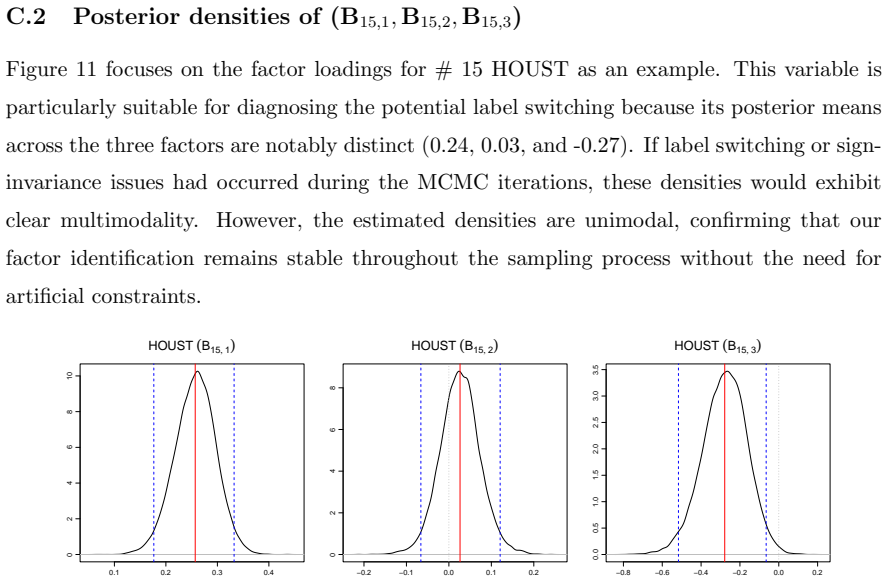
The unimodal posterior distributions confirm the stability of factor identification
Figure 11: Posterior densities of the selected factor loading elements for AMDMNOx (B15,1,B 15,2,B 15,3). The unimodal posterior distributions confirm the stability of factor identification. 8 D Prediction Procedure As pointed out in Kastner (2019), approximating the posterior predictive distribution by sampling future values of the latent factors can be ...
-
[5]
the model was included in the MCS. Further, Tables 19 through 22 report the detailed MCSp-values §. Those MCS results rein- force and extend the findings from the DM tests as follows: •Real activity variables such as #1 and #6, the LSVVAR benchmark typically remains in the MCS alongside the factor models (often withp-values of 1.000) with respect to the S...
discussion (0)
Sign in with ORCID, Apple, or X to comment. Anyone can read and Pith papers without signing in.