Probabilistic Frequency Hazard Analysis: Adapting the Seismic Hazard Framework to Power System Frequency Exceedance Risk
Pith reviewed 2026-05-10 18:38 UTC · model grok-4.3
The pith
A hazard-integral method adapted from earthquake engineering now computes annual power-system frequency exceedance risks with source disaggregation and uncertainty tracking.
A machine-rendered reading of the paper's core claim, the machinery that carries it, and where it could break.
Core claim
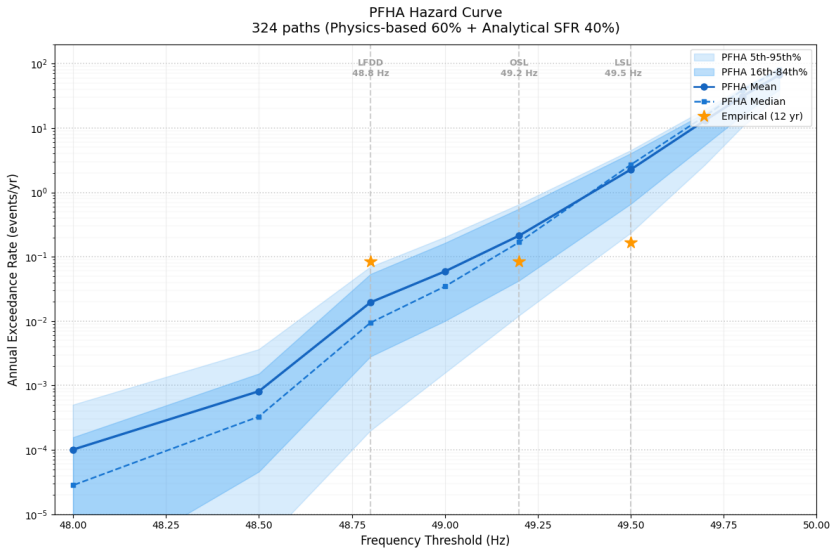
The PFHA hazard integral evaluates annual frequency exceedance rates by integrating over a 51-source catalogue drawn from operational records, empirical loss-size distributions taken from settlement-period data, Bayesian-estimated occurrence rates, and a dual analytical-plus-physics frequency-response model that carries calibrated aleatory variability; a 324-path logic tree captures epistemic uncertainty in every branch. When the integral is evaluated on four years of Great Britain operational data it produces exceedance rates at 49.2 Hz that lie within a factor of 1.5 of the independently produced Frequency Risk and Control Report while also quantifying the risk reduction delivered by both
What carries the argument
The PFHA hazard integral, which accumulates annual exceedance frequency by summing, over every combination of loss source, disturbance size, and system state, the probability that the frequency response equation predicts a nadir below a chosen threshold.
If this is right
- Continuous hazard curves replace the point-wise risk tables used in prior frequency assessments.
- Risk can be disaggregated by individual loss source and by operating state.
- The effect of specific frequency controls such as Dynamic Containment can be expressed directly as a reduction in annual exceedance rate.
- Epistemic uncertainty is carried forward through the logic tree so that final hazard values carry traceable confidence bounds.
Where Pith is reading between the lines
- The same integral structure could be reused for other grid quantities whose response can be predicted by a fast model, such as voltage dips or thermal loading.
- If the catalogue and response model are updated with live telemetry, the hazard curves could be refreshed in near real time for operational awareness.
- Scenario studies that lower inertia further would produce new hazard curves whose changes could be compared directly to current values.
Load-bearing premise
The frequency response prediction equation together with its calibrated aleatory variability term, the 51-source catalogue, and the empirical loss distributions must correctly describe the grid's behavior in every operating state and for every disturbance type that matters.
What would settle it
A multi-year record of measured frequency nadirs in the Great Britain system that yields an observed annual exceedance rate at 49.2 Hz differing by more than a factor of 1.5 from the model's output, or that shows control-measure risk reductions inconsistent with the calculated values.
Figures


read the original abstract
The declining synchronous inertia in power systems undergoing the energy transition increases the sensitivity of system frequency to generation and interconnector disturbances, making accurate frequency risk quantification increasingly important. Existing methods for frequency risk assessment, while valuable, lack formal uncertainty quantification, continuous hazard curves, and source-level disaggregation. This paper introduces Probabilistic Frequency Hazard Analysis (PFHA), a framework that adapts the mathematical architecture of Probabilistic Seismic Hazard Analysis (PSHA), the standard methodology in earthquake engineering, to power system frequency exceedance risk. The PFHA hazard integral computes annual exceedance rates by integrating over all combinations of loss sources, disturbance sizes, and system operating states through a frequency response prediction equation with calibrated aleatory variability. The framework is implemented with a 51-source catalogue constructed from operational data, empirical loss distributions from settlement-period generation records, Bayesian occurrence rate estimation, a dual analytical and physics-based frequency response prediction architecture, and a 324-path logic tree for epistemic uncertainty quantification. Application to the Great Britain power system using four years of operational data demonstrates agreement with the independently developed Frequency Risk and Control Report to within a factor of 1.5 at 49.2 Hz, while also quantifying the risk reduction from Dynamic Containment and Low-Frequency Demand Disconnection controls. To the author's knowledge, this is the first published explicit PSHA-style hazard-integral formulation for bulk power-system frequency exceedance risk.
Editorial analysis
A structured set of objections, weighed in public.
Referee Report
Summary. The paper introduces Probabilistic Frequency Hazard Analysis (PFHA) by adapting the mathematical structure of Probabilistic Seismic Hazard Analysis (PSHA) to compute annual exceedance rates for power system frequency deviations. It defines a hazard integral over a 51-source catalogue derived from operational data, empirical loss distributions, Bayesian occurrence rates, dual analytical/physics-based frequency response models incorporating calibrated aleatory variability, and a 324-path logic tree for epistemic uncertainty. The framework is applied to the Great Britain system using four years of data, demonstrating agreement within a factor of 1.5 with the independent Frequency Risk and Control Report at 49.2 Hz while quantifying risk reductions from controls such as Dynamic Containment and Low-Frequency Demand Disconnection. The authors claim this is the first explicit PSHA-style hazard-integral formulation for bulk power-system frequency exceedance risk.
Significance. If the implementation and validation hold under scrutiny, the work is significant for providing the first formal PSHA-adapted framework with continuous hazard curves, source disaggregation, and full uncertainty propagation for frequency risk assessment—an area where prior methods lack these features. The empirical agreement with an independent report offers direct support for applicability in low-inertia systems, and the ability to evaluate control benefits could aid planning during the energy transition. Strengths include the use of operational data for the catalogue and logic tree for epistemic uncertainties.
major comments (2)
- Abstract: The central validation claim of agreement with the Frequency Risk and Control Report to within a factor of 1.5 at 49.2 Hz is load-bearing for supporting the framework's accuracy, yet the description provides no explicit exceedance rate values being compared, no details on the frequency range or exact metric (e.g., mean annual frequency of exceedance), and no information on data exclusion rules or error propagation; this prevents full assessment of whether the match confirms the hazard integral's predictive capability across operating states.
- Frequency response prediction architecture (as described in the abstract and implementation summary): The dual analytical/physics-based models with calibrated aleatory variability form the core of the hazard integral, but without explicit equations, parameter values for the variability, or how they were fitted to the 51-source catalogue, the assumption that they capture behavior across all relevant disturbance types and operating states remains unverified and risks making exceedance rates dependent on fitted parameters rather than independent predictions.
minor comments (2)
- Abstract: The time period covered by the 'four years of operational data' should be specified (e.g., exact years) to allow readers to assess relevance to current system conditions.
- The 324-path logic tree is mentioned but its structure (e.g., which branches address which epistemic uncertainties) is not detailed in the summary, which would aid reproducibility.
Simulated Author's Rebuttal
We thank the referee for the thorough and constructive review. The comments highlight opportunities to improve the clarity of the abstract and implementation details, which we address below. We have prepared revisions that strengthen the manuscript without altering its core claims or results.
read point-by-point responses
-
Referee: Abstract: The central validation claim of agreement with the Frequency Risk and Control Report to within a factor of 1.5 at 49.2 Hz is load-bearing for supporting the framework's accuracy, yet the description provides no explicit exceedance rate values being compared, no details on the frequency range or exact metric (e.g., mean annual frequency of exceedance), and no information on data exclusion rules or error propagation; this prevents full assessment of whether the match confirms the hazard integral's predictive capability across operating states.
Authors: We agree that the abstract would be strengthened by greater specificity on the validation comparison. The body of the manuscript (Section 4) reports the explicit mean annual exceedance rates at 49.2 Hz from both PFHA and the independent Frequency Risk and Control Report, the factor-of-1.5 agreement, the use of the full four-year operational dataset, and the absence of additional exclusion rules beyond standard data processing. Error propagation is handled via the logic tree. To address the concern directly, we will revise the abstract to state the compared exceedance rate values, confirm the metric as mean annual frequency of exceedance, and note the data basis. This change improves self-containment while respecting abstract length limits. revision: yes
-
Referee: Frequency response prediction architecture (as described in the abstract and implementation summary): The dual analytical/physics-based models with calibrated aleatory variability form the core of the hazard integral, but without explicit equations, parameter values for the variability, or how they were fitted to the 51-source catalogue, the assumption that they capture behavior across all relevant disturbance types and operating states remains unverified and risks making exceedance rates dependent on fitted parameters rather than independent predictions.
Authors: The manuscript body (Section 3) presents the explicit equations for both the analytical swing-equation model and the physics-based dynamic model, the calibrated aleatory variability (including the standard deviation fitted to observed frequency deviations), and the fitting procedure against the 51-source catalogue events across disturbance sizes and operating states. These models were cross-validated on held-out events to ensure predictive capability independent of any single fit. We acknowledge that the abstract and implementation summary could reference these elements more explicitly. We will therefore revise the abstract to note the dual-model structure and direct readers to the equations and calibration details in the main text, and we will add a concise parameter summary table to the implementation section. This ensures the hazard integral's foundation is transparent without changing the results. revision: yes
Circularity Check
No circularity in PFHA hazard integral derivation
full rationale
The paper adapts the established PSHA hazard integral architecture to compute annual frequency exceedance rates via integration over a 51-source catalogue, empirical loss distributions, Bayesian rates, dual response models with calibrated aleatory variability, and a 324-path logic tree. This construction imports the integral form from external PSHA methodology rather than deriving it from the paper's own fitted parameters or data. The calibration of variability and use of operational data for inputs follow standard hazard analysis practice and do not reduce the central formulation or exceedance rates to tautological outputs by construction. Validation against the independent Frequency Risk and Control Report (agreement within factor of 1.5 at 49.2 Hz) provides external empirical support. No self-definitional equations, fitted inputs renamed as predictions, or load-bearing self-citations appear in the derivation chain.
Axiom & Free-Parameter Ledger
free parameters (1)
- aleatory variability parameters
axioms (1)
- domain assumption The mathematical architecture of Probabilistic Seismic Hazard Analysis can be directly adapted to compute frequency exceedance rates in power systems
Reference graph
Works this paper leans on
-
[1]
National Grid ESO, “System Inertia Monitoring,” Jun. 2021, nASPI Webinar, 30 June 2021
work page 2021
-
[2]
Frequency Risk and Control Report 2024,
National Energy System Operator, “Frequency Risk and Control Report 2024,” Great Britain, Mar. 2025
work page 2024
-
[3]
Technical Report on the Events of 9 August 2019,
National Grid ESO, “Technical Report on the Events of 9 August 2019,” Great Britain, Sep. 2019
work page 2019
-
[4]
Review of NESO’s Frequency Containment Provisions and the Frequency Risk and Control Report 2025,
Ofgem, “Review of NESO’s Frequency Containment Provisions and the Frequency Risk and Control Report 2025,” 2025, consultant review commissioned by Ofgem
work page 2025
-
[5]
Power System Frequency Risk Review: 2022 Final Re- port,
Australian Energy Market Operator, “Power System Frequency Risk Review: 2022 Final Re- port,” Jul. 2022
work page 2022
-
[6]
General Power System Risk Review 2025,
——, “General Power System Risk Review 2025,” 2025
work page 2025
-
[7]
Inertia and Rate of Change of Frequency (RoCoF),
ENTSO-E, “Inertia and Rate of Change of Frequency (RoCoF),” ENTSO-E, Tech. Rep., Dec. 2021, project Inertia Phase I
work page 2021
-
[8]
——, “Project Inertia Phase II: Updated Frequency Stability Analysis in Long-Term Scenarios, Relevant Solutions and Mitigation Measures,” ENTSO-E, Tech. Rep., Nov. 2023
work page 2023
-
[9]
Probabilistic assessment on area-level frequency nadir/vertex for operational planning,
J. Wen, S. Bu, and H. Xin, “Probabilistic assessment on area-level frequency nadir/vertex for operational planning,” IEEE Open Access Journal of Power and Energy , vol. 8, pp. 341–351, 2021
work page 2021
-
[10]
J. V. Milanović, “Probabilistic stability analysis: The way forward for stability analysis of sustainable power systems,” Philosophical Transactions of the Royal Society A , vol. 375, no. 2100, p. 20160296, 2017
work page 2017
-
[11]
U. Shahzad, “A probabilistic framework for power system large-disturbance global instabil- ity risk assessment in the presence of renewable wind generation,” arXiv preprint , 2022, arXiv:2205.03629
-
[12]
Trial Implementation of the High-Impact, Low-Frequency Power Grid Events Risk Framework,
M. Vlachopoulou et al., “Trial Implementation of the High-Impact, Low-Frequency Power Grid Events Risk Framework,” Pacific Northwest National Laboratory, Richland, W A, USA, Tech. Rep. PNNL-25667, 2016
work page 2016
-
[13]
R. Billinton and R. N. Allan, Reliability Evaluation of Power Systems , 2nd ed. New York, NY, USA: Plenum, 1996. 27
work page 1996
-
[14]
Li, Risk Assessment of Power Systems: Models, Methods, and Applications
W. Li, Risk Assessment of Power Systems: Models, Methods, and Applications . Piscataway, NJ, USA: IEEE Press, 2005
work page 2005
-
[15]
Kundur, Power System Stability and Control
P. Kundur, Power System Stability and Control . New York, NY, USA: McGraw-Hill, 1994
work page 1994
-
[16]
Milano, Power System Modelling and Scripting
F. Milano, Power System Modelling and Scripting . Berlin, Germany: Springer, 2010
work page 2010
-
[17]
Engineering seismic risk analysis,
C. A. Cornell, “Engineering seismic risk analysis,” Bulletin of the Seismological Society of America, vol. 58, no. 5, pp. 1583–1606, Oct. 1968
work page 1968
-
[18]
J. W. Baker, B. A. Bradley, and P. J. Stafford, Seismic Hazard and Risk Analysis . Cambridge, U.K.: Cambridge University Press, 2021
work page 2021
-
[19]
An Introduction to Probabilistic Seismic Hazard Analysis,
J. W. Baker, “An Introduction to Probabilistic Seismic Hazard Analysis,” 2013, white paper, version 2.0.1
work page 2013
-
[20]
Senior Seismic Hazard Analysis Committee, “Recommendations for Probabilistic Seismic Haz- ard Analysis: Guidance on Uncertainty and Use of Experts,” 1997, NUREG/CR-6372
work page 1997
-
[21]
Probabilistic Tsunami Hazard Analysis: Multiple Sources and Global Appli- cations,
A. Grezio et al. , “Probabilistic Tsunami Hazard Analysis: Multiple Sources and Global Appli- cations,” Reviews of Geophysics , vol. 55, no. 4, pp. 1158–1198, Dec. 2017
work page 2017
-
[22]
Probabilistic eruption forecasting at short and long time scales,
W. Marzocchi and G. Bebbington, “Probabilistic eruption forecasting at short and long time scales,” Bulletin of Volcanology , vol. 74, no. 8, pp. 1777–1805, 2012
work page 2012
-
[23]
A low-order system frequency response model,
P. M. Anderson and A. A. Mirheydar, “A low-order system frequency response model,” IEEE Transactions on Power Systems , vol. 5, no. 3, pp. 720–729, Aug. 1990
work page 1990
-
[24]
Enduring Auction Capability (EAC) — Market Informa- tion,
National Energy System Operator, “Enduring Auction Capability (EAC) — Market Informa- tion,” 2024. 28
work page 2024
discussion (0)
Sign in with ORCID, Apple, or X to comment. Anyone can read and Pith papers without signing in.