Wall heat transfer and flow field configuration of shock wave-turbulent boundary layer interactions on cryogenically cooled wall
Pith reviewed 2026-05-10 18:44 UTC · model grok-4.3
The pith
Cryogenic temperature-sensitive paint shows cooling shifts the separation point downstream and cuts heat flux in Mach 2 shock wave-turbulent boundary layer interactions.
A machine-rendered reading of the paper's core claim, the machinery that carries it, and where it could break.
Core claim
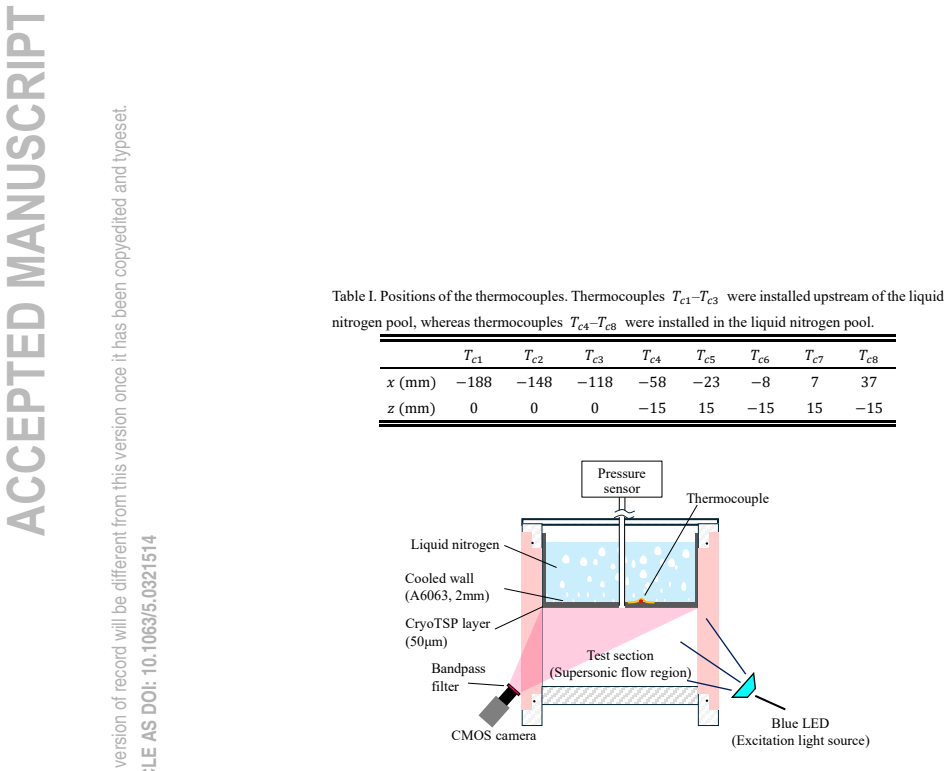
In Mach 2.0 experiments the wall is cooled to a wall-to-recovery temperature ratio of 0.34. Oil-flow images and surface-temperature maps confirm quasi-two-dimensional flow near the tunnel centerline. Schlieren pictures and pressure distributions show the separation point shifting downstream under the cooled condition. Temperature data from the paint indicate reduced wall heat flux at separation due to flow leaving the wall. Peak pressure and heat flux ratios, when normalized by upstream values, follow the same trends reported for prior cooled-wall cases. These measurements establish that cryogenic temperature-sensitive paint can relate flow-field configuration to heat transfer on cryogenogen
What carries the argument
Cryogenic temperature-sensitive paint applied to the cooled wall surface, which converts measured temperature distributions into heat-flux maps that align with the observed separation and reattachment lines.
If this is right
- The separation point in an incident-reflected shock wave-turbulent boundary layer interaction moves downstream when the wall temperature ratio drops to 0.34.
- Wall heat flux at the separation location decreases because the flow leaves the surface outward.
- Normalized peak wall pressure and heat flux ratios remain consistent with data from earlier cooled-wall experiments.
- Cryogenic temperature-sensitive paint provides temperature distributions that can be used to infer the spatial variation of heat transfer across the interaction region.
Where Pith is reading between the lines
- The same paint technique could be extended to measure heat transfer in other high-speed flows where wall cooling is used to reduce thermal loads.
- Larger downstream shifts in separation might appear at even lower wall temperatures, altering both skin friction and overall drag on the surface.
- Coupling these heat-flux maps with numerical simulations would allow direct validation of turbulence models under strong wall-temperature gradients.
Load-bearing premise
The paint calibration stays accurate at cryogenic temperatures and the recorded temperature patterns translate directly into heat flux without major errors from paint thickness, lighting, or low-temperature response changes.
What would settle it
A repeat test at the same Mach number but with the wall at room temperature that shows the separation point at the identical streamwise location as the cryogenic case, or independent thin-film heat-flux sensors placed at the separation point that record no reduction when the wall is cooled.
Figures


read the original abstract
In this study, we experimentally investigated the wall heat transfer and flow field configuration of incident-reflected shock wave-turbulent boundary layer interactions on a cooled wall in supersonic flow. Wind tunnel experiments were conducted at a Mach number of 2.0 and a total temperature of 289 K. To create a cooled-wall state, the wind tunnel wall was cooled to a cryogenic temperature using liquid nitrogen at 77.4 K. In addition to conventional measurements, such as the schlieren visualization method and pressure measurements, cryogenic temperature-sensitive paint was employed to clarify the relationship between the flow field configuration and wall heat flux on a cryogenically cooled wall. The wall surface temperature of the cryogenically cooled wall was 95 K, corresponding to a wall-to-recovery temperature ratio of 0.34. The oil flow image and wall surface temperature distribution indicated a quasi-two-dimensional flow at the center of the wind tunnel. The schlieren images and wall pressure distributions showed that the separation point under the cooled-wall condition shifted downstream compared with that under the uncooled-wall condition. Based on the temperature distribution obtained from the cooled-wall experiments, the wall heat flux at the separation point reduced due to the outward flow from the wall. The peak wall pressure ratio and wall heat flux ratio normalized by their upstream values exhibited trends consistent with previously reported data under the cooled-wall condition. These results suggest that the cryogenic temperature-sensitive paint is a powerful tool for investigating the effects of wall temperature on the shock wave-turbulent boundary layer interactions on cryogenically cooled walls.
Editorial analysis
A structured set of objections, weighed in public.
Referee Report
Summary. The manuscript reports wind-tunnel experiments at Mach 2.0 on incident-reflected shock wave-turbulent boundary layer interactions over a cryogenically cooled wall (Tw = 95 K, Tw/Tr = 0.34). Using schlieren, wall-pressure measurements, oil-flow visualization, and cryogenic temperature-sensitive paint (TSP), the authors observe a downstream shift of the separation point under cooled-wall conditions relative to uncooled conditions and infer a reduction in wall heat flux at separation from the TSP temperature distribution, attributing it to outward flow from the wall. Peak pressure and heat-flux ratios normalized by upstream values are stated to follow trends consistent with prior cooled-wall data, leading to the conclusion that cryogenic TSP is a powerful tool for investigating wall-temperature effects in SWTBLI.
Significance. If the TSP-derived heat-flux inferences hold after calibration validation, the work supplies new experimental observations on the influence of strong wall cooling (Tw/Tr = 0.34) on separation location and heat transfer in supersonic SWTBLI, conditions relevant to hypersonic applications. The confirmation of quasi-two-dimensional flow at the tunnel centerline and the use of liquid-nitrogen cooling to 95 K constitute useful additions to the experimental database, while the consistency with existing pressure-ratio trends provides a modest cross-check on the conventional diagnostics.
major comments (2)
- [Abstract] Abstract: the inference that 'the wall heat flux at the separation point reduced due to the outward flow from the wall' is drawn directly from the TSP temperature distribution, yet the manuscript provides no calibration curve at 95 K, no uncertainty quantification, no correction for paint thickness or illumination non-uniformity, and no cross-validation against embedded sensors. This step is load-bearing for the central methodological claim that cryogenic TSP enables reliable heat-flux mapping.
- [Results] Results section (implied by abstract): the abstract reports only qualitative trends and 'consistency with previously reported data' without supplying quantitative values, error bars, or tabulated separation locations and heat-flux ratios, preventing assessment of the magnitude of the observed downstream shift or the strength of the heat-flux reduction.
minor comments (2)
- The methods section should explicitly describe the cryogenic TSP formulation, illumination source, image-acquisition settings, and any temperature-dependent corrections applied to the luminescent response.
- Figure captions and text should clarify whether the reported temperature maps are instantaneous or time-averaged and whether any spatial filtering was applied before inferring heat flux.
Simulated Author's Rebuttal
We thank the referee for the constructive and detailed comments. We address each major point below and have revised the manuscript to strengthen the presentation of the TSP methodology and quantitative results.
read point-by-point responses
-
Referee: [Abstract] Abstract: the inference that 'the wall heat flux at the separation point reduced due to the outward flow from the wall' is drawn directly from the TSP temperature distribution, yet the manuscript provides no calibration curve at 95 K, no uncertainty quantification, no correction for paint thickness or illumination non-uniformity, and no cross-validation against embedded sensors. This step is load-bearing for the central methodological claim that cryogenic TSP enables reliable heat-flux mapping.
Authors: We agree that the abstract is too concise on this point and that the manuscript body should have made the supporting details more prominent. The TSP measurements were calibrated over the relevant cryogenic range, including at 95 K, with corrections applied for paint thickness and illumination; however, these were not explicitly summarized. In revision we have added a dedicated subsection on cryogenic TSP calibration, including the curve at 95 K, uncertainty estimates, thickness/illumination corrections, and cross-checks against the wall-pressure distributions. These additions directly support the heat-flux inference. revision: yes
-
Referee: [Results] Results section (implied by abstract): the abstract reports only qualitative trends and 'consistency with previously reported data' without supplying quantitative values, error bars, or tabulated separation locations and heat-flux ratios, preventing assessment of the magnitude of the observed downstream shift or the strength of the heat-flux reduction.
Authors: We accept that quantitative values and uncertainties are needed for proper evaluation. The revised manuscript now includes tabulated separation locations (with and without cooling), peak pressure and heat-flux ratios normalized by upstream values, and error bars derived from repeated runs and sensor uncertainties. These data are presented both in the text and in a new summary table to allow direct assessment of the downstream shift magnitude and heat-flux reduction. revision: yes
Circularity Check
No circularity: purely experimental observations with direct measurements
full rationale
The paper reports wind-tunnel experiments at Mach 2 using schlieren imaging, surface pressure taps, oil-flow visualization, and cryogenic TSP to map wall temperature on a liquid-nitrogen-cooled surface (Tw = 95 K). All stated results—the downstream shift of separation, reduced heat flux inferred from the TSP temperature field, and consistency with prior cooled-wall data—are presented as direct empirical outcomes without equations, fitted parameters, self-citations that carry the central claim, or any derivation that reduces to its own inputs by construction. The methodology is self-contained against external benchmarks (standard optical and pressure diagnostics) and contains no load-bearing self-referential steps.
Axiom & Free-Parameter Ledger
axioms (2)
- domain assumption Cryogenic temperature-sensitive paint provides accurate quantitative heat flux from surface temperature distributions at 95 K.
- domain assumption Oil flow and temperature images confirm quasi-two-dimensional flow at tunnel centerline.
Reference graph
Works this paper leans on
-
[2]
(North American Aviation, 1962). 10 J.W. Schaefer, and H. Ferguson, “Investigation of Separation and Associated Heat Transfer and Pressure Distribution on Cone-Cylinder-Flare Configurations at Mach Five,” ARS J. 32(5), 762–770 (1962). 11 R.C. Hastings, C.S. Brown, and S. Atkinson, Heat Transfer in the Vicinity of a 15 Degrees Compression Corner at Mach Nu...
discussion (0)
Sign in with ORCID, Apple, or X to comment. Anyone can read and Pith papers without signing in.