Eliciting core spatial association from spatial time series: a random matrix approach
Pith reviewed 2026-05-10 17:42 UTC · model grok-4.3
The pith
A random matrix theory framework isolates core spatial association in time series by trimming temporal signals.
A machine-rendered reading of the paper's core claim, the machinery that carries it, and where it could break.
Core claim
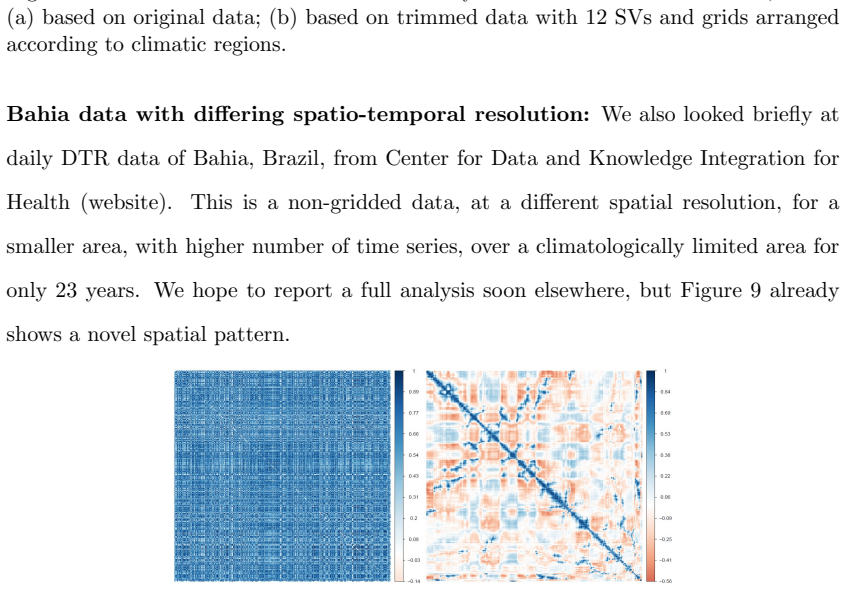
We introduce a Random Matrix Theory (RMT)-based framework to isolate core spatial association by suitably trimming out strong but routine temporal signals while preserving spatial signals. Our pipeline introduces Hilbert space filling curve technique and Bergsma's correlation measure of statistical dependence, to climate modelling. Applied to the diurnal temperature range (DTR) data of India (1951-2022), the method reveals distinct spatial anomalies shaped by topography, mesoclimate, and urbanization. The approach uncovers temporal evolution in spatial dependence and demonstrates how regional climate variability is structured by both physical geography and anthropogenic influences.
What carries the argument
The RMT-based framework for trimming strong temporal signals to reveal core spatial association, augmented with Hilbert space filling curves and Bergsma's correlation.
If this is right
- The method can uncover spatial anomalies in climate data shaped by topography, mesoclimate, and urbanization.
- It reveals the temporal evolution of spatial dependence patterns.
- The framework offers a statistical foundation for predictive modelling in climate contexts.
- It is applicable to diverse spatio-temporal datasets beyond the Indian DTR example.
Where Pith is reading between the lines
- This trimming technique could help disentangle signals in other fields that collect data over both space and time, such as regional economics.
- Future applications might examine whether the identified spatial anomalies predict future climate shifts in the same regions.
- The method's ability to preserve spatial signals while removing temporal ones suggests it could improve the accuracy of climate models that incorporate geographic factors.
Load-bearing premise
Strong temporal signals identified through random matrix theory can be trimmed from the data without removing or distorting the underlying genuine spatial dependence.
What would settle it
Generate synthetic spatial time series data where spatial associations are known independently of temporal trends, apply the framework, and check whether the output core spatial association matches the known spatial structure exactly; mismatch would falsify the isolation claim.
Figures


read the original abstract
Spatial time series (STS) data are fundamental to climate science, yet conventional approaches often conflate temporal co-evolution with genuine spatial dependence, obscuring subtle but critical climatic anomalies. We introduce a Random Matrix Theory (RMT)-based framework to isolate "core spatial association" by suitably trimming out strong but routine temporal signals while preserving spatial signals. Our pipeline introduces Hilbert space filling curve technique and Bergsma's correlation measure of statistical dependence, to climate modelling. Applied to the diurnal temperature range (DTR) data of India (1951-2022), the method reveals distinct spatial anomalies shaped by topography, mesoclimate, and urbanization. The approach uncovers temporal evolution in spatial dependence and demonstrates how regional climate variability is structured by both physical geography and anthropogenic influences. Beyond the Indian application, the framework is broadly applicable to diverse spatio-temporal datasets, offering a robust statistical foundation for predictive modelling, resilience planning, and policy design in the context of accelerating climate change.
Editorial analysis
A structured set of objections, weighed in public.
Referee Report
Summary. The manuscript introduces a Random Matrix Theory (RMT)-based framework for isolating 'core spatial association' from spatial time series (STS) data. By applying Hilbert space-filling curve ordering and Bergsma's correlation measure, the method trims strong but routine temporal signals from the data matrix while aiming to preserve spatial dependence structures. The approach is demonstrated on diurnal temperature range (DTR) data across India from 1951 to 2022, where it identifies spatial anomalies influenced by topography, mesoclimate, and urbanization, and tracks the temporal evolution of these spatial patterns. The framework is positioned as applicable to various spatio-temporal datasets for climate modeling and policy.
Significance. If the central claim holds—that the RMT trimming cleanly separates temporal co-evolution from spatial associations without introducing artifacts—this could provide a valuable tool for climate scientists analyzing complex STS data. The application to Indian DTR data suggests potential insights into regional climate variability driven by physical and anthropogenic factors. However, without detailed mathematical derivations, simulation validations, or comparisons to existing methods, the significance remains potential rather than demonstrated. The introduction of Hilbert curves and Bergsma correlation to this context is novel but requires substantiation.
major comments (2)
- [§3 (Methodology)] §3 (Methodology): The description of the RMT trimming step does not include the specific criterion for identifying and removing the 'strong but routine temporal signals' (e.g., the eigenvalue threshold relative to the Marchenko-Pastur law), nor does it provide an analytic bound or controlled simulation demonstrating that this removal leaves the spatial dependence intact when temporal and spatial components share drivers such as topography. This separation is load-bearing for the central claim.
- [§4 (Application)] §4 (Application): No quantitative validation metrics (e.g., comparison to baselines such as standard spatial autocorrelation measures, error analysis, or cross-validation scores) are reported for the claimed spatial anomalies in the Indian DTR data. The results are presented only qualitatively, which prevents assessment of whether the post-trim matrix preserves original spatial associations or introduces artifacts from the Hilbert ordering or Bergsma measure.
minor comments (2)
- [Abstract and §1] The abstract and introduction introduce the term 'core spatial association' without an explicit mathematical definition in terms of the trimmed correlation matrix; a precise definition would improve clarity.
- [Figures and §4] Figure captions and the results section should include the exact parameters used for Hilbert curve ordering and the dimension of the data matrix to allow reproducibility.
Simulated Author's Rebuttal
We thank the referee for their constructive and detailed report. We address each major comment below and outline revisions that will strengthen the manuscript while preserving its core contributions.
read point-by-point responses
-
Referee: [§3 (Methodology)] The description of the RMT trimming step does not include the specific criterion for identifying and removing the 'strong but routine temporal signals' (e.g., the eigenvalue threshold relative to the Marchenko-Pastur law), nor does it provide an analytic bound or controlled simulation demonstrating that this removal leaves the spatial dependence intact when temporal and spatial components share drivers such as topography. This separation is load-bearing for the central claim.
Authors: We appreciate this observation on the methodology section. The trimming criterion follows the Marchenko-Pastur upper bound for the bulk spectrum of the correlation matrix; eigenvalues exceeding this threshold are removed as dominant temporal signals. In the revised manuscript we will state this threshold explicitly, including the analytic expression for the MP edge. A complete analytic bound separating temporal and spatial components under shared drivers (e.g., topography) is difficult to derive because Bergsma correlation is rank-based and non-linear. However, we will add controlled simulation experiments in the supplementary material: synthetic STS matrices are generated with known temporal co-evolution and spatial dependence sharing topography-like structure, the full pipeline is applied, and preservation of spatial associations is verified by comparing pre- and post-trim Bergsma matrices together with recovery of injected spatial patterns. These simulations will directly test the load-bearing separation claim. revision: partial
-
Referee: [§4 (Application)] No quantitative validation metrics (e.g., comparison to baselines such as standard spatial autocorrelation measures, error analysis, or cross-validation scores) are reported for the claimed spatial anomalies in the Indian DTR data. The results are presented only qualitatively, which prevents assessment of whether the post-trim matrix preserves original spatial associations or introduces artifacts from the Hilbert ordering or Bergsma measure.
Authors: We agree that quantitative metrics are needed to substantiate the application results. The revised manuscript will add direct comparisons of spatial autocorrelation (Moran’s I and Geary’s C) computed on the original versus post-trim matrices to quantify preservation of spatial structure. Bootstrap resampling (1000 replicates) will be used to attach standard errors to the reported spatial anomalies and their temporal evolution. A temporal hold-out validation will be included by fitting the pipeline on 1951–2014 data and evaluating stability of the identified anomalies on 2015–2022 data. These additions will allow readers to assess fidelity and any potential artifacts introduced by Hilbert ordering or the Bergsma measure. revision: yes
Circularity Check
No significant circularity in RMT trimming pipeline for spatial associations
full rationale
The paper defines a pipeline that forms a correlation matrix from spatial time series, applies RMT to identify and trim the bulk eigenvalues associated with routine temporal co-evolution, then reorders via Hilbert curve and computes Bergsma dependence to isolate core spatial signals. This procedure is applied to Indian DTR data without any step that defines the target spatial association quantity in terms of itself, renames a fitted parameter as a prediction, or relies on a self-citation chain for the separation claim. Bergsma's measure and Hilbert ordering are standard external tools; the RMT trimming follows established random-matrix properties of correlation matrices rather than tautological construction. The derivation remains self-contained against external benchmarks and does not reduce the output to the input by definition.
Axiom & Free-Parameter Ledger
invented entities (1)
-
core spatial association
no independent evidence
Lean theorems connected to this paper
-
IndisputableMonolith/Cost/FunctionalEquation.leanwashburn_uniqueness_aczel unclear?
unclearRelation between the paper passage and the cited Recognition theorem.
We propose a novel de-trending pipeline for STS data using Random Matrix Theory (RMT). ... SVD based dimension trimming ... S=D−∑λk uk vkT ... Marchenko-Pastur law ... Bergsma’s correlation ... Spatial Bergsma
-
IndisputableMonolith/Foundation/DimensionForcing.leanalexander_duality_circle_linking unclear?
unclearRelation between the paper passage and the cited Recognition theorem.
trimming out strong but routine temporal signals while preserving spatial signals
What do these tags mean?
- matches
- The paper's claim is directly supported by a theorem in the formal canon.
- supports
- The theorem supports part of the paper's argument, but the paper may add assumptions or extra steps.
- extends
- The paper goes beyond the formal theorem; the theorem is a base layer rather than the whole result.
- uses
- The paper appears to rely on the theorem as machinery.
- contradicts
- The paper's claim conflicts with a theorem or certificate in the canon.
- unclear
- Pith found a possible connection, but the passage is too broad, indirect, or ambiguous to say the theorem truly supports the claim.
Reference graph
Works this paper leans on
-
[1]
Eliciting core spatial association from spatial time series: a random matrix approach
Bhattcharjee, M., & Bose, A. (2026). Supporting Information for“ Eliciting core spatial association from spatial time series: a random matrix approach”.(Not for separate publication) Bose, A., Kappara, D., & Bhattacharjee, M. (2023). Estimating Bergsma’s covariance. Jour. Korean Stat. Soc.,52, 1025–1054. Center for Data and Knowledge Integration for Healt...
work page 2026
-
[2]
24 Getis, A., & Ord, J. K. (2010). The analysis of spatial association by use of distance statistics. InPerspectives on Spatial Data Analysis(pp. 127–145). Springer. Jayasankar, C. B., & Misra, V. (2024). Projected changes in diurnal temperature range over India using a coupled ocean–atmosphere regional climate model.Int. J. Climatol., 45(1), e8696. Jhajh...
work page 2010
-
[3]
Vinnarasi, R., & Dhanya, C. T. (2019). Quantifying the shifts and intensification in the annual cycles of diurnal temperature extremes for human comfort and crop production. Environ. Res. Lett.,14(5), 054016. Vinnarasi, R., Dhanya, C. T., A., C., & AghaKouchak, A. (2017). Unravelling diurnal asymmetry of surface temperature in different climate zones.Sci Rep.,7,
work page 2019
-
[4]
Wu, Z., Huang, N. E., & Chen, X. (2009). The multi-dimensional ensemble empirical mode decomposition method.Adv. Adapt. Data Anal.,01(3), 339–372. Zhong, Z., He, B., Chen, H., Chen, D., Zhou, T., Dong, W., . . . Zhao, X. (2023, 11). Reversed asymmetric warming of sub-diurnal temperature over land during recent decades.Nature Comm.,14,
work page 2009
discussion (0)
Sign in with ORCID, Apple, or X to comment. Anyone can read and Pith papers without signing in.