How Do LLMs See Charts? A Comparative Study on High-Level Visualization Comprehension in Humans and LLMs
Pith reviewed 2026-05-10 17:55 UTC · model grok-4.3
The pith
LLMs interpret charts by enumerating comparisons and numerical ranges in a fixed way, while humans synthesize data into trend-centered narratives.
A machine-rendered reading of the paper's core claim, the machinery that carries it, and where it could break.
Core claim
LLMs exhibit a consistent interpretative strategy that remains unchanged across prompt constraints. Humans naturally synthesize data into trend-centric narratives, whereas LLMs persist with a structural enumeration of comparisons and numerical ranges. LLMs achieve visualization comprehension through mechanisms distinct from human intuition.
What carries the argument
Qualitative comparison of interpretative strategies across three visualization types and three prompt conditions, revealing fixed structural enumeration in LLMs versus narrative synthesis in humans.
If this is right
- Visualization designers need to account for LLMs favoring explicit numerical comparisons over implicit trends when charts are meant for AI audiences.
- Changing prompt wording will not shift LLMs toward human-like narrative reading of charts.
- Tools that combine human and LLM chart analysis must bridge the structural versus narrative gap to avoid misaligned interpretations.
- Opportunities exist to create new chart designs that explicitly support both human trend synthesis and LLM enumeration.
Where Pith is reading between the lines
- Training data for LLMs could be augmented with narrative summaries of charts to encourage more human-aligned comprehension.
- Testing the same protocol on additional chart forms such as heat maps or network diagrams would show whether the enumeration pattern generalizes.
- Design software could incorporate checks that flag when a visualization prioritizes LLM-friendly lists at the expense of human trend clarity.
Load-bearing premise
The three visualization types and three prompt conditions together with the qualitative analysis capture general high-level interpretative strategies for both humans and LLMs.
What would settle it
A follow-up experiment in which LLMs switch from enumeration to trend synthesis when shown the same charts under new prompt wording or with additional visualization types would falsify the claim of consistent strategy.
Figures


read the original abstract
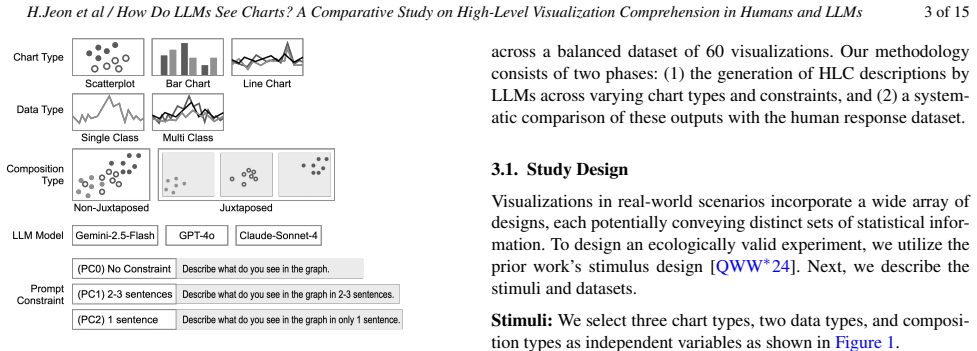
Designers often create visualizations to achieve specific high-level analytical or communication goals. These goals require people to extract complex and interconnected data patterns. Prior perceptual studies of visualization effectiveness have focused on low-level tasks, such as estimating statistical quantities, and have recently explored high-level comprehension of visualization. Despite the growing use of Large Language Models (LLMs) as visualization interpreters, how their interpretations relate to human understanding or what reasoning processes underlie their responses remains insufficiently understood. In this work, we explore LLMs' visualization comprehension, examining the alignment between designers' communicative goals and what their audience sees in a visualization. We have conducted a qualitative study to investigate the gap between human interpretative strategies and the reasoning pathways of LLMs across three types of visualizations, line graphs, bar graphs, and scatterplots, to identify the high-level patterns generated by LLMs using three prompt conditions. Our analysis results indicate that LLMs exhibit a consistent interpretative strategy that remains unchanged across prompt constraints. Furthermore, we observe two distinct approaches: humans naturally synthesize data into trend-centric narratives, whereas LLMs persist with a structural enumeration of comparisons and numerical ranges. Lastly, we see LLMs achieve visualization comprehension through mechanisms distinct from human intuition, pointing to critical challenges and new opportunities for visualization design.
Editorial analysis
A structured set of objections, weighed in public.
Referee Report
Summary. The paper reports a qualitative study comparing high-level visualization comprehension between humans and LLMs across line graphs, bar graphs, and scatterplots under three prompt conditions. It claims LLMs display a consistent interpretative strategy that does not change with prompt constraints, humans synthesize data into trend-centric narratives while LLMs rely on structural enumeration of comparisons and numerical ranges, and LLMs therefore comprehend visualizations through mechanisms distinct from human intuition.
Significance. If the observed patterns hold under broader testing, the work would be significant for visualization and HCI research by identifying concrete differences in reasoning pathways. This could inform visualization design practices that account for both human and LLM audiences and highlight limitations in using LLMs as chart interpreters. The qualitative framing provides an initial mapping of strategies, though the absence of quantitative validation or sampling justification reduces immediate applicability.
major comments (2)
- [Methods] Methods section: No information is provided on the number of human participants, their recruitment or demographics, the exact qualitative coding procedure, or inter-rater reliability metrics. These details are required to assess whether the reported divergence between trend-centric human narratives and LLM structural enumeration is reproducible and not an artifact of small or unrepresentative samples.
- [Results] Results and Discussion sections: The central claim that LLMs use mechanisms distinct from human intuition rests on responses to only three visualization types and three prompt conditions. Without quantitative metrics (e.g., frequency counts of narrative vs. enumeration codes), justification for stimulus representativeness, or tests of additional chart types, the consistency of LLM strategy and the human-LLM divergence cannot be shown to generalize beyond the specific data patterns tested.
minor comments (1)
- [Abstract] Abstract: Adding one or two concrete examples of a human trend narrative versus an LLM enumeration response would help readers immediately grasp the claimed distinction before reading the full analysis.
Simulated Author's Rebuttal
We thank the referee for their constructive and detailed feedback, which helps us strengthen the methodological transparency and scope of our qualitative study on LLM versus human visualization comprehension. We address each major comment below and will revise the manuscript accordingly.
read point-by-point responses
-
Referee: [Methods] Methods section: No information is provided on the number of human participants, their recruitment or demographics, the exact qualitative coding procedure, or inter-rater reliability metrics. These details are required to assess whether the reported divergence between trend-centric human narratives and LLM structural enumeration is reproducible and not an artifact of small or unrepresentative samples.
Authors: We acknowledge that these details were omitted from the submitted manuscript. In the revised version, we will expand the Methods section to include the number of human participants, recruitment method (via university participant pools and online forums), demographics (age, gender, visualization familiarity), the qualitative coding procedure (thematic analysis with iterative codebook development), and inter-rater reliability metrics (e.g., Cohen's kappa between independent coders). This will allow better evaluation of reproducibility. revision: yes
-
Referee: [Results] Results and Discussion sections: The central claim that LLMs use mechanisms distinct from human intuition rests on responses to only three visualization types and three prompt conditions. Without quantitative metrics (e.g., frequency counts of narrative vs. enumeration codes), justification for stimulus representativeness, or tests of additional chart types, the consistency of LLM strategy and the human-LLM divergence cannot be shown to generalize beyond the specific data patterns tested.
Authors: We agree the study is scoped to three visualization types and prompt conditions as an initial qualitative exploration. In revision, we will add quantitative elements such as frequency counts and proportions of trend-centric narrative codes versus structural enumeration codes across all responses to better demonstrate consistency. We will also justify the representativeness of the chosen stimuli (common chart types for high-level tasks) and explicitly discuss limitations on generalizability, including the need for future work with additional chart types. The qualitative depth remains central, but these additions will better support the claims. revision: partial
Circularity Check
No circularity: empirical qualitative study with no derivations or self-referential steps
full rationale
The paper is a qualitative comparative study of human and LLM responses to three visualization types under three prompt conditions. It contains no equations, no fitted parameters, no derivations, and no load-bearing self-citations that reduce claims to inputs by construction. All findings are presented as observed patterns from coded responses rather than predictions forced by prior definitions or ansatzes. The central claims rest on direct empirical observation and qualitative analysis, which are self-contained against external benchmarks and do not invoke uniqueness theorems or renamings of known results.
Axiom & Free-Parameter Ledger
axioms (1)
- domain assumption The selected visualizations and prompt conditions are representative enough to reveal general differences in high-level comprehension strategies.
Reference graph
Works this paper leans on
-
[1]
https://www.anthropic.com/claude-4-system-card,
2, 5 [Ant25] ANTHROPIC: System card: Claude opus 4 & claude sonnet 4. https://www.anthropic.com/claude-4-system-card,
-
[2]
Computational Linguistics 34(4), 555–596 (2008)
4 [AP08] ARTSTEINR., POESIOM.: Survey article: Inter-coder agreement for computational linguistics. Computational Linguistics 34, 4 (2008), 555–596.doi:10.1162/coli.07-034-R2. 4 [BBF∗21] BORLANDD., BRAINI., FECHOK., PFAFFE., XUH., CHAMPIONJ., BIZONC., GOTZD.: Enabling longitudinal exploratory analysis of clinical covid data. In IEEE Workshop on Visual Ana...
-
[3]
10 [DPD∗24] DAVISR., PUX., DINGY., HALLB. D., BONILLAK., FENGM., KAYM., HARRISONL.: The risks of ranking: Revisit- ing graphical perception to model individual differences in visualiza- tion performance. IEEE Transactions on Visualization and Computer Graphics 30, 3 (Mar. 2024), 1756–1771. URL:https://doi.org/ 10.1109/TVCG.2022.3226463. 2 [DTM25] DASA. K....
-
[4]
4, 13 [JSFL24] JOSHIA., SRINIVASC., FIRATE. E., LARAMEER. S.: Eval- uating the recommendations of llms to teach a visualization technique using bloom’s taxonomy.Electronic Imaging 36, 1 (2024), 360–1–360– 1.doi:10.2352/EI.2024.36.1.VDA-360. 5 [KAMB25] KIMN. W., AHNY., MYERSG., BACHB.: How good is chatgpt in giving advice on your visualization design? ACM ...
-
[5]
URL:https://doi.org/10.2312/eged.20221042. 5 [PGM19] PRESTONA., GOMOVM., MAK.-L.: Uncertainty-aware visualization for analyzing heterogeneous wildfire detections. IEEE Computer Graphics and Applications 39, 5 (2019), 72–82. 1 [QR21] QUADRIG. J., ROSENP.: A survey of perception-based visual- ization studies by task. IEEE transactions on visualization and c...
discussion (0)
Sign in with ORCID, Apple, or X to comment. Anyone can read and Pith papers without signing in.