Causal Fairness Analysis of ADHD Status and High School STEM Outcomes
Pith reviewed 2026-05-10 15:07 UTC · model grok-4.3
The pith
ADHD status imposes a direct penalty on high school STEM grades that accounts for most of the observed disparity and varies by race.
A machine-rendered reading of the paper's core claim, the machinery that carries it, and where it could break.
Core claim
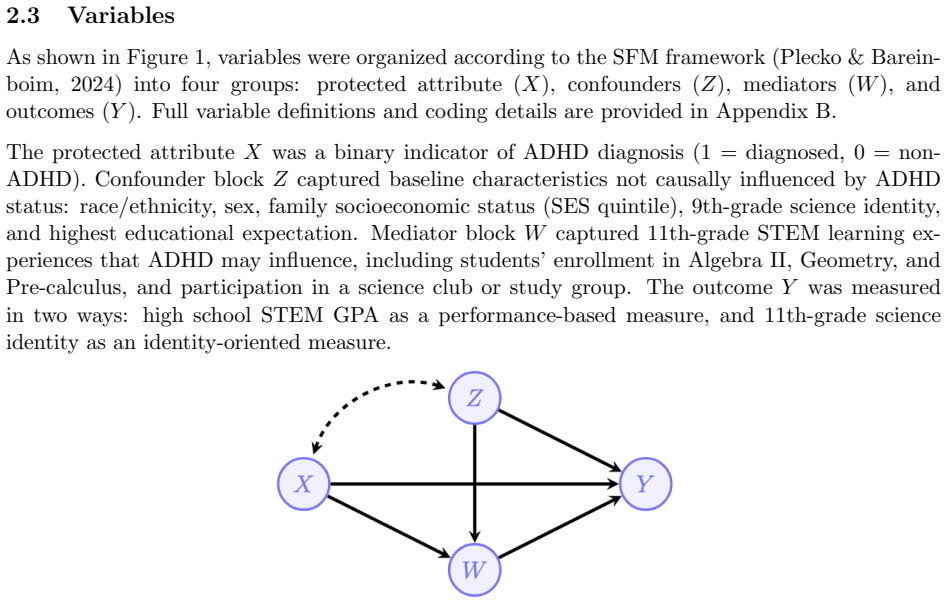
Drawing on data from the High School Longitudinal Study of 2009, total variation decomposition reveals a statistically significant ADHD penalty on STEM GPA (TV = -0.670), of which 63.3% is attributable to the direct effect (x-DE). This indicates that the majority of the disparity operates through pathways not mediated by observed sociodemographic or academic confounders. Counterfactual direct effect analysis further reveals that the direct effect is structured by race, with notable variation across racial and ethnic subgroups. The effect on science identity is small and non-significant (TV = -0.068). Sensitivity analyses confirm robustness to moderate unmeasured confounding.
What carries the argument
The total variation decomposition in the Causal Fairness Analysis framework, which separates the effect of ADHD status on STEM outcomes into direct, indirect, and spurious components within Pearl's structural causal model.
If this is right
- Most of the disparity in STEM GPA is due to the direct effect of ADHD status.
- The direct effect varies across different racial and ethnic groups.
- ADHD has little effect on science identity.
- Findings are robust to moderate levels of unmeasured confounding.
- Policies should address direct barriers in addition to mediators.
Where Pith is reading between the lines
- If correct, interventions focused on ADHD accommodations in STEM classes could reduce much of the grade penalty.
- The racial structuring of the direct effect points to potential interactions between ADHD status and racial biases in educational settings.
- Applying the same decomposition to other educational outcomes or later stages like college could reveal if patterns persist.
Load-bearing premise
The structural causal model correctly identifies all relevant pathways from ADHD to the outcomes, with unmeasured confounding no stronger than what the sensitivity analyses allow.
What would settle it
Finding a large unmeasured confounder, such as undiagnosed mental health issues or differential teacher grading practices, that when included eliminates the direct effect on STEM GPA.
Figures


read the original abstract
This study applies the Causal Fairness Analysis (CFA) framework of Plecko and Bareinboim (2024) to decompose the total variation in STEM outcomes attributable to ADHD status into direct, indirect, and spurious components using Pearl's Structural Causal Model. Drawing on nationally representative data from the High School Longitudinal Study of 2009, this study examines two outcomes: cumulative STEM GPA and science identity. Total variation decomposition reveals a statistically significant ADHD penalty on STEM GPA (TV = -0.670), of which 63.3% is attributable to the direct effect (x-DE), indicating that the majority of the disparity operates through pathways not mediated by observed sociodemographic or academic confounders. In contrast, the effect on science identity is small and non-significant (TV = -0.068). Counterfactual direct effect analysis using the one-step debiased estimator further reveals that the direct effect is structured by race, with notable variation across racial and ethnic subgroups. Sensitivity analyses confirm robustness to moderate unmeasured confounding. These findings advance the understanding of ADHD-related inequities in STEM education and highlight the need for fairness-aware policies that address both direct institutional barriers and their differential impact across intersecting social identities.
Editorial analysis
A structured set of objections, weighed in public.
Referee Report
Summary. The paper applies the Causal Fairness Analysis (CFA) framework of Plecko and Bareinboim (2024) to nationally representative HSLS:09 data to decompose total variation (TV) in high-school STEM GPA and science identity due to ADHD status into direct (x-DE), indirect, and spurious components via Pearl's SCM. Using a one-step debiased estimator, it reports TV = -0.670 for STEM GPA (63.3% x-DE) and a small non-significant TV = -0.068 for science identity, with the direct effect varying by race/ethnicity; sensitivity analyses are presented for unmeasured confounding.
Significance. If the identification and sensitivity claims hold, the work supplies concrete evidence that most of the observed ADHD-STEM GPA disparity operates through direct (non-mediated) pathways and is heterogeneous by race, informing fairness-aware educational policy. Strengths include use of public longitudinal data, application of an established causal-fairness decomposition, and explicit sensitivity checks; these elements make the numerical claims (TV and x-DE percentages) falsifiable and policy-relevant if the SCM assumptions are adequately defended.
major comments (3)
- [Causal Model and Identification] The structural causal model graph and complete variable definitions are not shown, preventing verification that all backdoor paths from ADHD diagnosis to STEM GPA are blocked by the listed sociodemographic and academic covariates. This assumption is load-bearing for the claim that x-DE constitutes 63.3% of TV.
- [Sensitivity Analyses] The sensitivity analysis asserts robustness to 'moderate' unmeasured confounding but does not report the concrete threshold (e.g., maximum confounding strength) or the exact functional form of the sensitivity model. Without these details the robustness of the 63.3% x-DE figure cannot be assessed against plausible endogeneity in ADHD diagnosis (access to care, teacher expectations, undiagnosed comorbidities).
- [Results] The counterfactual direct-effect results by race/ethnicity are summarized qualitatively ('notable variation') without reporting the subgroup-specific point estimates, standard errors, or sample sizes in the main text or tables. This weakens evaluation of the intersectionality claim.
minor comments (2)
- [Abstract] The abstract introduces the 'one-step debiased estimator' without a one-sentence description or citation; a brief parenthetical would improve accessibility.
- [Tables] Tables should include exact variable names, coding, and effective sample sizes after missing-data handling to support reproducibility.
Simulated Author's Rebuttal
We thank the referee for their constructive and detailed comments, which identify key areas where greater transparency will strengthen the manuscript. We address each major comment below and will incorporate revisions to improve verifiability of the causal assumptions, sensitivity results, and subgroup findings.
read point-by-point responses
-
Referee: The structural causal model graph and complete variable definitions are not shown, preventing verification that all backdoor paths from ADHD diagnosis to STEM GPA are blocked by the listed sociodemographic and academic covariates. This assumption is load-bearing for the claim that x-DE constitutes 63.3% of TV.
Authors: We agree that explicit presentation of the SCM is necessary for readers to evaluate the identification strategy. In the revised manuscript we will add a figure displaying the full directed acyclic graph from the CFA framework, with all nodes (ADHD status, sociodemographic covariates, academic mediators, and the two outcomes) and edges. We will also include a supplementary table with complete variable definitions, coding, HSLS:09 sources, and explicit justification for each covariate as a blocker of backdoor paths. These additions will allow direct verification that the observed covariates suffice for the x-DE identification. revision: yes
-
Referee: The sensitivity analysis asserts robustness to 'moderate' unmeasured confounding but does not report the concrete threshold (e.g., maximum confounding strength) or the exact functional form of the sensitivity model. Without these details the robustness of the 63.3% x-DE figure cannot be assessed against plausible endogeneity in ADHD diagnosis (access to care, teacher expectations, undiagnosed comorbidities).
Authors: We acknowledge that the current description of the sensitivity analysis lacks the quantitative detail needed for independent assessment. In the revision we will specify the exact sensitivity model employed (the bounding procedure from the CFA framework), report the concrete threshold values (maximum confounding strength that would overturn the sign or significance of the x-DE), and present results in a table or figure showing how the 63.3% x-DE share changes under varying levels of unmeasured confounding. We will also discuss how these thresholds relate to plausible sources of endogeneity such as diagnostic access and comorbidities. revision: yes
-
Referee: The counterfactual direct-effect results by race/ethnicity are summarized qualitatively ('notable variation') without reporting the subgroup-specific point estimates, standard errors, or sample sizes in the main text or tables. This weakens evaluation of the intersectionality claim.
Authors: We agree that qualitative description alone is insufficient for evaluating the intersectionality results. In the revised manuscript we will add a table (or expand the main results table) that reports the race/ethnicity-specific x-DE point estimates, standard errors, 95% confidence intervals, and subgroup sample sizes. This will enable readers to assess the magnitude and precision of the variation across groups and will strengthen the empirical basis for the intersectionality discussion. revision: yes
Circularity Check
No circularity: external CFA framework applied to new observational data
full rationale
The paper applies the Causal Fairness Analysis (CFA) framework of Plecko and Bareinboim (2024) to HSLS:09 data, computing total variation (TV = -0.670) and direct-effect share (63.3%) via the cited framework's decomposition formulas on an assumed SCM with observed covariates. No self-definitional steps, fitted inputs renamed as predictions, or load-bearing self-citations appear; the central quantities are produced by applying external identification results to fresh data, with sensitivity analyses for unmeasured confounding. The derivation chain remains independent of its own outputs.
Axiom & Free-Parameter Ledger
axioms (2)
- domain assumption The directed acyclic graph for ADHD status, sociodemographic confounders, academic mediators, and STEM outcomes is correctly specified.
- domain assumption Unmeasured confounding is bounded by the levels examined in the sensitivity analyses.
Reference graph
Works this paper leans on
-
[1]
Athey, S., Tibshirani, J., & Wager, S. (2019). Generalized random forests. The Annals of Statistics, 47(2), 1148--1178. https://doi.org/10.1214/18-AOS1709
-
[2]
Cinelli, C., & Hazlett, C. (2020). Making sense of sensitivity: Extending omitted variable bias. Journal of the Royal Statistical Society Series B: Statistical Methodology, 82(1), 39--67. https://doi.org/10.1111/rssb.12348
-
[3]
Matson, J. L., Mahan, S., Hess, J. A., & Fodstad, J. C. (2010). Effect of developmental quotient on symptoms of inattention and impulsivity among toddlers with autism spectrum disorders. Research in Developmental Disabilities, 31(2), 464--469. https://doi.org/10.1016/j.ridd.2009.10.014
-
[4]
Meyer, D. (2017). Bill Gates thinks tech could make inequality worse. But he has faith in robots. Fortune. Retrieved from https://fortune.com/2017/11/15/bill-gates-technology-inequality-robots/
work page 2017
-
[5]
Office of Special Education Programs. (2015). 37th annual report to Congress on the implementation of the Individuals with Disabilities Education Act, 2015. Washington, DC: U.S.\ Department of Education
work page 2015
-
[6]
Owens, J. (2020). Relationships between an ADHD diagnosis and future school behaviors among children with mild behavioral problems. Sociology of Education, 93(3), 191--214. https://doi.org/10.1177/0038040720909296
-
[7]
Pearl, J. (2009). Causality: Models, Reasoning, and Inference. Cambridge University Press
work page 2009
-
[8]
Pearl, J., Glymour, M., & Jewell, N. P. (2021). Causal Inference in Statistics: A Primer (Reprinted with revisions). Wiley
work page 2021
-
[9]
Plecko, D., & Bareinboim, E. (2024). Causal fairness analysis: A causal toolkit for fair machine learning. Foundations and Trends in Machine Learning, 17(3), 304--589. https://doi.org/10.1561/2200000106
-
[10]
Plecko, D., Secombe, P., Clarke, A., Fiske, A., Toby, S., Duff, D., Pilcher, D., Celi, L. A., Bellomo, R., & Bareinboim, E. (2025). An algorithmic approach for causal health equity: A look at race differentials in intensive care unit (ICU) outcomes. arXiv preprint arXiv:2501.05197. https://doi.org/10.48550/arXiv.2501.05197
-
[11]
Saatcioglu, A., & Skrtic, T. M. (2019). Categorization by organizations: Manipulation of disability categories in a racially desegregated school district. American Journal of Sociology, 125(1), 184--260. https://doi.org/10.1086/703957
-
[12]
Shifrer, D., Callahan, R. M., & Muller, C. (2013). Equity or marginalization? The high school course-taking of students labeled with a learning disability. American Educational Research Journal, 50(4), 656--682. https://doi.org/10.3102/0002831213479439
-
[13]
Shifrer, D., & Mackin Freeman, D. (2021). Problematizing perceptions of STEM potential: Differences by cognitive disability status in high school and postsecondary educational outcomes. Socius: Sociological Research for a Dynamic World, 7, 2378023121998116. https://doi.org/10.1177/2378023121998116
-
[14]
Wager, S., & Athey, S. (2018). Estimation and inference of heterogeneous treatment effects using random forests. Journal of the American Statistical Association, 113(523), 1228--1242. https://doi.org/10.1080/01621459.2017.1319839
-
[15]
Zhang, J., & Bareinboim, E. (2018). Fairness in decision-making---the causal explanation formula. Proceedings of the AAAI Conference on Artificial Intelligence, 32(1). https://doi.org/10.1609/aaai.v32i1.11564
-
[16]
Zhang, Z., Kim, H. J., Lonjon, G., & Zhu, Y. (2019). Balance diagnostics after propensity score matching. Annals of Translational Medicine, 7(1), 16. https://doi.org/10.21037/atm.2018.12.10
discussion (0)
Sign in with ORCID, Apple, or X to comment. Anyone can read and Pith papers without signing in.