Recognition: unknown
Temperature Anomalies and Climate Physical Risk in Portfolio Construction
Pith reviewed 2026-05-10 16:06 UTC · model grok-4.3
The pith
Extreme temperature events reduce returns across most equity sectors, and new time-varying risk metrics enable construction of more resilient portfolios through multi-objective optimization.
A machine-rendered reading of the paper's core claim, the machinery that carries it, and where it could break.
Core claim
Panel regressions on sectoral returns establish that extreme temperature anomalies exert a negative effect on most sectors. Two new metrics, Climate Risk Exposure and Climate Exposure Volatility, are constructed from temperature anomaly data to quantify the time-varying probability of extremes and their linkage to firm-specific asset intensity. These metrics are embedded in a multi-objective portfolio optimization framework that extends the classical Mean-Variance model, producing equity portfolios that remain diversified yet reduce sensitivity to physical climate shocks. Back-testing confirms practical performance gains relative to traditional benchmarks.
What carries the argument
Climate Risk Exposure and Climate Exposure Volatility, two metrics that combine time-varying probabilities of extreme temperature events with firm-level asset intensity to quantify portfolio-level physical climate vulnerability.
If this is right
- Investors can optimize portfolios to reduce exposure to temperature-driven shocks without materially increasing financial risk or losing diversification.
- The two new metrics provide a dynamic, firm-specific alternative to static country-level climate indices for measuring physical risk.
- Back-tested climate-aware strategies show measurable outperformance against standard mean-variance benchmarks during periods containing extreme temperature events.
Where Pith is reading between the lines
- The same temperature-anomaly approach could be applied to other physical hazards such as extreme precipitation or sea-level rise once comparable high-resolution data become available.
- Widespread adoption might create demand for standardized, time-stamped asset-intensity data from companies, improving the precision of future risk models.
- The framework raises the question of how quickly the estimated exposure coefficients would need to be re-estimated if climate trends accelerate beyond historical ranges.
Load-bearing premise
The panel regression coefficients reflect a direct causal effect of temperature anomalies on returns rather than correlated economic or reporting factors, and the historical relationships observed in the back-test will continue to hold as climate patterns and firm exposures evolve.
What would settle it
Re-running the panel regressions after adding controls for sector-specific economic variables or performing the identical back-test on a fresh post-sample period that yields no statistically significant performance advantage for the climate-aware portfolios would falsify the central claim.
Figures


read the original abstract
Driven by the increasing frequency and intensity of natural disasters and chronic climate threats, we investigate the impact of physical climate risk on global equity portfolios. By employing a panel regression analysis on sectoral returns, we provide statistical evidence that extreme temperature events exert a negative effect on most sectors. We introduce two novel metrics based on these temperature anomalies, Climate Risk Exposure and Climate Exposure Volatility, in order to measure the environmental vulnerability of a portfolio. Unlike available static country-level indices, these metrics incorporate the time varying probability of extreme events and their relations with firm-specific asset intensity. We integrate these measures into a multi-objective portfolio optimization framework. This approach extends the traditional Mean-Variance paradigm, allowing investors to construct portfolios that are resilient to physical climate shocks without sacrificing diversification. Finally, we conduct a backtesting analysis to show the practical benefits of incorporating these climate risk metrics into the investment process, evaluating how climate-aware strategies perform relative to traditional benchmarks.
Editorial analysis
A structured set of objections, weighed in public.
Referee Report
Summary. The paper claims that extreme temperature events exert a negative effect on returns in most sectors, as shown via panel regression analysis of sectoral returns. It introduces two new metrics—Climate Risk Exposure and Climate Exposure Volatility—that incorporate time-varying probabilities of extreme events and firm-specific asset intensity. These metrics are integrated into a multi-objective portfolio optimization framework extending mean-variance optimization, and the practical benefits are demonstrated through backtesting relative to traditional benchmarks.
Significance. If the panel regression isolates a physical-risk channel and the backtests prove robust, the work could contribute to climate finance by offering dynamic, firm-level physical-risk metrics that improve upon static country indices and allow climate-resilient portfolio construction without sacrificing diversification. The combination of temperature-anomaly data with portfolio optimization addresses a timely gap in physical climate risk management for investors.
major comments (3)
- [Empirical results] Empirical results section (panel regression analysis): No regression tables, coefficient values, standard errors, or robustness checks are provided for the claim that extreme temperature events exert a negative effect on most sectors. This is load-bearing for the central contribution because the Climate Risk Exposure and Climate Exposure Volatility metrics are constructed directly from these coefficients; without the specification details, controls for time-varying economic confounders, or multiple-testing adjustments, it is impossible to assess whether the negative effect survives alternative explanations or supports the subsequent optimization claims.
- [Metric definitions] Metric construction (Section on Climate Risk Exposure and Climate Exposure Volatility): The abstract states the metrics use temperature anomalies, time-varying event probabilities, and firm-specific asset intensity, but without the explicit formulas or normalization steps it is unclear whether any weighting or aggregation introduces dependence on the same returns data used in the backtests. This risks circularity that would undermine the multi-objective optimization and out-of-sample performance evaluation.
- [Backtesting] Backtesting analysis: The manuscript asserts practical benefits of the climate-aware strategies, but provides no details on the backtest design, rebalancing frequency, transaction costs, out-of-sample periods, or statistical tests comparing performance to benchmarks. Given that the metrics derive from the panel regression, any identification weakness in the temperature coefficients would propagate directly to the reported portfolio improvements.
minor comments (2)
- [Introduction] The abstract and introduction could more clearly distinguish the new metrics from existing static climate indices by providing a brief comparison table or explicit differences in construction.
- [Throughout] Notation for the two metrics should be defined consistently (e.g., CRE and CEV) and used uniformly throughout the optimization and backtest sections to improve readability.
Simulated Author's Rebuttal
We thank the referee for the careful and constructive review. The comments highlight important areas where additional detail and transparency will strengthen the manuscript. We address each point below and will incorporate the necessary expansions in the revised version.
read point-by-point responses
-
Referee: [Empirical results] Empirical results section (panel regression analysis): No regression tables, coefficient values, standard errors, or robustness checks are provided for the claim that extreme temperature events exert a negative effect on most sectors. This is load-bearing for the central contribution because the Climate Risk Exposure and Climate Exposure Volatility metrics are constructed directly from these coefficients; without the specification details, controls for time-varying economic confounders, or multiple-testing adjustments, it is impossible to assess whether the negative effect survives alternative explanations or supports the subsequent optimization claims.
Authors: We agree that the current manuscript does not present the full regression output. The panel regressions were estimated with sector and time fixed effects plus standard macroeconomic controls, but these tables were omitted from the initial submission. In the revision we will add complete tables reporting coefficients, standard errors, p-values, and robustness checks across alternative specifications, including adjustments for multiple testing. This will allow readers to evaluate the identification of the temperature effect independently of the downstream metrics. revision: yes
-
Referee: [Metric definitions] Metric construction (Section on Climate Risk Exposure and Climate Exposure Volatility): The abstract states the metrics use temperature anomalies, time-varying event probabilities, and firm-specific asset intensity, but without the explicit formulas or normalization steps it is unclear whether any weighting or aggregation introduces dependence on the same returns data used in the backtests. This risks circularity that would undermine the multi-objective optimization and out-of-sample performance evaluation.
Authors: The metrics are constructed exclusively from gridded temperature anomaly data, historical frequencies of extreme events, and firm-level asset intensity obtained from balance-sheet information; no return data enter the formulas. We will insert the precise mathematical definitions, including the weighting and normalization steps, in the revised manuscript to demonstrate the absence of any dependence on the returns series used in the backtests. revision: yes
-
Referee: [Backtesting] Backtesting analysis: The manuscript asserts practical benefits of the climate-aware strategies, but provides no details on the backtest design, rebalancing frequency, transaction costs, out-of-sample periods, or statistical tests comparing performance to benchmarks. Given that the metrics derive from the panel regression, any identification weakness in the temperature coefficients would propagate directly to the reported portfolio improvements.
Authors: We will substantially expand the backtesting section to specify monthly rebalancing, realistic transaction costs, the exact out-of-sample window, and formal statistical tests (e.g., Diebold-Mariano or bootstrap tests) for differences in Sharpe ratios and other metrics relative to benchmarks. We will also add a brief discussion of how the metric construction limits propagation of any residual identification uncertainty from the regressions. revision: yes
Circularity Check
No significant circularity in derivation chain
full rationale
The paper performs a panel regression of sectoral returns on extreme temperature events to establish statistical evidence, then defines Climate Risk Exposure and Climate Exposure Volatility directly from temperature anomaly data, time-varying probabilities, and firm-specific asset intensity. These metrics enter a multi-objective optimizer and are evaluated via backtesting. No equation reduces by construction to its own inputs, no parameter is fitted to the target portfolio returns and then relabeled a prediction, and no load-bearing premise rests on self-citation. The derivation remains independent of the quantities it is later used to optimize.
Axiom & Free-Parameter Ledger
Reference graph
Works this paper leans on
-
[1]
Earth System Science Data 16, 3601–3685
State of wildfires 2023–2024. Earth System Science Data 16, 3601–3685. Kahn, M.E., Ouazad, A., Yönder, E.,
2023
-
[2]
Particle swarm optimization, in: Proceedings of ICNN’95- international conference on neural networks, IEEE. pp. 1942–1948. Le Guenedal, T., Roncalli, T.,
1942
-
[3]
Annals of Operations Research 342, 1991–2019
Responsible investing and portfolio selection: a Shapley-CVaR approach. Annals of Operations Research 342, 1991–2019. Neidell, M., Graff Zivin, J., Sheahan, M., Willwerth, J., Fant, C., Sarofim, M., Martinich, J.,
1991
-
[4]
Dipartimento di Eccellenza 2023-2027
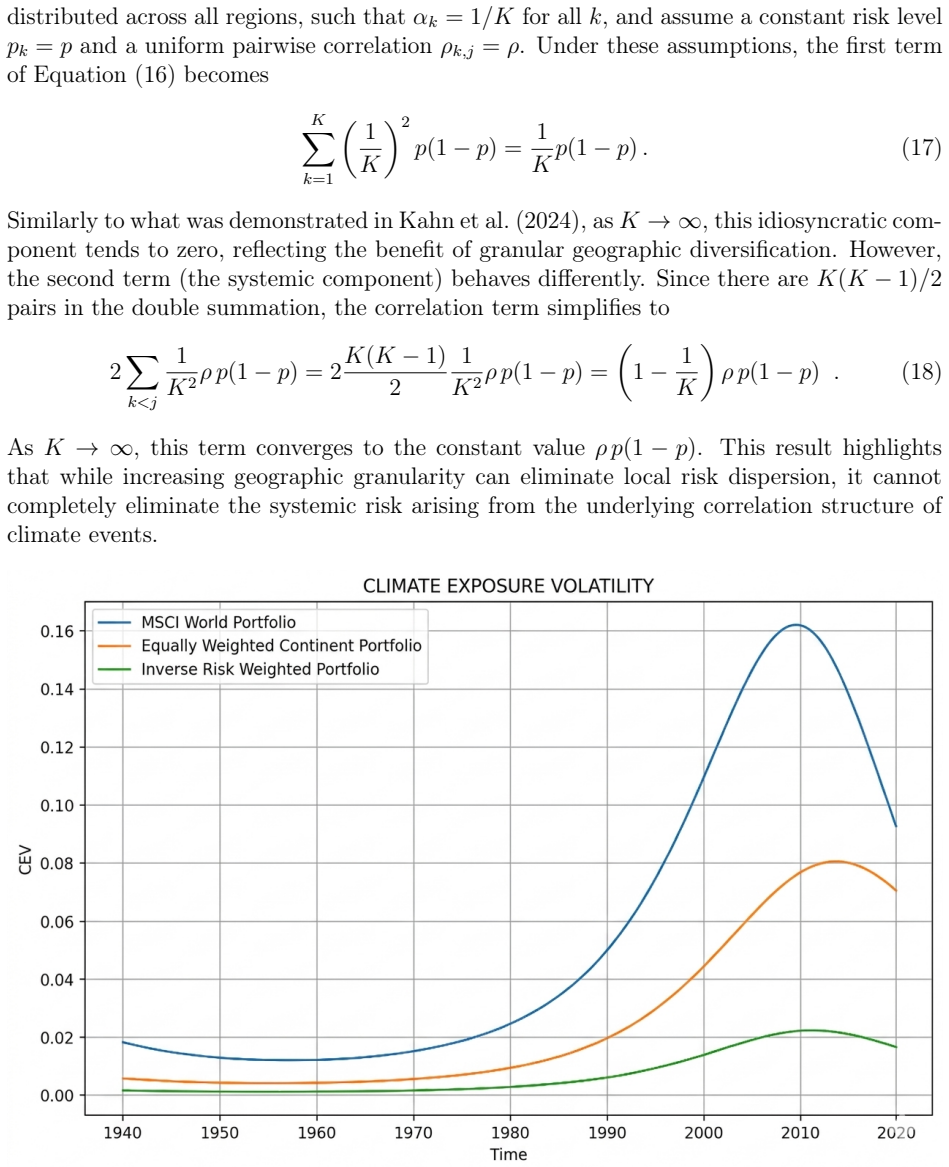
(A.12) Appendix B. Tri-Objective Optimization: Integrating Climate Risk Exposure In this section of the appendix we present the results of the multi-objective optimization performed at January 1, 2020, where we utilize theClimate Risk Exposure(CRE) instead of theClimate Exposure Volatility(CEV) to evaluate the portfolio’s climate-related risk. By adopting...
2020
discussion (0)
Sign in with ORCID, Apple, or X to comment. Anyone can read and Pith papers without signing in.