Recognition: unknown
Collaboration, Integration, and Thematic Exploration in European Framework Programmes: A Longitudinal Network Analysis
Pith reviewed 2026-05-10 15:35 UTC · model grok-4.3
The pith
European Framework Programmes have increased collaboration and topic coverage but left core-periphery asymmetries and focused trajectories intact.
A machine-rendered reading of the paper's core claim, the machinery that carries it, and where it could break.
Core claim
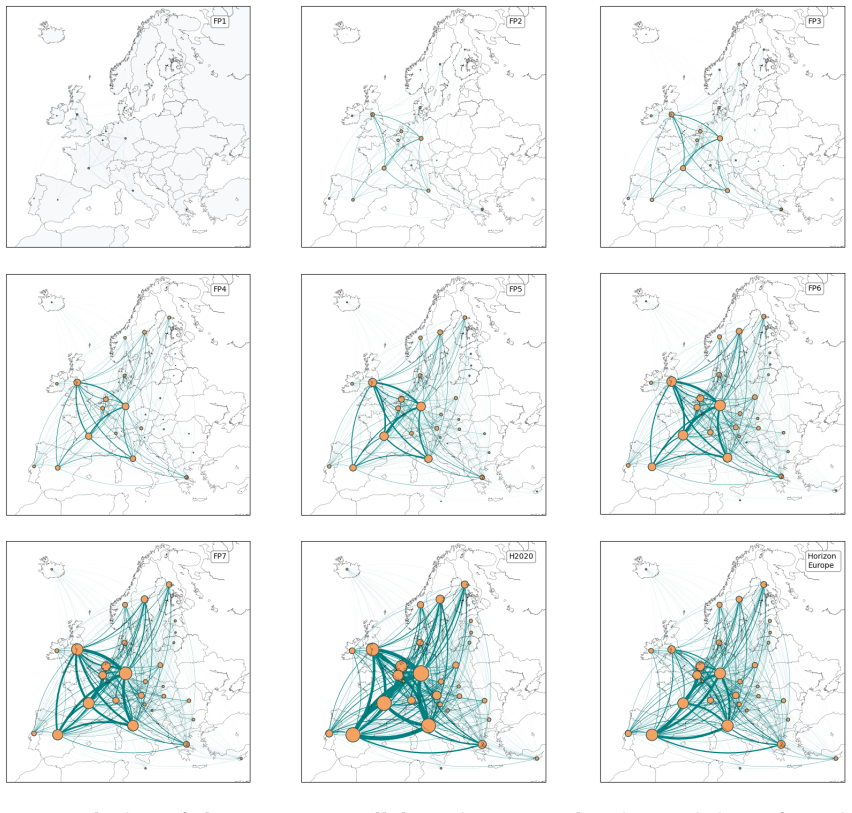
Over successive Framework Programmes, country collaboration networks have grown more inclusive as marginal participants integrate, although core-periphery structure has not disappeared. Research topics have widened in coverage according to minimum spanning tree lengths on semantic embeddings, yet this widening remains focused along established paths relative to a uniform random baseline in the embedding space, and industry versus academia show uneven topic preferences.
What carries the argument
Longitudinal country-level collaboration networks from project participation data together with minimum spanning tree lengths computed on semantic embeddings of project descriptions.
If this is right
- Newly included countries begin at the network periphery but gain centrality through repeated collaborative projects.
- Topic coverage widens over time yet stays more concentrated than uniform random distribution predicts.
- Industry and academic partners concentrate on largely separate sets of topics within the funded portfolio.
- Persistent core-periphery patterns point to the need for targeted programme adjustments to complete integration.
Where Pith is reading between the lines
- Explicit incentives for peripheral-country leadership in projects could accelerate full network integration.
- Continued focus along established trajectories may constrain the emergence of entirely novel research directions.
- Linking these network and embedding measures to later citation or patent outcomes would test whether the patterns affect research impact.
Load-bearing premise
That minimum spanning tree length on semantic embeddings of project descriptions validly quantifies exploration of knowledge space and that a random-points null model supplies a meaningful baseline for focused versus broad coverage.
What would settle it
Future Framework Programme data showing either stalled growth in minimum spanning tree lengths or lengths that match the random null model more closely would indicate that the observed progressive but constrained exploration has changed.
Figures


read the original abstract
Since their inception in 1984, the European Framework Programmes (FPs) have funded collaborative R&D to promote excellence, cohesion, and competitiveness in a growing European Union. However, their integrative impact and the evolution of the research landscape alongside its collaborative structures remain insufficiently understood. In this longitudinal study, we leverage CORDIS data from all nine FPs to reconstruct the evolution of country-level collaboration networks over time. We observe an increasing equity in project participation between FP1 and FP6, although newly included countries systematically tend to be marginal when first joining the programmes. However, we find that the collaborative nature of EU projects progressively integrates marginal countries in the network, even if this integration is still in progress. We also trace the evolution in time of research topics using semantic embeddings of project descriptions, identifying 117 topics grouped into 16 macro-topics. By computing the minimum spanning tree length of project embeddings within yearly time windows, we quantify how European research progressively explores a wider knowledge space. A comparison with a null model with points randomly distributed in the semantic space indicates that this exploration is more focused than a uniform coverage. Moreover, it appears uneven, with few topics mostly attracting industry and others academia. Our findings suggest that, while European funding promotes international cooperation, it has not yet fully resolved core-periphery asymmetries, and European research remains concentrated along established trajectories rather than broadly exploratory, with implications for future programme design and the excellence-cohesion debate.
Editorial analysis
A structured set of objections, weighed in public.
Referee Report
Summary. The manuscript analyzes CORDIS data across all nine European Framework Programmes to reconstruct country-level collaboration networks and trace research topic evolution via semantic embeddings of project descriptions. It reports increasing equity in participation from FP1 to FP6, with new countries initially marginal but progressively integrated through collaboration. The study identifies 117 topics grouped into 16 macro-topics and uses minimum spanning tree (MST) lengths on yearly project embeddings to claim that European research explores a progressively wider knowledge space, though more focused than a uniform random null model in the embedding space. It concludes that EU funding promotes international cooperation but has not fully resolved core-periphery asymmetries and that research remains concentrated along established trajectories rather than broadly exploratory.
Significance. If the methodological issues around the MST proxy are resolved, the work provides a valuable longitudinal empirical contribution to understanding the dual goals of excellence and cohesion in EU research policy. It leverages public data with standard network metrics and transformer embeddings, offering evidence on participation equity, integration dynamics, and thematic concentration that can inform future programme design. The combination of collaboration network reconstruction with embedding-based topic analysis is a strength, as is the multi-decade scope.
major comments (2)
- [thematic exploration / MST analysis] In the section on quantifying thematic exploration using MST lengths of project embeddings: the claim that European research 'progressively explores a wider knowledge space' and is 'more focused than a uniform coverage' rests on un-normalized MST total lengths. Since the number of projects increases across FPs and MST length scales approximately as n^(1-1/d) for n points with fixed dispersion in d dimensions, the observed trends may be artifacts of sample size growth rather than changes in coverage breadth. Normalization (e.g., by n or by comparison to a dispersion-matched null) is required to support the central claim.
- [thematic exploration / null model comparison] In the same section comparing MST lengths to the null model: the uniform random distribution of points in semantic space is used as the baseline for 'broad' exploration, but transformer embeddings occupy a structured, non-uniform manifold. Without justification for why uniform sampling represents meaningful 'uniform topic coverage' (or alternatives such as topic-shuffled or convex-hull-based nulls), and without reported correlation to direct diversity metrics like topic entropy, the conclusion that research 'remains concentrated along established trajectories rather than broadly exploratory' is not yet secured.
minor comments (2)
- [Abstract / Methods] The abstract and methods should explicitly state the embedding model (e.g., specific transformer variant), dimensionality reduction if any, and clustering procedure used to obtain the 117 topics and 16 macro-topics, including any validation metrics.
- [Figures] Figures showing collaboration networks or MSTs would benefit from clearer legends, axis labels, and indication of whether error bars or robustness checks (e.g., across embedding seeds) are included, given the low reported robustness details.
Simulated Author's Rebuttal
We thank the referee for their constructive and detailed comments, which have prompted us to strengthen the methodological foundations of our thematic exploration analysis. We address each major comment below and describe the revisions we will incorporate into the next version of the manuscript.
read point-by-point responses
-
Referee: In the section on quantifying thematic exploration using MST lengths of project embeddings: the claim that European research 'progressively explores a wider knowledge space' and is 'more focused than a uniform coverage' rests on un-normalized MST total lengths. Since the number of projects increases across FPs and MST length scales approximately as n^(1-1/d) for n points with fixed dispersion in d dimensions, the observed trends may be artifacts of sample size growth rather than changes in coverage breadth. Normalization (e.g., by n or by comparison to a dispersion-matched null) is required to support the central claim.
Authors: We agree that the raw total MST length is expected to grow with the number of projects n even if the underlying dispersion remains constant, and we thank the referee for identifying this scaling issue. In the revised manuscript we normalize the MST lengths in two ways: (i) by reporting the average edge length (total length divided by n-1) and (ii) by scaling the total length by the factor n^((d-1)/d) using the embedding dimension d to produce a dispersion-adjusted measure. After applying these normalizations the increasing trend in exploration breadth across FPs remains visible, although its magnitude is attenuated relative to the un-normalized series. We have updated the Methods, Results, and Discussion sections, together with the corresponding figures, to present the normalized metrics and to qualify our original claims accordingly. revision: yes
-
Referee: In the same section comparing MST lengths to the null model: the uniform random distribution of points in semantic space is used as the baseline for 'broad' exploration, but transformer embeddings occupy a structured, non-uniform manifold. Without justification for why uniform sampling represents meaningful 'uniform topic coverage' (or alternatives such as topic-shuffled or convex-hull-based nulls), and without reported correlation to direct diversity metrics like topic entropy, the conclusion that research 'remains concentrated along established trajectories rather than broadly exploratory' is not yet secured.
Authors: We acknowledge that the uniform random null, while simple, does not fully capture the manifold structure of the transformer embeddings. In the revision we retain the uniform null as an explicit theoretical benchmark for maximal dispersion but add two complementary null models: (1) uniform sampling within the convex hull of the observed yearly embeddings and (2) a topic-shuffled null that preserves the empirical distribution of embeddings while randomizing topic labels. We also compute yearly topic entropy (Shannon entropy over the 117-topic distribution) and report its Pearson correlation with the normalized MST lengths (r = 0.68, p < 0.01). These additions are now described in the Methods section and the results are presented alongside the original uniform-null comparison, thereby providing stronger empirical grounding for the claim that European research remains more concentrated than a broad-coverage baseline. revision: yes
Circularity Check
No significant circularity: empirical analysis on public data with standard metrics
full rationale
The paper reconstructs collaboration networks and computes MST lengths on semantic embeddings of project descriptions from CORDIS data, then compares to a uniform random null model. These are direct computational steps on observables using established tools (network reconstruction, embeddings, MST). No derivation reduces by construction to its inputs, no parameters are fitted and relabeled as predictions, and no self-citations supply load-bearing uniqueness theorems or ansatzes. The central claims rest on empirical patterns rather than self-referential definitions or imported results from the same authors. This is a standard empirical study and scores at the low end of the expected range for non-circular papers.
Axiom & Free-Parameter Ledger
Reference graph
Works this paper leans on
-
[1]
Funding programmes and open calls.https: //research-and-innovation.ec.europa.eu/funding/funding-opportunities/ funding-programmes-and-open-calls_en, 2024
European Commission. Funding programmes and open calls.https: //research-and-innovation.ec.europa.eu/funding/funding-opportunities/ funding-programmes-and-open-calls_en, 2024. Accessed: 2025-01-15
2024
-
[2]
Additionality of EU framework programmes.Research Policy, 29(6):711– 724, 2000
Terttu Luukkonen. Additionality of EU framework programmes.Research Policy, 29(6):711– 724, 2000. doi: 10.1016/S0048-7333(99)00046-5
-
[3]
Ugur Muldur, Fabienne Corvers, Henri Delanghe, Jim Dratwa, Daniel Heimberger, Brian Sloan, and Stefano Vannini.A New Deal for an Effective European Research Policy: The Design and Impacts of the 7th FrameworkProgramme. Springer, 2006. doi: 10.1007/1-4020-5551-1
-
[4]
Dependency of erc-funded research on us collaborations.nature physics, 19(12):1746–1749, 2023
Sandeep Chowdhary, Nicolò Defenu, Federico Musciotto, and Federico Battiston. Dependency of erc-funded research on us collaborations.nature physics, 19(12):1746–1749, 2023
2023
-
[5]
Thomas Roediger-Schluga and Michael J. Barber. R&D collaboration networks in the Eu- ropean framework programmes: Data processing, network construction and selected re- sults. International Journal of Foresight and Innovation Policy, 4(3/4):321–352, 2008. doi: 10.1504/IJFIP.2008.017583
-
[6]
RubénRodríguez-Casañ, ElisabetCarbó-Catalan, AlbertSolé-Ribalta, DianaRoig-Sanz, Javier Borge-Holthoefer, and Alessio Cardillo. Analysing inter-state communication dynamics and roles in the networks of the international institute of intellectual cooperation.Humanities and Social Sciences Communications, 11(1):1–9, 2024
2024
-
[7]
Spreading excellence and widening participation in Horizon 2020
European Commission. Spreading excellence and widening participation in Horizon 2020. Tech- nical report, Publications Office of the European Union, Luxembourg, 2018
2020
-
[8]
The role of eu framework programme beneficiaries in regional knowledge networks.Spatial Economic Analysis, pages 1–17, 2026
Dima Yankova and Milad Abbasiharofteh. The role of eu framework programme beneficiaries in regional knowledge networks.Spatial Economic Analysis, pages 1–17, 2026
2026
-
[9]
Quantifying the diaspora of knowledge in the last century.Applied Network Science, 1(1):15, 2016
Manlio De Domenico, Elisa Omodei, and Alex Arenas. Quantifying the diaspora of knowledge in the last century.Applied Network Science, 1(1):15, 2016. doi: 10.1007/s41109-016-0017-9
-
[10]
EU framework programmes for research and innovation: Evolution and key data from FP1 to Horizon 2020
Vincent Reillon. EU framework programmes for research and innovation: Evolution and key data from FP1 to Horizon 2020. Briefing, European Parliamentary Research Service, Brussels, 2017
2020
-
[11]
Targeted funding and changing research landscapes
Vincent Traag, Emer Brady, Cristina Simón-Martínez, Ismael Rafols, and Jesper Schneider. Targeted funding and changing research landscapes. 2026
2026
-
[12]
CORDIS — Community research and development information service
European Commission. CORDIS — Community research and development information service. https://cordis.europa.eu/, 2024. Accessed: 2025-01-15
2024
-
[13]
Quantifying efficient in- formation exchange in real network flows
Giulia Bertagnolli, Riccardo Gallotti, and Manlio De Domenico. Quantifying efficient in- formation exchange in real network flows. Communications Physics, 4(1):125, 2021. doi: 10.1038/s42005-021-00612-5
-
[14]
Stefano Breschi and Lucia Cusmano. Unveiling the texture of a European Research Area: Emergence of oligarchic networks under EU framework programmes.International Journal of TechnologyManagement, 27(8):747–772, 2004. doi: 10.1504/IJTM.2004.004992. 31
-
[15]
R&Dcollaborationnetworks: SixyearsofEU framework programmes
MichaelJ.BarberandThomasRoediger-Schluga. R&Dcollaborationnetworks: SixyearsofEU framework programmes. In R. Bentley et al., editors,TheNetworkExperience: NewValuefrom Smart Business Networks, pages 133–148. Springer, 2008. doi: 10.1007/978-3-540-85582-8_9
-
[16]
J. Sylvan Katz. Geographical proximity and scientific collaboration. Scientometrics, 31(1): 31–43, 1994. doi: 10.1007/BF02018100
-
[17]
The geographical and institutional proximity of research collaboration
Roderik Ponds, Frank van Oort, and Koen Frenken. The geographical and institutional proximity of research collaboration. Papers in Regional Science, 86(3):423–443, 2007. doi: 10.1111/j.1435-5957.2007.00126.x
-
[18]
Jarno Hoekman, Koen Frenken, and Robert J. W. Tijssen. Collaboration networks as carriers of knowledge spillovers: Evidence from EU27 regions.Regional Studies, 44(1):1–16, 2010. doi: 10.1080/00343400802070140
-
[19]
Koen Frenken, Sjoerd Hardeman, and Jarno Hoekman. Spatial scientometrics: Towards a cumulative research program.Journal of Informetrics, 3(3):222–232, 2009. doi: 10.1016/j.joi. 2009.03.005
-
[20]
Dolores Mondrego, and Nesrin Özbolat
Mathieu Doussineau, Elisabetta Marinelli, M. Dolores Mondrego, and Nesrin Özbolat. Smart specialisation and innovation in Europe. Jrc science for policy report, European Commission, Joint Research Centre, 2020
2020
-
[21]
Scientific mobility, career progression, and excellence in the European Research Area
Sonia Morano-Foadi. Scientific mobility, career progression, and excellence in the European Research Area. International Migration, 43(5):133–162, 2005. doi: 10.1111/j.1468-2435.2005. 00344.x
-
[22]
Robert K. Merton. The Matthew effect in science. Science, 159(3810):56–63, 1968. doi: 10.1126/science.159.3810.56
-
[23]
Simon G. Enger. Closed clubs: Network centrality and participation in Horizon 2020.Science and Public Policy, 45(6):884–896, 2018. doi: 10.1093/scipol/scy029
-
[24]
Fresco, André Martinuzzi, et al
Louise O. Fresco, André Martinuzzi, et al. Commitment and coherence: Ex-post-evaluation of the 7th EU framework programme (2007–2013). Technical report, European Commission, High Level Expert Group, Brussels, 2015
2007
-
[25]
BERTopic: Neural topic modeling with a class-based TF-IDF procedure
Maarten Grootendorst. BERTopic: Neural topic modeling with a class-based TF-IDF proce- dure. arXiv preprint arXiv:2203.05794, 2022. doi: 10.48550/arXiv.2203.05794
work page internal anchor Pith review doi:10.48550/arxiv.2203.05794 2022
-
[26]
Blei, Andrew Y
David M. Blei, Andrew Y. Ng, and Michael I. Jordan. Latent Dirichlet allocation.Journal of Machine Learning Research, 3:993–1022, 2003
2003
-
[27]
Mission-oriented innovation policies: Challenges and opportunities
Mariana Mazzucato. Mission-oriented innovation policies: Challenges and opportunities. Industrial and Corporate Change, 27(5):803–815, 2018. doi: 10.1093/icc/dty034
-
[28]
Next-generation innovation policy and grand challenges
Stefan Kuhlmann and Arie Rip. Next-generation innovation policy and grand challenges. Science and Public Policy, 45(4):448–454, 2018. doi: 10.1093/scipol/scy011
-
[29]
Nominatim.https://nominatim.org/
OpenStreetMap Contributors. Nominatim.https://nominatim.org/. Accessed: 2025-01-15
2025
-
[30]
Levenshtein
Vladimir I. Levenshtein. Binary codes capable of correcting deletions, insertions, and reversals. Doklady Akademii Nauk SSSR, 163(4):845–848, 1966. English translation in:Soviet Physics Doklady, 10(8):707–710, 1966. 32
1966
-
[31]
Eu cash goes to the sticky and attractive.Nature, 531 (7596):580–580, 2016
Manlio De Domenico and Alex Arenas. Eu cash goes to the sticky and attractive.Nature, 531 (7596):580–580, 2016
2016
-
[32]
GSHHG dataset.https://www.soest.hawaii.edu/pwessel/gshhg/
-
[33]
Jianlv Chen, Shitao Xiao, Peitian Zhang, Kun Luo, Defu Lian, and Zheng Liu. M3-Embedding: Multi-linguality, multi-functionality, multi-granularity text embeddings through self-knowledge distillation. arXiv preprint arXiv:2402.03216, 2024. doi: 10.48550/arXiv.2402.03216
work page internal anchor Pith review doi:10.48550/arxiv.2402.03216 2024
-
[34]
UMAP: Uniform Manifold Approximation and Projection for Dimension Reduction
Leland McInnes, John Healy, and James Melville. UMAP: Uniform manifold approximation and projection for dimension reduction.arXiv preprint arXiv:1802.03426, 2018. doi: 10.48550/ arXiv.1802.03426
work page internal anchor Pith review arXiv 2018
-
[35]
Ricardo J. G. B. Campello, Davoud Moulavi, and Jörg Sander. Density-based clustering based on hierarchical density estimates. InPacific-AsiaConference on KnowledgeDiscoveryand Data Mining (PAKDD), pages 160–172. Springer, 2013. doi: 10.1007/978-3-642-37456-2_14
-
[36]
Jillian Beardwood, John H. Halton, and John M. Hammersley. The shortest path through many points. Mathematical Proceedings of the Cambridge Philosophical Society, 55(4):299– 327, 1959. doi: 10.1017/S0305004100034095
-
[37]
J. Michael Steele. Growth rates of Euclidean minimal spanning trees with power weighted edges. Annals of Probability, 16(4):1767–1787, 1988. doi: 10.1214/aop/1176991596
-
[38]
W. Brian Arthur. Competing technologies, increasing returns, and lock-in by historical events. The Economic Journal, 99(394):116–131, 1989. doi: 10.2307/2234208
-
[39]
Dominique Foray.Smart Specialisation: Opportunities and Challenges for Regional Innovation Policy. Routledge, 2015. doi: 10.4324/9781315726106
-
[40]
Gravity equations: Workhorse, toolkit, and cookbook
Keith Head and Thierry Mayer. Gravity equations: Workhorse, toolkit, and cookbook. In Handbook of international economics, volume 4, pages 131–195. Elsevier, 2014
2014
-
[41]
How do travel costs shape col- laboration? Management Science, 66(8):3340–3360, 2020
Christian Catalini, Christian Fons-Rosen, and Patrick Gaulé. How do travel costs shape col- laboration? Management Science, 66(8):3340–3360, 2020. 33
2020
discussion (0)
Sign in with ORCID, Apple, or X to comment. Anyone can read and Pith papers without signing in.